Computed Tomography
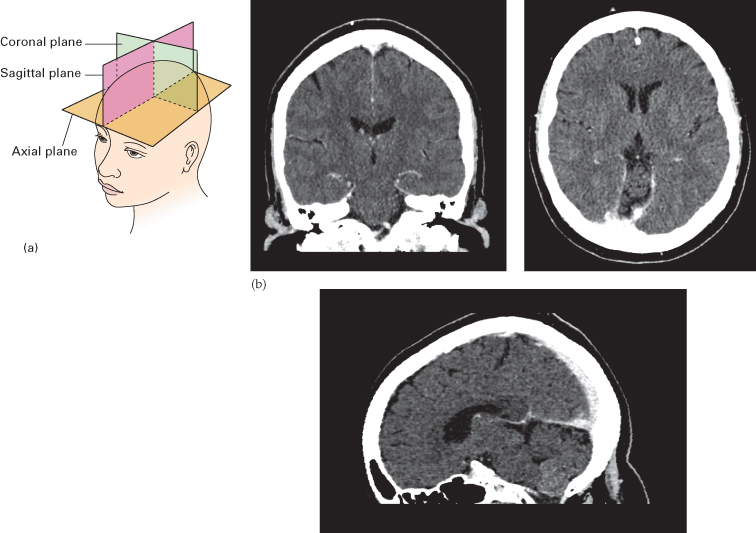
A routine CT examination of the brain involves making 20–30 axial sections. The axial plane is also the routine viewing projection but, if sufficiently thin, reconstructions can be made from the axial sections, which then provide images in any other plane (Fig. 15.2). However, to enable good differentiation of grey and white matter, a slice thickness of 3–5 mm is needed. The window settings are selected for brain tissue or bone, depending on the structure being assessed (see Fig. 15.33).
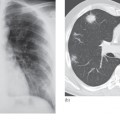
Fig. 15.2 (a) Diagram of the axial, coronal and sagittal planes. (b) Corresponding CT images of a normal brain.
Contrast Enhancement for Computed Tomography
The brain parenchyma does not normally enhance following an intravenous injection of contrast medium due to the blood–brain barrier (BBB) – the endothelial lining of cerebral vessels preventing passage of solutes. Contrast enhancement of a brain lesion is therefore a consequence of breakdown of the BBB such as with ischaemia, inflammation and neoplasms (Box 15.1). Intracranial lesions (such as meningiomas) supplied by the external carotid artery, which lacks a BBB, will often enhance avidly. There is also no BBB in the pituitary, pineal and choroid plexuses, which will normally enhance. Contrast is therefore only used routinely to evaluate vessels and extra-axial lesions or to increase the conspicuity of brain lesions.
- Choroid
- Anterior pituitary gland
- Arteries
- Dural venous sinuses
- Metastases
- Some primary gliomas
- Meningiomas
- Abscess
- Acute demyelination
Computed Tomography Angiography
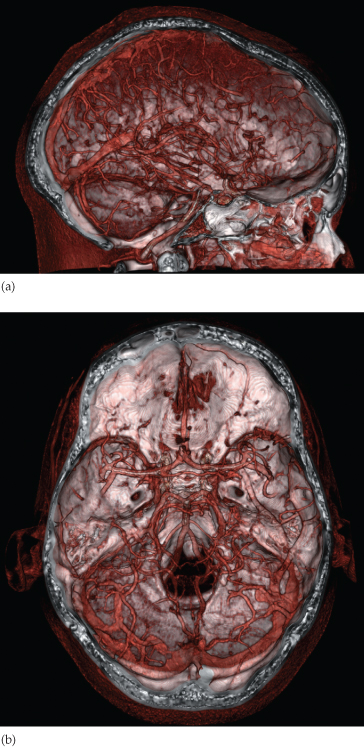
If thin slices are acquired following contrast administration, detailed reconstructions of the vessels can be created in multiple planes and with surface-shaded three-dimensional images (Fig. 15.3). CT angiography has replaced conventional angiography for the initial diagnosis of arterial occlusions, aneurysms and arteriovenous malformations (AVMs). The venous phase of the angiogram can give information on the venous sinuses of the brain such as when looking for thrombosis. Perfusion CT is a new technique that can quantify the passage of contrast through the brain to evaluate the presence and extent of infarction and ischaemia in stroke patients who may be candidates for thrombolysis treatment.
Fig. 15.3 Surface-shaded CT angiograms. (a) Sagittal and (b) axial images created from a contrast-enhanced CT scan showing the normal arteries and veins of the brain.
Normal Head Computed Tomography
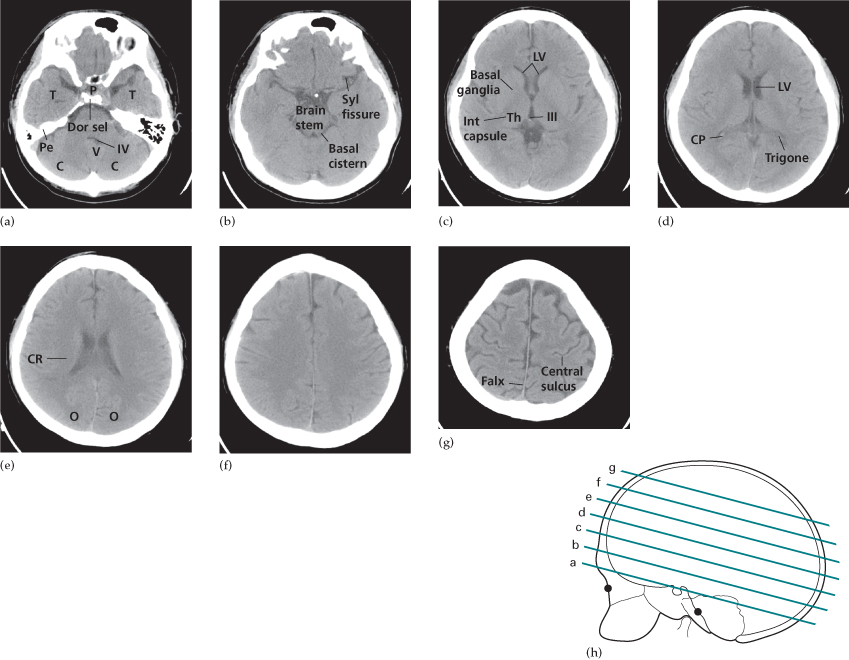
A normal CT scan of the head is illustrated in Fig. 15.4. The cerebrospinal fluid (CSF) is seen as water density within the ventricular system and subarachnoid space surrounding the brain. It is possible to distinguish the white and grey matter of the brain due to the higher fat content within myelinated white matter, which is therefore of lower attenuation. The larger arteries at the base of the brain can usually be identified within the CSF-containing basal cisterns. Calcification is normally seen in the pineal gland and choroid plexus particularly in the lateral ventricles. Pathological calcification can be seen in abnormal vessels such as an AVM or aneurysm and some types of brain tumour. The supratentorial regions are usually well shown, but details of the posterior fossa may be obscured by artefact from the surrounding bone.
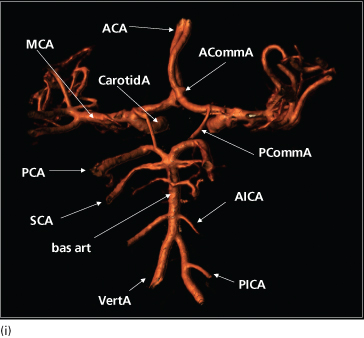
Fig. 15.4 (a–g) Normal head CT images. The levels at which the sections were taken are indicated in the diagram (h). C, cerebellar hemisphere; CP, choroid plexus; CR, corona radiata; Dor sel, dorsum sellae; III, third ventricle; Int capsule, internal capsule; LV, lateral ventricle; O, occipital lobe; P, pituitary gland; Pe, petrous bone; Syl fissure, Sylvian fissure; T, temporal lobe; Th, thalamus; V, vermis. (i) (Opposite) Surface-shaded CT angiogram with the major intracranial arteries labelled. ACA, anterior cerebral artery; ACommA, anterior communicating artery; AICA, anterior inferior cerebellar artery; bas art, basilar artery; CarotidA, carotid artery; MCA, middle cerebral artery; PCA, posterior cerebral artery; PCommA, posterior communicating artery; PICA, posterior inferior cerebellar artery; SCA, superior cerebellar artery; VertA, vertebral artery.
Abnormal Head Computed Tomography
When an abnormality is seen, it is important to decide whether it has an intra-axial or extra-axial location as the pathologies and therefore the differential diagnosis are very different. Intra-axial lesions can involve the white and grey matter structures of the brain parenchyma, while extra-axial lesions may involve the meninges, extracerebral spaces and skull vault. Specific diagnoses are suggested by combining the clinical features with information about multiplicity, size, position and density of the lesion.
The key signs of an abnormality on a CT scan are:
- abnormal tissue density
- mass effect
- enlargement of the ventricles.
Abnormal Tissue Density
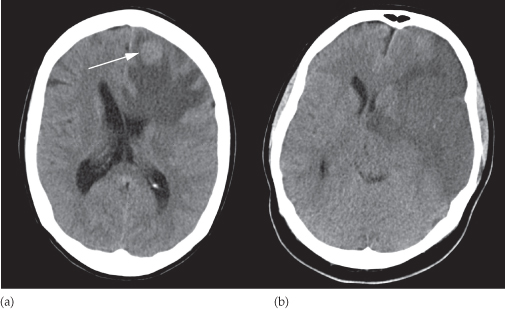
Abnormal tissue may be of higher or lower density than the normal surrounding brain. High density is seen with acute haemorrhage (see Figs 15.21 and 15.22), calcification and areas of contrast enhancement (see Fig. 15.25). Low density can be due to cytotoxic oedema associated with infarcts, or to vasogenic oedema, which commonly surrounds neoplasms, abcesses and other areas of inflammation. Cytotoxic oedema will involve both the white and grey matter structures (Fig. 15.5b), whereas vasogenic oedema is limited to the white matter and characteristically shows finger-like projections into the subcortical white matter in the gyri. (Fig. 15.5a).
Fig. 15.5 Types of oedema. (a) Unenhanced CT image demonstating vasogenic oedema around a hyperdense brain metastasis (arrow). Note how the oedema extends through the white matter but spares the overlying grey matter cortex. (b) Unenhanced CT demonstrating a wedge-shaped area of cytotoxic oedema from an ischaemic stroke involving the middle cerebral artery territory and both the grey matter cortex and the underlying white matter. Both are associated with mass effect causing distortion of the lateral ventricles.
Mass Effect
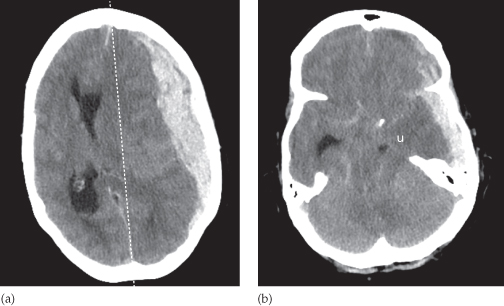
The normally symmetrical lateral ventricles should be examined to see if they are displaced or compressed. Shift of midline structures, such as the septum pellucidum, the third ventricle or the pineal gland away from a lesion indicates a significant mass effect (Fig. 15.6a). Ventricular dilatation will occur if the mass obstructs the flow of CSF. A mass effect may also show itself by effacing the basal cisterns, such as when the suprasellar cistern is obscured by downward movement of the medial temporal lobes over the tentorium cerebellum (uncal herniation – Fig. 15.6b) or the cerebellar tonsils through the foramen magnum.
Fig. 15.6 Brain herniation. Unenhanced CT scans showing subfalcine and downward transtentorial herniation due to an acute subdural haematoma. (a) In subfalcine herniation there is a shift of brain and ventricles across the midline (dashed line). (b) In downward transtentorial herniation there is obliteration of the normal CSF-containing basal cisterns and herniation of the medial temporal lobe over the tentorium cerebellum. u, uncus.
Enlargement of the Ventricles
There are two basic mechanisms that cause the cerebral ventricles to enlarge:
- Obstruction to the CSF pathway, either within the ventricular system (obstructive hydrocephalus) or over the surface of the brain (Fig. 15.7).
- Secondary to atrophy of the surrounding brain tissue (see Fig. 15.29a).
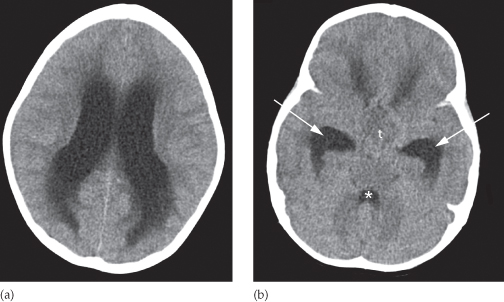
Fig. 15.7 Obstructive hydrocephalus. Axial CT images performed at the level of the lateral ventricles (a) and more inferiorly at the level of the temporal horns (b). The lateral ventricles including the temporal horns (arrows) are dilated but the fourth ventricle (*) is normal in size. The CSF-filled sulci normally seen along the convexeties of the cerebral hemispheres are also effaced. The hydrocephalus was due to a tumour (t) obstructing the aqueduct, which connects the third and fourth ventricles.
Magnetic Resonance Imaging
The advantage of brain MRI is its superior spatial and contrast resolution without the artifact problems associated with local bone structures on CT. Therefore, the anatomy of the brain can be exquisitely displayed and enables much better visualization of brain pathologies, particularly in areas such as around the skull base for the pituitary gland and the posterior fossa which are poorly seen by CT. The routine sequences used for MRI vary but usually include T1- and T2-weighted sequences in orthogonal planes (Fig. 15.8). A FLAIR (fluid attenuated inversion recovery) sequence is useful as the pulse sequence nulls the bright signal from CSF, making brain pathology (usually T2 bright) more visible. Magnetic resonance can also recognize flowing blood within larger arteries and veins, which can be examined without the need for contrast medium to create intracranial angiograms (Fig. 15.9).
Fig. 15.8 Normal brain MRI. The images are axial sections at the level of the lateral ventricles. (a) T2-weighted image. (b) FLAIR image. (c) A midline sagittal section (T1-weighted).
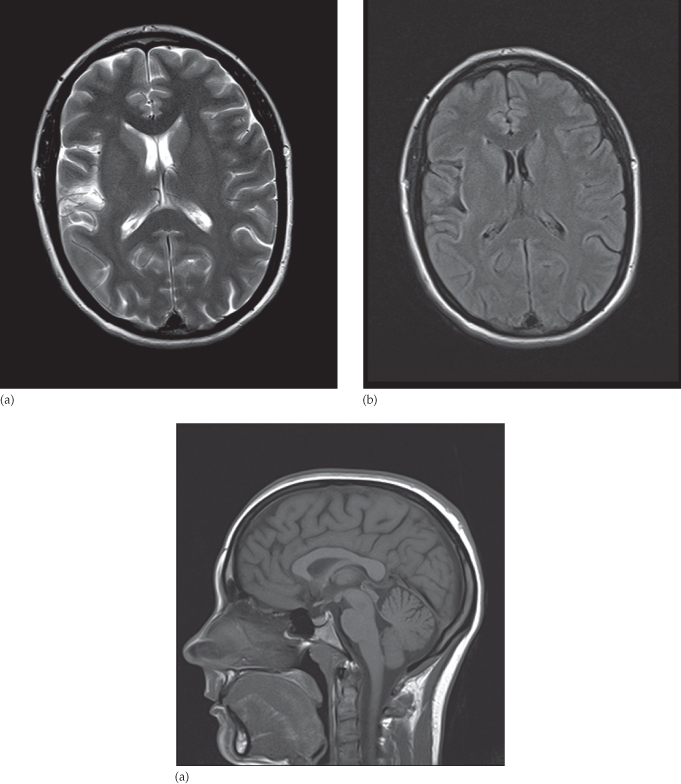
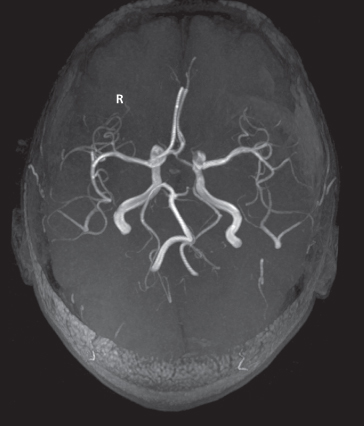
Fig. 15.9 Magnetic resonance angiography (MRA). The arteries at the base of the brain, the circle of Willis, are very well shown by MRA without the use of any contrast agent.
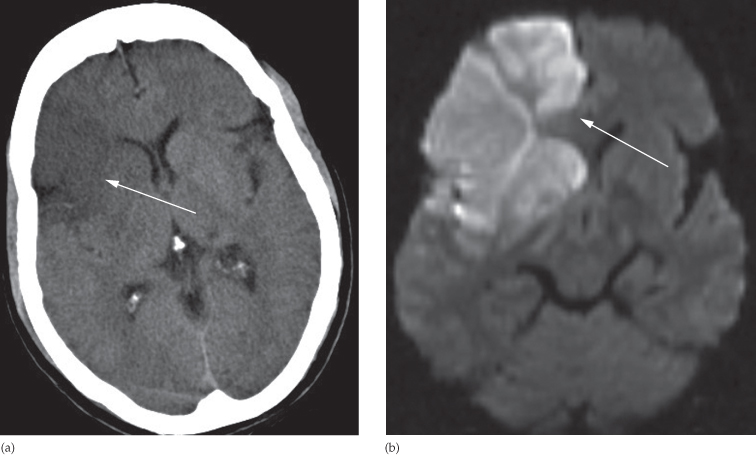
The diffusion-weighted imaging (DWI) sequence looks at the normally random movement of water molecules in brain tissue and is extremely useful, particularly when the patient is suspected of having an acute stroke. Within areas of cytotoxic oedema such as an infarct, the movement of water molecules in the extracellular space is limited by the swollen, dying cells and this produces bright signal, whereas the movement of water within vasogenic oedema is not limited (free) and does not produce any signal change. The DWI scan becomes positive within minutes of an acute stroke (Fig. 15.10) whereas CT abnormalities can take hours and will miss very small infarcts. Restricted diffusion within a cystic mass is also relatively specific for pus within a pyogenic abscess.
Fig. 15.10 DWI in stroke. (a) An unenhanced CT image showing low attenuation in the right frontal lobe and basal ganglia (arrow). (b) Diffusion-weighted MRI showing bright signal indicating the extent of restricted diffusion due to an acute infarct; it is more extensive anteriorly (arrow).
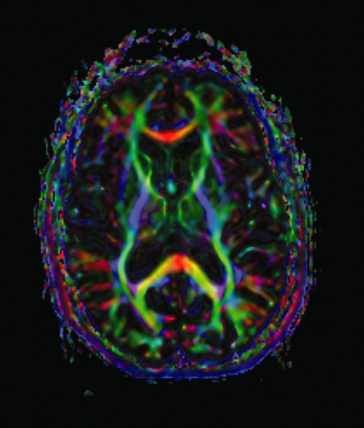
The water molecules in normal axons making up the white matter are unlikely to traverse the myelin sheath and therefore flow more rapidly in the direction of the axon bundle. An advance in diffusion imaging uses this feature to demonstrate the location and orientation of the tracts connecting various parts of the brain: an investigation known as diffusion tensor imaging or tractography, which may be helpful for studying white matter pathways in disease (Fig. 15.11) and for surgical planning.
Fig. 15.11 Diffusion tractography image derived from diffusion data showing the structural connectivity of the brain where white matter fibres running in the same orientation are ascribed the same colour.
Courtesy of Dr Maddigan, St George’s Hospital, London.
Functional MRI utilizes different techniques to measure the blood flow to parts of the brain which changes depending on the neuronal activity in that location at the time of scanning. The patient is usually scanned whilst performing various tasks such as memory recall and the scan produces a map of brain activity superimposed on the anatomical location. The technique may be useful in understanding brain function, particularly in psychiatric disorders.
The disadvantages of MRI compared with CT include the limited visualization of calcification and lack of bone detail. Each sequence has to be acquired separately so the overall scan time is much longer, during which the patient has to lie still, and monitoring seriously ill patients within the scanner can be difficult. If intubated, the life support and monitoring equipment must be MRI compatible. Any intracranial ferrous metal present such as aneurysm clips or cochlear implants are absolute contraindications.
Contrast Enhancement for Magnetic Resonance Imaging
Although the natural differences in MRI signal intensity are great, contrast agents can be used to give additional information. Like the intravenous iodinated agents used for CT, the gadolinium compounds used for MRI enhancement are excluded from the normal brain substance by the BBB. Breakdown of the BBB, such as by tumours or abscesses, means that contrast will accumulate within these pathological processes and show high signal intensity (i.e. they appear white) on T1-weighted images (see Box 15.1 and Fig. 15.15b).
Related posts:
Stay updated, free articles. Join our Telegram channel

Full access? Get Clinical Tree


