Breast Cancer
Bruce L. Daniel
Magnetic resonance imaging (MRI) is widely accepted as a tool for imaging the breast because it detects more cancer than standard projection x-ray mammography (Fig. 63.1).1 Currently, very high sensitivity is only achieved with the administration of intravenous (IV) gadolinium-based contrast agents; unenhanced MRI techniques are much less sensitive for breast cancer. Dynamic contrast-enhanced (DCE) methods are important for breast cancer MRI because some tumors may be difficult to distinguish from normal enhancing breast tissue during the equilibrium phase of contrast enhancement. This chapter reviews the basis for imaging breast cancer using DCE MRI and the clinical indications for breast MRI among patients with known or suspected breast cancer.
Anatomy and Pathophysiology of Breast Cancer
Anatomy of the Normal Breast
Architecture
The normal human breast consists of approximately 10 to 20 milk-producing glandular lobules that each drain via a mammary duct into the nipple. These lobules are suspended by fibrous stroma and suspensory ligaments (of Cooper) within adipose tissue. The larger, more linear central milk ducts draining each lobule radiate from the nipple. Aside from at the nipple, the parenchyma of the breast is separated from other body tissues, such as the skin and
nearby chest wall muscles, by relatively loose fat. In some patients, fibroglandular breast tissue protrudes into the axillary fat that is adjacent to the breast (axillary tail of Spence). Because the breasts are not well anchored except at the nipple, the breasts are pliable and much more susceptible to nonrigid motion and deformation than other appendages. Even subtle respiratory motion can cause significant misregistration artifacts in serially repeated DCE scans (see below).
nearby chest wall muscles, by relatively loose fat. In some patients, fibroglandular breast tissue protrudes into the axillary fat that is adjacent to the breast (axillary tail of Spence). Because the breasts are not well anchored except at the nipple, the breasts are pliable and much more susceptible to nonrigid motion and deformation than other appendages. Even subtle respiratory motion can cause significant misregistration artifacts in serially repeated DCE scans (see below).
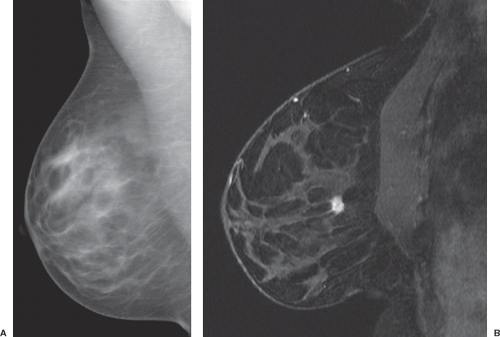 FIGURE 63.1. Mammographically occult breast cancer. This woman underwent screening because of a strong family history of breast cancer in her father. Digital x-ray mammography was unrevealing (A). Contrast-enhanced MRI discovered a spiculated mass in the posterior breast (B). Targeted ultrasonography showed no mass. Magnetic resonance imaging–guided biopsy revealed a small invasive ductal carcinoma. |
Vascular Supply
The arterial blood supply to the breast arises from multiple branches of thoracodorsal artery, a branch of the axillary artery that descends the anterolateral chest wall. Other small arteries penetrate the underlying pectoral muscles to enter the breasts and may initially arise from the internal mammary arteries that descend the lateral margins of the sternum just deep to the costochondral cartilages or from the intercostal arteries. Once in the breast, these dominant arteries tend to run with adjacent paired draining veins in the subcutaneous fat that overlies the central cone of fibroglandular tissue, sending smaller branches into the breast parenchyma. These veins eventually drain back to the subclavian veins. The small caliber of the arteries directly supplying the breast present a challenge to direct measurement of the intravascular contrast-enhancement signal feeding the breast or arterial input function. These breast-specific arteries are so small they are difficult to resolve separately from adjacent veins without very high spatial resolution. However, high resolution implies slow scan time and limited signal-to-noise ratio (SNR), which make it extremely difficult to accurately resolve the dynamics of rapidly changing intravascular signal after a bolus of IV gadolinium contrast material.
Lymphatics and Intramammary Lymph Nodes
The extracellular space of the breast drains into lymphatics, which often course through the subcutaneous space before draining into small intramammary lymph nodes, which then drain via larger lymphatics to axillary and internal mammary nodes. Lymphatic spread of tumor can plug dermal lymphatics, causing thickening or peau d’orange in cases of locally advanced breast cancer. Intramammary lymph nodes are frequently found along blood vessels in the subcutaneous fat of the upper outer quadrant of the breast. Like all normal lymph nodes, the parenchyma of intramammary lymph nodes is highly perfused and has very permeable microvascular supply. Thus normal nodes enhance rapidly and avidly with contrast material and then the contrast material is cleared rapidly, in parallel with the concentration of contrast material in the plasma after bolus injection. This pattern of rapid initial enhancement followed by early washout can mimic invasive tumors in the breast (Fig. 63.2).2 Despite this, normal intramammary nodes can usually be definitively identified by their characteristic location in the upper outer quadrant in close proximity to visible vessels, their smooth margins, their oval shape, their central fatty hilum and their intrinsic high T2 signal. However, intramammary nodes in other locations occasionally pose a diagnostic dilemma. Often, normal intramammary nodes have a characteristic echogenic hilum, smooth capsule, and feeding vessel that can be confirmed by ultrasonography, obviating the need for biopsy.
 FIGURE 63.2. Normal lymph node. Normal lymph nodes have a small rim of enhancing parenchyma surrounding a nonenhancing fatty hilum (A). The parenchyma enhances rapidly and washes out rapidly following intravenous bolus infusion of 0.1 mmol/kg gadolinium-based contrast material at 2 mL/s (B). |
 FIGURE 63.3. Normal pectoralis major muscle. Note overall enhancement is not very bright (A). Initial rate of enhancement is fast, followed by a plateau or (in other examples) even slight early washout (B). |
Chest Wall Muscle
The pectoralis major muscle is the primary muscle deep to the normal breast. A small superficial sternalis muscle may also be present, running vertically along the sternal margin. Beneath the pectoralis major muscle is the pectoralis minor muscle. Deep to the pectoralis minor muscle, between the ribs, are the intercostal muscles. Laterally, the serratus anterior may also insert along the ribs deep to the pectoralis. Skeletal muscle has a small extravascular space and is poorly perfused (except during exercise). Thus, although normal skeletal muscle may enhance rapidly (and has been proposed as a “reference region” for reference-based pharmacokinetic modeling), it does not enhance avidly and thus it does not appear very hyperintense (Fig. 63.3).
Tissue Composition
The breast parenchyma is composed of a mixture of fibroglandular tissue and fat. Unlike other organs, breast parenchyma has a very wide normal range of composition. The American College of Radiology (ACR) lexicon recognizes four categories that describe the ratio of fibroglandular tissue relative to intramammary fat including: (a) Dense (almost entirely fibroglandular tissue; <25% fat); (b) heterogeneously dense (25% to 50% fat); (c) scattered fibroglandular densities (50% to 75% fat); and (d) fatty (predominantly fat; more than 75% fat) (Fig. 63.4). Some of these variations are associated with age (younger women tend to have denser breasts),3 race (Asians tend to have denser breasts),3 hormonal status (premenopausal
women and women on hormone replacement therapy have denser breasts), and body habitus (low body mass index is associated with dense breasts). Despite this, there is substantial variation in breast density between individuals. Although minor variations have been reported in some women over their menstrual cycle, in most women, breast density remains constant. Recently, increased breast density has been associated with a modest increase in risk of developing breast cancer.4 MRI is emerging as the most accurate noninvasive way to quantify breast density using three-dimensional segmentation algorithms and specific fat-water decomposition methods.3,5
women and women on hormone replacement therapy have denser breasts), and body habitus (low body mass index is associated with dense breasts). Despite this, there is substantial variation in breast density between individuals. Although minor variations have been reported in some women over their menstrual cycle, in most women, breast density remains constant. Recently, increased breast density has been associated with a modest increase in risk of developing breast cancer.4 MRI is emerging as the most accurate noninvasive way to quantify breast density using three-dimensional segmentation algorithms and specific fat-water decomposition methods.3,5
 FIGURE 63.4. T1-weighted and fat-suppressed pre-contrast T1-weighted magnetic resonance images of women with different breast densities, including dense (A, B), heterogeneously dense (C, D), scattered densities (E, F), and fatty (G, H). (continued) |
 FIGURE 63.5. Dynamic contrast enhancement of the normal breast. A region of interest encompassing the normal fibroglandular tissue in the breast (A) reveals gradual washin and persistent late enhancement following intravenous bolus infusion of 0.1 mmol/kg gadolinium-based contrast material at 2 mL/s (B). |
Adipose tissue in the breast has an extremely low vascular volume and a low extracellular space volume. Also the lipid protons that generate the MR signal from adipose tissue are intracellular. Thus standard gadolinium-based contrast agents (which are delivered from the plasma compartment to the extracellular space) do not lead to significant enhancement of pure adipose tissue.
Fibroglandular tissue in the breast is composed of glandular elements including terminal ductal lobular units (TDLU) and the milk ducts that drain them and stroma. The relative volume of extracellular space, where contrast agents accumulate, depends on the ratio of glandular tissue (which has a relatively low extracellular volume) to fibrous tissue (which has a large extracellular volume fraction). Although the fibroglandular elements of the breast are better perfused than adipose tissues, intravascular volume is still very low compared with many solid organs. Note that based on the volume ratio of adipose to fibroglandular tissue, overall contrast enhancement can vary.
Microvascular Physiology of the Normal Breast
Normal Variations of Breast Microcirculation: Background Parenchymal Enhancement
The normal nonlactating breast is relatively poorly perfused and has relatively nonpermeable endothelium, hence it does not enhance rapidly following an intravenous bolus injection of gadolinium-based contrast material. However, some normal enhancement can occur (Fig. 63.5). Usually normal background enhancement is diffuse or limited to the periphery of the fibroglandular tissue away from the nipple (i.e., so-called cortical enhancement; Fig. 63.6). This low-level
enhancement occurs gradually, usually without washout. Other patterns include numerous very small, multiple submillimeter foci of enhancement, so-called stippled background enhancement. Background enhancement is not correlated with breast density.6,7
enhancement occurs gradually, usually without washout. Other patterns include numerous very small, multiple submillimeter foci of enhancement, so-called stippled background enhancement. Background enhancement is not correlated with breast density.6,7
 FIGURE 63.6. Benign cortical enhancement. Note a thin rim of gradual, progressive enhancement at the periphery of the cone of fibroglandular tissue on T1-weighted contrast-enhanced dynamic images (A). Like other background enhancement, this is gradual and persistent (B). When symmetric and gradual, this is a benign pattern. |
 FIGURE 63.7. Focal menstrual cycle variations in contrast enhancement. Initial magnetic resonance image obtained during the fourth week of the cycle (A, green arrow) revealed a focal area of contrast enhancement in the posterior breast. Repeat imaging 3 weeks later during the second week of her cycle (B) showed complete resolution. on dynamic imaging the hormonal enhancement was gradual (C). |
Hormone-Mediated Variations
Significant variations in background fibroglandular tissue contrast enhancement occur throughout the menstrual cycle of many premenopausal women.8 Overall enhancement tends to increase throughout the cycle, peaking at the fourth week. In general, enhancement is lowest in the second week.9 These changes in perfusion and microvascular permeability most likely occur in response to progesterone. Most menstrual variations are global, symmetric, and bilateral. However, some women demonstrate temporary enhancement of localized asymmetric regions that can be confused with enhancing tumors (Fig. 63.7). Repeat scanning at a different time in the menstrual cycle is occasionally helpful to distinguish transient hormone-mediated enhancement from enduring enhancement due to malignancy. The time course of enhancement due to menstrual cycle variations is also more gradual. Dynamic imaging, as discussed below, can help distinguish some menstrual variations from true tumor enhancement.
Aromatase inhibitors, which block the production of estrogen, decrease background enhancement.10 Background enhancement is also less common among postmenopausal women,11 presumably due to the lower normal levels of estrogen and progesterone. Background enhancement decreases after breast-conserving radiotherapy as well (Fig. 63.8).12
 FIGURE 63.8. Decreased background enhancement due to prior whole breast irradiation. Note the complete lack of background enhancement in the left breast (red arrow), which was treated with lumpectomy and whole-breast irradiation 13 years before, for an invasive ductal carcinoma. |
Similarly, it is theoretically plausible that other exogenous hormones, such as oral contraceptives, hormone replacement therapy, and agents used to stimulate the ovaries during management of infertility, could affect the degree of background enhancement, but definitive correlations have not been widely reported.
Lactation
Lactation is associated with major changes in breast tissue. Breast volume and density increase as glandular tissue hypertrophies to enable milk production. Perfusion increases, leading to rapid initial enhancement with contrast material.13 However, extracellular space is minimal, so the overall peak level of enhancement is less than many other benign and malignant conditions. Enhancement from breast tumors often exceeds the rapid background enhancement in lactating women,13 however, overall diagnostic accuracy among lactating women has not been extensively studied (Fig. 63.9).
The overall amount of gadolinium excreted into breast milk is minimal.14 However, due to the unknown, small, potential risk of oral ingestion of gadolinium-based contrast material to the infant, some practitioners recommend that nursing mothers pump and discard their breast milk for up to 24 hours following gadolinium administration.15
Microvascular Changes in Breast Tumors
Breast malignancies usually cause profound alterations in the microvasculature. These changes include inflammation, angiogenesis, and necrosis. As a result, almost all tumors enhance briskly with IV gadolinium contrast material on DCE MRI, making them much brighter than gradual background enhancement. Rarely, some tumors, such as infiltrating lobular carcinoma and some ductal carcinoma in situ (DCIS), may not enhance above background,16 presumably because these tumors grow by microscopically infiltrating the normal breast stroma, and do not cause inflammation or angiogenesis.
Inflammation
Acute and chronic inflammation may lead to increased perfusion and vascular permeability and cause contrast enhancement. Infection and noninfectious mastitis, areas of wound
healing, scars, foreign body reaction, and fat necrosis are all associated with contrast enhancement. Many breast tumors, including invasive carcinomas and some DCIS, incite a local inflammatory response, as evidenced by lymphocytic infiltration frequently seen histologically.17,18 This inflammation increases perfusion, as evidenced by elevated temperature in many tumors. Vascular permeability is also frequently increased, resulting in edema and increased interstitial pressure in many tumors. As with inflammation elsewhere in the body, increased perfusion and permeability lead to rapid, strong signal enhancement following bolus intravenous injection of gadolinium-based contrast agents. Usually benign inflammation enhances less avidly, less rapidly, and more continuously (e.g., no washout) than tumor enhancement. However, in some cases, even benign inflammation can have such exuberant rapid enhancement that it cannot be distinguished from tumor (Fig. 63.10).
healing, scars, foreign body reaction, and fat necrosis are all associated with contrast enhancement. Many breast tumors, including invasive carcinomas and some DCIS, incite a local inflammatory response, as evidenced by lymphocytic infiltration frequently seen histologically.17,18 This inflammation increases perfusion, as evidenced by elevated temperature in many tumors. Vascular permeability is also frequently increased, resulting in edema and increased interstitial pressure in many tumors. As with inflammation elsewhere in the body, increased perfusion and permeability lead to rapid, strong signal enhancement following bolus intravenous injection of gadolinium-based contrast agents. Usually benign inflammation enhances less avidly, less rapidly, and more continuously (e.g., no washout) than tumor enhancement. However, in some cases, even benign inflammation can have such exuberant rapid enhancement that it cannot be distinguished from tumor (Fig. 63.10).
 FIGURE 63.9. Lactational invasive ductal breast cancer. This 33-year-old woman presented with a palpable breast mass and nodal involvement while pregnant. Postpartum lactating water-specific magnetic resonance imaging revealed marked glandular hypertrophy and enlargement of the central ducts. The palpable tumor is visible as an area of rim enhancement within surrounding diffusely enhancing glandular tissue (A). The tumor (blue arrow) enhances rapidly and demonstrates early washout of contrast. The normal lactating breast (red arrow) also enhances very rapidly and has a plateau of late enhancement. Overall peak enhancement of the tumor (about 90%) is also greater than the normal breast (about 60%) (B). |
Overall, the increased blood flow associated with large breast cancers leads to dilation of the macroscopic vessels in the affected breast as well. Increased size and number of macroscopic vessels has been reported as a specific sign of breast cancer.19,20
 FIGURE 63.10. Benign granulomatous mastitis. Multifocal enhancing masses and non-mass-like areas of enhancement are present (A). on T2-weighted precontrast images, there is a corresponding heterogenous increased T2 indicating edema and focal abscesses (B). Rapid initial dynamic contrast enhancement is present (C). Abscess formation and fistulization to the skin are relatively characteristic of this condition, but overall the appearance frequently overlaps with inflammatory breast cancer or advanced lobular carcinoma, so biopsy is necessary for a definitive diagnosis. |
 FIGURE 63.11. Inflammatory breast cancer. Axial T2-weighted fat-suppressed three-dimensional fast spin echo shows postcontrast skin thickening (A, green arrows) and high signal subcutaneous edema as well as scattered additional areas of edema deeper in the breast (blue arrows) and a relatively lower signal mass (red arrows). With contrast, nearly the entire breast enhances abnormally (B, red arrows) consistent with widespread multifocal carcinoma. Skin thickening and enhancement are also present. on dynamic imaging, the tumor enhances very rapidly and demonstrates early washout (C). Skin enhancement is more gradual but still abnormal for skin. |
Edema
Breast cancers may be associated with edema, which has been reported as a specific sign,21,22 especially when found immediately adjacent to the tumor.23 Edema may even diffuse into the overlying skin. Severe, extensive, aggressive breast cancers may cause diffuse breast edema and skin thickening. Clinically, this presentation is termed inflammatory breast cancer (Fig. 63.11). In these patients, the extent of enhancing abnormality on MRI can more clearly correspond to the extent of underlying tumor than clinical assessment. Histologically, microscopic foci of tumor cells can be found in the dermal or subdermal lymphatics on punch biopsy of the skin. However, there is overlap with acute mastitis.24
Angiogenesis
Most breast tumors are associated with neovascularity. Histologically, elevated microvessel counts are present. Tumor angiogenesis in the breast is associated with increased perfusion and increased permeability relative to normal breast tissue and hence leads to preferential contrast enhancement of breast tumors when compared with background normal breast tissue.
The near universal enhancement of invasive breast tumors with contrast material initially led investigators to assume that angiogenesis is the cause of contrast enhancement in breast tumors. However, studies attempting to correlate microvessel density with DCE parameters measured by MRI show only modest correlations.25,26 Surprisingly, the diagnostic accuracy of histologic microvessel density is not nearly as good as the diagnostic accuracy of contrast-enhanced MRI. Possible explanations for the lack of correlation include unreliability of histologic metrics of angiogenesis. It is also possible that the abnormal physiology of tumoral vessels, including inflammation and increased perfusion and increased permeability,27 rather than excessive new blood vessel proliferation, accounts for much of the contrast enhancement found in tumors.
Microvascular Alteration in Tumors: Necrosis
Breast tumors can grow faster than the blood supply to the tumors, leading to poorly perfused, relatively hypoxic areas within the central portions of the tumor.26 These central areas undergo structural changes, including fibrosis, and occasionally even frank tissue necrosis; only the periphery of the tumor remains well perfused. This is one cause of the rim sign or early peripheral enhancement.28 The poor perfusion of central fibrotic regions leads to slow enhancement, although on delayed imaging enhancement it can be avid given the expanded extracellular space. Frank areas of liquefaction necrosis are not perfused, thus they do not enhance, although some contrast material may passively diffuse into necrotic areas from the surrounding tumor very slowly. Liquefaction necrosis is very rare in all but the largest locally advanced tumors.
Ductal Permeability Hypothesis
Recently, microscopic studies of breast ducts have demonstrated the presence of gadolinium within the lumen of the breast duct in animal models of DCIS.29 This indicates either breakdown of the ductal epithelium or active transport of contrast material into the duct lumen by epithelial cells. Overall, this lumenal enhancement has been proposed as one cause of the linear ductal enhancement present in some cases of DCIS. However, it is likely that periductal inflammation also causes linear ductal enhancement.30 The relative contributions of lumenal versus periductal enhancement are difficult to distinguish in vivo given the spatial resolution of clinical breast MRI.
Radiation Treatment
Acutely, breast irradiation may be associated with inflammation and increased permeability that can lead to transient diffuse contrast enhancement, although this is usually not a major impediment to diagnosis.31 More commonly, diffuse breast edema occurs. Although usually transient, diffuse edema, especially skin thickening, can occasionally persist for years following radiation treatment and does not necessarily indicate residual or recurrent tumor. Chronically, radiation often leads to decreased background enhancement (Fig. 63.8).
Antineoplastic Drugs
Systemic treatment for breast cancer leads not only to regression of tumor cell burden but also to decrease and renormalization of the microvasculature of the tumor. Usually these processes are correlated. Changes in the microcirculation that are revealed by contrast-enhancement reflect treatment response (as detailed below). It is possible, however, that antiangiogenic agents, such as bevacizumab, can preferentially affect microvasculature compared with the underlying tumor burden and decrease the reliability of MRI contrast enhancement as a metric of tumor response in brain tumors.32 Thus, overall dynamic enhancement patterns are somewhat less accurate after chemotherapy, whether or not bevacizumab was used.33
Techniques for Imaging Breast Vascularity
Contrast enhancement in the breast can be identified with a variety of noninvasive imaging methods using a variety of agents, including scintigraphy (breast-specific gamma imaging) with 99mTc-Sestamibi, positron emission tomography (PET) or positron emission mammography (PEM) with 18F-fluorodeoxyglucose, and x-ray computed tomography (CT) or tomosynthesis or planar imaging (dual-energy mammography) with iodinated contrast agents. Overall, T1-weighted MRI provides the best combination of high sensitivity to contrast enhancement, bilateral simultaneous whole breast coverage, high-resolution three-dimensional acquisitions, all without exposure to ionizing radiation or nephrotoxic contrast agents. T1-weighted MRI is used to detect the bright signal that occurs because of the profound shortening of tissue water proton T1 relaxation rates caused by chelated gadolinium contrast materials. However, it should be noted that some of the agents used by these competing techniques can be more targeted to tumors or specific types of tumors than standard gadolinium-based MRI contrast agents, which are nonselective imaging agents.
Dynamic Contrast-Enhanced Magnetic Resonance Imaging Acquisition Strategies for Breast Cancer
General Requirements
As with all MRI, DCE in the breast is a compromise between coverage, spatial resolution, temporal resolution, and SNR. For breast imaging, bilateral whole breast coverage, including the potential axillary tail, is critical and for most women can be accomplished with a 20-cm field of view in the craniocaudal and anteropostero directions and a 36-cm field of view in the left-right direction. Precontrast scans are necessary as a baseline because intrinsic high T1 signal can occur in some normal and benign structures that must not be mistaken for contrast enhancement. Repeated dynamic scans are necessary throughout the period of contrast uptake to capture initial washin and subsequent washout of contrast material over at least 5 and up to 10 minutes. High spatial resolution must be obtained during at least one volumetric acquisition obtained between 1.5 and 4.5 minutes after contrast injection so that any morphologic features of malignancy are revealed.34 SNR must be maximized to provide the highest quality images, as many forms of breast cancer may show only subtle signs on MRI.
Apparatus: Magnet Strength and Imaging Coils
A high-performance MRI scanner should be used. High-performance gradient systems ensure that the rate of dynamic imaging and the spatial resolution are constrained only by intrinsic available SNR and limits on potential peripheral nerve stimulation set forth by the U.S. Food and Drug Administration or a similar regulating agency rather than by scanner system limits. A field strength of at least 1.5T provides more available magnetization than lower field strengths, increasing the SNR.
Clinical breast MRI is increasingly performed at 3T in an effort to further increase SNR. Using 3T scanning introduces additional complexity because of the unique physics and tissue electrical properties that become relevant at 3T. At 3T, the specific absorption rate (SAR) of radiofrequency (RF) power is fourfold higher that at 1.5T. The associated increase in tissue heating can limit the rate at which high-power RF pulses can be performed, slowing some types of scanning, especially some RF-refocused (spin-echo, fast spin-echo and turbo spin-echo) and interleaved two-dimensional gradient-echo sequences. Modifications can be required to reduce RF power. Also, 3T imaging is plagued by RF transmit field (B1+) inhomogeneity. At 1.5T and below, the transmit magnetic field used to excite spins, B1+, can be assumed to be uniform. At 3.0T, however, B1+ has significant spatial variations within and between the breasts that lead to nonuniform excitation flip angles. This causes spatially variable T1 weighting in gradient-echo images that are commonly used for breast MRI. As a result, in some regions, contrast enhancement can be more or less intense for the same tissue concentration of gadolinium. This can lead to errors in interpretation with some techniques.35 For example, the need to use lower flip angles to reduce RF power for interleaved two-dimensional gradient-echo T1-weighted imaging, combined with the spatial variations in T1 contrast, have led some experts to caution against the use of two-dimensional gradient-recalled echo 3T contrast-enhanced imaging out of concern that enhancing tumors could be missed in some parts of the breasts.35,36 B1+ variations can theoretically lead to misestimation of dynamic contrast uptake parameters as well.37,38 B1+ variations can be measured and used to correct parameter estimation in the future.39 Also, some modifications to the RF transmit systems, such as B1+ shimming or parallel transmit, can achieve more uniform excitation.40,41
Maximizing the image quality of breast MRI also requires a dedicated breast receive coil array with four or more elements in close proximity to the breasts to maximize SNR. All commercial breast coils use prone positioning to minimize respiratory motion in the breast. Many MR centers gently stabilize the breast with external compression paddles or coil elements. Some coils provide open apertures for interventional procedures (biopsies, localizations, etc.), although some designs that are optimized for diagnostic imaging may forgo apertures. Firm compression (as is used for x-ray mammography) should be avoided as this can reduce perfusion to the breasts and theoretically could reduce enhancement of target abnormalities.
An antecubital intravenous catheter and an MR-compatible power injector are commonly used to standardize contrast administration rate and enable remote administration without moving the patient. This also enables immediate delivery of a saline flush (at the same flow rate as the gadolinium injection) after the contrast injection, which improves rapid compact delivery of the contrast agent bolus to the central circulation.
Pulse Sequences
Spoiled gradient-echo sequences provide adequate T1-weighted images with faster scanning than spin-echo sequences. The flip angle must be optimized depending on field strength and repetition time to ensure proper T1 weighting.
Most experts use three-dimensional imaging because it avoids interslice gaps, enables reconstruction of overlapping slice locations thereby improving reformatted images, has lower SAR, and provides faster imaging than multislice 2D imaging. Parallel imaging based on receive coil sensitivities also speeds acquisition, accelerating rapid dynamic scanning or higher resolution scanning by two to four times, using commercially available coils.
Fat suppression is often preferred for high-spatial resolution imaging so morphologic features such as spiculation, irregular margins, internal septae, rim enhancement, and periductal enhancement can be clearly seen without competing high signal from fat. Fat suppression can also reduce motion artifacts during subtraction processing by eliminating high signal from fat. Intermittently applied fat suppression pulses can achieve good fat suppression with only minimal reductions in scan time. Adiabatic RF pulses increase uniformity in the presence of B1+ variations that are especially common at 3T. Manual volume shimming over just the breasts can improve uniformity of fat suppression; however, unavoidable anatomy-induced variations in B0 field homogeneity, especially near the nipple, axilla, chest wall, and inferior breast as well as physiologic variations in these regions due to respiration, can lead to focal fat suppression failures despite optimal shimming.
Another approach to water-specific imaging is Dixon imaging (also known as two-point Dixon, three-point Dixon, IDEAL, or Flex). Dixon imaging uses the differential evolution of water and fat spin phase on non-fat-suppressed images obtained with different echo times to generate water- and fat-specific images.42,43,44 In general Dixon methods are immune to B0 field variations but can take longer due to the need for multiple acquisitions and can have reduced spatial resolution because the timing and duration of readout are constrained by the need to
obtain source images with the proper phase evolution, especially at 3T.
obtain source images with the proper phase evolution, especially at 3T.
Geek Box 1: ACR Practice Guidelines for the Performance of Contrast-Enhanced MRI of the Breast (2008)
|
Geek Box 2: Common Artifacts on DCE Breast MRI and How to Avoid Them
|
Overall, intermittently applied adiabatic spectrally selective inversion recovery fat suppression is the most efficient method that yields robust, rapid, high-quality images regardless of field strength from 1T to 3T.
Protocol
Scan parameters, especially the flip or tip angle, should be optimized depending on field strength and repetition time to provide strong T1 weighting for contrast enhancement. Most experts recommend setting the frequency readout direction in the anterior-posterior direction to minimize the impact of phase-direction artifacts from cardiac and respiratory motion on the breast. Standard recommendations by the ACR are that in-plane spatial resolution should be 1 mm or less and slice thickness should be 3 mm or less (see Geek Box 1). Increasing the receiver bandwidth can speed scanning, enabling higher resolution or faster dynamic scanning at the cost of decreased SNR and SNR efficiency and thus should be optimized after parallel imaging has been optimized.
According to ACR guidelines, dynamic images should be obtained at intervals separated by 3 minutes or less. Contrast
material should be administered as an intravenous bolus dose of 0.1 mmol/kg bodyweight, followed by a flush of at least 10 mL of saline, to ensure the entire bolus rapidly reaches the systemic circulation (Fig. 63.12) because a poor bolus can result in poor image quality and even false-negative DCE curves (Fig. 63.13). Although the ACR does not specifically recommend a rate for contrast injection, many studies achieve satisfactory results with 2 mL/s. All standard low-molecular weight gadolinium-based contrast materials (gadoteridol, gadopentetate dimeglumine, gadobutrol, etc.) have been used by the vast majority of studies with very high-quality results, without clear differences in performance, despite the fact that these agents have not been specifically labeled for use for breast MRI. There are reports of successful use of gadobenate with the same accuracy as gadobutrol in one study,45 and another study suggests modestly higher diagnostic accuracy compared with gadopentetate dimeglumine.46 Newer intravascular agents, liver-specific agents, and iron-based agents have not been widely investigated for breast MRI and are not recommended for routine use (see Geek Box 2). More detailed information on contrast agents and relaxivity can be found in Chapters 6 through 8.
material should be administered as an intravenous bolus dose of 0.1 mmol/kg bodyweight, followed by a flush of at least 10 mL of saline, to ensure the entire bolus rapidly reaches the systemic circulation (Fig. 63.12) because a poor bolus can result in poor image quality and even false-negative DCE curves (Fig. 63.13). Although the ACR does not specifically recommend a rate for contrast injection, many studies achieve satisfactory results with 2 mL/s. All standard low-molecular weight gadolinium-based contrast materials (gadoteridol, gadopentetate dimeglumine, gadobutrol, etc.) have been used by the vast majority of studies with very high-quality results, without clear differences in performance, despite the fact that these agents have not been specifically labeled for use for breast MRI. There are reports of successful use of gadobenate with the same accuracy as gadobutrol in one study,45 and another study suggests modestly higher diagnostic accuracy compared with gadopentetate dimeglumine.46 Newer intravascular agents, liver-specific agents, and iron-based agents have not been widely investigated for breast MRI and are not recommended for routine use (see Geek Box 2). More detailed information on contrast agents and relaxivity can be found in Chapters 6 through 8.
 FIGURE 63.12. Vascular enhancement after IV injection of gadolinium contrast agent. Checking the time-signal intensity curve from region of interest in the descending aorta (A) is useful to check that contrast was delivered adequately. A rapid bolus (2 mL/s) followed by a saline flush of 20 mL leads to a quick initial peak on enhancement, followed by rapid washout of contrast material as the gadolinium diffuses into the extracellular space of the body and is excreted by the kidneys. In this case, performed at 3T with gadobutrol, which has high relaxivity; the contrast was injected at time T = 90 s and reached the aorta very rapidly within 15 seconds, causing very strong, nearly 10-fold enhancement (B). |
 FIGURE 63.13. Example of poor intravenous contrast bolus injection. This patient, with a palpable suspicious mass, had minimal enhancement (A) with a benign Kuhl type Ia curve. Failure of proper intravenous contrast injection was suspected. The examination was repeated and the abnormal mass (B), with a suspicious Kuhl type III curve (C), was clearly seen. Common causes for poor bolus delivery include leakage at the connector, kinking of the intravenous catheter, and inadequate saline flush. |
Emerging Acquisition Strategies
More rapid imaging is necessary to fully capture the rapid dynamic changes in signal intensity that follow
rapid bolus administration; scanning every 30 seconds or less may be necessary for full pharmacokinetic characterization. Scanning at least every 45 seconds has been reported as optimal for differentiation of benign and malignant lesions based on kinetic analyses.47 This can be achieved with protocols that interleave rapid scanning at lower resolution with less frequent high-resolution scans. Advanced pulse sequences are being investigated that provide even greater flexibility in the tradeoff between spatial and temporal resolution. Novel k-space trajectories, including spiral imaging48,49 and undersampled projection-reconstruction sampling,50,51 can accelerate scanning. Similarly, undersampled and optimized ky and kz sampling strategies for three-dimensional gradient-echo sampling, such as TWIST (time-resolved angiography with stochastic trajectories)52,53 can substantially speed up scanning. These protocols can even enable reconstruction of images at different temporal resolutions, from the same dataset, albeit with corresponding compromises in spatial resolution. Compressed sensing is being investigated as a possible method of further speeding up scanning with less SNR penalty.54,55
rapid bolus administration; scanning every 30 seconds or less may be necessary for full pharmacokinetic characterization. Scanning at least every 45 seconds has been reported as optimal for differentiation of benign and malignant lesions based on kinetic analyses.47 This can be achieved with protocols that interleave rapid scanning at lower resolution with less frequent high-resolution scans. Advanced pulse sequences are being investigated that provide even greater flexibility in the tradeoff between spatial and temporal resolution. Novel k-space trajectories, including spiral imaging48,49 and undersampled projection-reconstruction sampling,50,51 can accelerate scanning. Similarly, undersampled and optimized ky and kz sampling strategies for three-dimensional gradient-echo sampling, such as TWIST (time-resolved angiography with stochastic trajectories)52,53 can substantially speed up scanning. These protocols can even enable reconstruction of images at different temporal resolutions, from the same dataset, albeit with corresponding compromises in spatial resolution. Compressed sensing is being investigated as a possible method of further speeding up scanning with less SNR penalty.54,55
Breast Dynamic Contrast-Enhanced Magnetic Resonance Imaging Analysis
Subtraction
Subtraction of precontrast images from early postcontrast images yields images of early contrast enhancement. This technique enables specific visualization of rapidly enhancing tumors, while eliminating signal from intrinsically bright nonenhancing structures, such as dilated ducts containing met-hemoglobin. Subtraction can be performed on fat-suppressed or non-fat-suppressed images. In theory, fat-suppression may reduce severity of some motion artifacts at fat-water interfaces. Automated registration software is commercially available on some systems. Nonrigid motion correction removes more artifacts (Fig. 63.14), but care must be taken to ensure that motion correction algorithms do not alter the shape, size, or kinetics of enhancing structures.56,57 Mutual-information–based methods have been proposed as more reliable than signal-intensity–based methods. Some software packages allow spatial smoothing of adjacent voxels, reducing noise and artifacts in color mapping, but at the risk of obscuring some intrinsic spatial heterogeneity and features within tumors. The challenge of elastically registering individual dynamic timeframes is to identify reproducible and traceable points or features (over dynamic time points) of interest. This is still an area of ongoing research.
Region of Interest Analysis
Analysis of the full time course of enhancement in abnormal breast lesions is most easily performed with region-of-interest analysis. The user draws a region of interest, circumscribing an enhancing mass. The integrated signal within the region of interest is plotted against time, over the entire course of enhancement. The shape of the time–signal intensity curve is analyzed subjectively, focusing on the initial enhancement phase and the washout phase. In the ACR lexicon contrast, washin is characterized as rapid, medium, or slow; washout is characterized as persistent, plateau, or washout. Curve type can also be classified visually according to a three-category system58 or
five-category system59 (Fig. 63.15). Overall, rapid initial enhancement followed by early washout of contrast material is most suspicious for malignancy. Some experts advocate selecting only the most rapidly enhancing foci within an abnormality, so-called hot spot analysis, as larger lesions tend to have heterogenous enhancement that is overly simplified by integrating over a single, large region of interest. In the author’s experience, hot spot analysis increases sensitivity, but costs specificity, and does not change the overall diagnostic accuracy of MRI with receiver operating characteristic analysis.
five-category system59 (Fig. 63.15). Overall, rapid initial enhancement followed by early washout of contrast material is most suspicious for malignancy. Some experts advocate selecting only the most rapidly enhancing foci within an abnormality, so-called hot spot analysis, as larger lesions tend to have heterogenous enhancement that is overly simplified by integrating over a single, large region of interest. In the author’s experience, hot spot analysis increases sensitivity, but costs specificity, and does not change the overall diagnostic accuracy of MRI with receiver operating characteristic analysis.
 FIGURE 63.14. Benefit of nonrigid motion correction. This patient, with an enhancing invasive ductal carcinoma (A), has significant motion that resulted in erroneous high (red arrow) and low signal (blue arrow) artifacts on subtraction images (B), as well as erroneous colorization (C), and erroneous dynamic contrast-enhanced curves (D). With motion correction, subtraction images show reduced artifact (E), more accurate colorization (F), and the proper time–signal intensity curve of rapid washin followed by plateau (D). |
Color Mapping
The time course of contrast enhancement can also be analyzed on a voxel-by-voxel basis. Standard commercially available breast MRI analysis systems typically perform this in two steps. First, the percentage of enhancement at an operator-defined early time point after contrast administration (typically 1 minute, also known as the peak enhancement) is calculated. Voxels enhancing more than a standard threshold (typically 100%) are replaced by colors. Choice of threshold is usually determined based on individual site experience and protocols. This is because the
percentage of enhancement depends on the degree of T1 weighting in images, which in turn depends on the sequence repetition time, field strength, and tip angle. There is no consensus recommendation by the ACR on a color scheme. In commercial breast MR analysis software from most vendors, the color is determined by comparing the peak enhancement with the last time point (also called the late enhancement). Voxels with signal that continues to increase by at least 10% are colored blue, indicating progressive late enhancement. Voxels with signal that decreases by 10% or more are colored red, indicating washout. Remaining voxels are colored green or yellow, indicating plateau enhancement (Figs. 63.14 and 63.16). Software from different vendors perform similarly.60
percentage of enhancement depends on the degree of T1 weighting in images, which in turn depends on the sequence repetition time, field strength, and tip angle. There is no consensus recommendation by the ACR on a color scheme. In commercial breast MR analysis software from most vendors, the color is determined by comparing the peak enhancement with the last time point (also called the late enhancement). Voxels with signal that continues to increase by at least 10% are colored blue, indicating progressive late enhancement. Voxels with signal that decreases by 10% or more are colored red, indicating washout. Remaining voxels are colored green or yellow, indicating plateau enhancement (Figs. 63.14 and 63.16). Software from different vendors perform similarly.60
 FIGURE 63.15. Schemes for visual classification time–signal intensity curves from dynamic contrast-enhanced breast magnetic resonance imaging. Gradual sustained enhancement is categorized as type Ia by Kuhl, type II by Daniel, and slow-persistent by the American College of Radiology (ACR) lexicon. More rapid initial enhancement that abruptly changes to gradual progressive late enhancement is categorized as type Ib by Kuhl, type III by Daniel, and medium-persistent by the ACR lexicon. Rapid initial enhancement that abruptly changes to stable signal is categorized as type II by Kuhl, type IV by Daniel, and rapid-plateau by the ACR lexicon. Rapid initial enhancement that transitions to early decline in signal intensity (even if subtle) is classified as type III by Kuhl, type V by Daniel, and rapid-washout by the ACR lexicon.
Related posts:Stay updated, free articles. Join our Telegram channel
Full access? Get Clinical Tree
 Get Clinical Tree app for offline access

|