Gastrointestinal Imaging
Nyree Griffin
Lee Grant
Vicky Goh
In the past decade, advances in computed tomography (CT) and magnetic resonance imaging (MRI) technology have allowed three-dimensional acquisitions with a high sampling rate and greater volume coverage. Consequently, dynamic contrast-enhanced CT (DCE-CT) and DCE-MRI techniques have been increasingly applied in the evaluation of gastrointestinal disease. These techniques allow for the evaluation of perfusion and microcirculatory changes. As a noninvasive indirect method of assessing tumor angiogenesis, these techniques have been used predominantly to assess gastrointestinal tract malignancies. Studies have also investigated benign inflammatory conditions such as diverticulitis and Crohn disease.
This chapter will:
Describe the anatomy of the gastrointestinal tract relevant to DCE imaging;
Discuss the pathophysiology of both malignant (i.e., esophageal, gastric, and colorectal cancers) and benign (i.e., inflammatory bowel disease and colonic diverticulitis) gastrointestinal disease;
Review the image acquisition protocols and postprocessing approach used for DCE-CT and DCE-MRI evaluation of the gastrointestinal tract;
Review the present literature on the role of DCE imaging in the evaluation of gastrointestinal cancers (focusing on esophageal, gastric, and colorectal malignancies) and benign gastrointestinal pathologies (chiefly inflammatory bowel disease and diverticulitis).
Anatomy of the Gastrointestinal Tract
Esophagus
The esophagus is a muscular tube approximately 25-cm long connecting the pharynx to the stomach, beginning at the level of C5/6 and terminating at its entrance to the stomach at the gastroesophageal junction (Fig. 67.1). The esophageal wall is composed of four layers: (a) an external fibrous layer, (b) a muscular layer, (b) a submucosal layer, and (d) an inner mucous membrane. The esophagus has an inner circular and outer longitudinal muscle coat that is predominantly striated within the upper third, gradually converting to smooth muscle fibers toward the gastroesophageal junction. The mucosal lining of the esophagus is stratified squamous epithelium throughout its length, only changing to columnar epithelium at the gastroesophageal junction.
Blood Supply
The esophageal arterial supply is divided roughly into thirds (Fig. 67.2) with free anastomotic communication between each segment as follows:
The upper third: supplied by branches of the inferior thyroid artery.
The middle third: supplied by branches of the descending aorta.
The lower third: supplied by branches of the left gastric artery and the left inferior phrenic artery.
Stomach
The stomach is a muscular bag that is roughly J-shaped with a cranial “cardiac” and caudal “pyloric” orifice. Two curvatures, the lesser and greater curves, connect these orifices. The stomach itself is divided into the following three parts (Fig. 67.3):
Fundus: dome shaped and projects cranially and to the left of the gastroesophageal junction;
Body: extends from the cardiac orifice to the incisura angularis, a notch approximately two-thirds along the lesser curve;
Pyloric antrum: extending from the incisura angularis to the pyloric orifice. The lesser omentum connects the lesser curve of the stomach to the liver, and the greater omentum connects the greater curve to the transverse colon.
The muscular wall of the stomach contains three muscle layers. The longitudinal fibers are the closest to the stomach’s external surface and are concentrated around the curvatures of the stomach. The incomplete middle circular fibers are thickened at the pylorus to form the pyloric sphincter. The oblique fibers form the innermost coat. The innermost surface of the stomach comprises the single layer columnar epithelium, which dips down into the connective tissue lamina propria to form multiple small glands, secreting mucus, pepsin, hydrochloric acid, and intrinsic factor.
Blood Supply
The arterial supply to the stomach (Fig. 67.4) arises from the celiac axis, which, having originated from the
abdominal aorta, divides initially into the hepatic artery and splenic artery. The individual branches supplying the stomach from the celiac axis are as follows:
abdominal aorta, divides initially into the hepatic artery and splenic artery. The individual branches supplying the stomach from the celiac axis are as follows:
Left gastric artery: descending from the gastroesophageal junction along the lesser curve.
Right gastric artery: arising from the hepatic artery to ascend the lesser curve and anastomose with the left gastric artery.
Short gastric arteries: arising from the splenic artery to supply the fundus (traveling in the gastrosplenic ligament).
Left gastroepiploic artery: arising from the splenic artery and supplying the upper part of the greater curve.
Right gastroepiploic artery: arising from the gastroduodenal branch of the hepatic artery and supplying the lower half of the lesser curve.
Small Bowel (Jejunum and Ileum)
The small bowel can vary between 4 and 6 m in length. The jejunum begins at the duodenojejunal flexure and represents approximately two-fifths of the proximal small bowel with a gradual transition to ileum. The ileum terminates at its junction with the cecum at the ileocecal junction (Fig. 67.5). These bowel loops are freely mobile and are connected to the posterior abdominal wall by a fan-shaped peritoneal fold called the small bowel mesentery. The jejunum has numerous prominent folds that encircle the lumen called the plicae circulares. These are fewer in number and less prominent in the ileum.
 FIGURE 67.1. Diagram showing esophageal anatomy. |
Just deep to the mucosa is the muscularis mucosae, comprising the inner circular and outer longitudinal muscle fibers. Separated by the submucosa is the muscularis propria, again composed of inner circular and outer longitudinal muscle fibers. The bowel loops are then invested with a serosal layer. Columnar epithelium lines the whole small bowel, dipping downward to form glandular structures known as the crypts of Lieberkühn, but also thrown upward between the gland openings to form innumerable finger-like projections (villi). Villous cells are responsible for secreting mucus and absorbing nutrients.
 FIGURE 67.2. Esophageal arterial supply. |
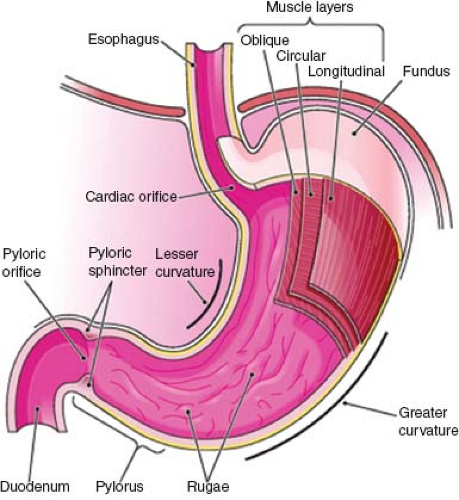 FIGURE 67.3. Diagram showing stomach anatomy. |
 FIGURE 67.4. Arterial supply to the stomach. |
 FIGURE 67.5. Diagram showing small bowel anatomy and relationship to the colon. |
Blood Supply
The blood supply to the small bowel is via branches of the superior mesenteric artery (Fig. 67.6A), which originates from the abdominal aorta just below the origin of the celiac axis. It sends between 15 and 18 branches to the small bowel, which originate from the left side of the artery and pass to the mesenteric border of the small bowel (with branches supplying the colon originating from the right side of the superior mesenteric artery). These arteries unite to form loops or arches (arcades) that freely anastomose with one another. Further arterial supply to the terminal ileum is via an ileal branch from the ileocolic artery, itself originating from the superior mesenteric artery.
Large Bowel
The colon consists of four parts: (a) the ascending colon, (b) the transverse colon, (c) the descending colon, and (d) the sigmoid colon (Fig. 67.7). The ascending and descending colon are retroperitoneal in location, while the transverse and sigmoid colon are connected to the posterior abdominal wall by a mesentery known as the transverse and sigmoid mesocolon. The colon has a sacculated appearance owing to the presence of incomplete folds (haustra). The outer longitudinal smooth muscle runs as three separate strips (taenia coli). The primary function of the colon is to store waste and reabsorb water.
The rectum commences anterior to the S3 vertebral body and ends at its communication with the anal canal.
The upper third is covered by peritoneum anteriorly and laterally, the middle third by peritoneum anteriorly only, with the lower third having no peritoneal covering. The taenia coli of the colon fuse at the rectosigmoid junction, with the rectum itself containing four longitudinal mucosal folds (columns of Morgagni). The rectum is surrounded by the perirectal fat containing blood vessels and lymph nodes, which itself is encased by the perirectal (mesorectal) fascia. The mesorectal fascia represents the circumferential resection margin, which is important for surgical planning; tumor within less than 1 mm of the circumferential resection margin is associated with a poorer prognosis. This mesorectal fat is less prominent anteriorly and caudally to the rectum.
The upper third is covered by peritoneum anteriorly and laterally, the middle third by peritoneum anteriorly only, with the lower third having no peritoneal covering. The taenia coli of the colon fuse at the rectosigmoid junction, with the rectum itself containing four longitudinal mucosal folds (columns of Morgagni). The rectum is surrounded by the perirectal fat containing blood vessels and lymph nodes, which itself is encased by the perirectal (mesorectal) fascia. The mesorectal fascia represents the circumferential resection margin, which is important for surgical planning; tumor within less than 1 mm of the circumferential resection margin is associated with a poorer prognosis. This mesorectal fat is less prominent anteriorly and caudally to the rectum.
 FIGURE 67.6. Blood supply to the small and large bowel. (A) Blood supply to small bowel. (B) Blood supply to the colon. |
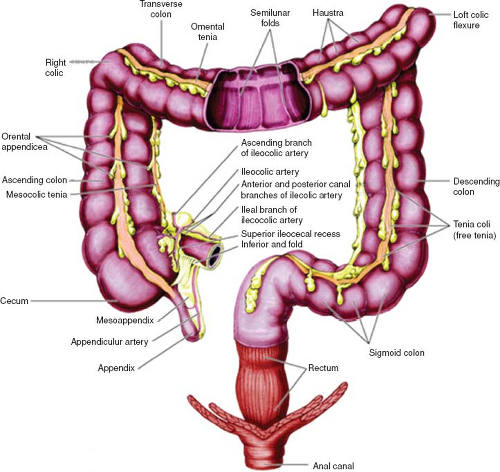 FIGURE 67.7. Diagram showing large bowel anatomy. |
Blood Supply
The arterial supply to the colon is as follows (Fig. 67.6B):
Ileocolic and right colic artery: these are both branches of the superior mesenteric artery; both supply the ascending colon.
Middle colic artery: this is a branch of the superior mesenteric artery and it supplies the proximal two-thirds of the transverse colon.
Left colic artery: this is a branch of the inferior mesenteric artery and it supplies the distal third of the transverse colon and descending colon.
Sigmoid arteries: these are branches of the inferior mesenteric artery and supply the sigmoid colon.
The arterial supply to the rectum is as follows:
Superior rectal artery: a continuation of the inferior mesenteric artery and supplying the proximal rectum.
Middle rectal arteries: arising from the inferior vesical arteries and supplying the middle and inferior rectum.
Inferior rectal arteries: arising from the internal pudendal arteries and supplying the anorectal junction and anal canal.
Pathophysiology and Clinical Management of Malignant Gastrointestinal Tract Disease
Esophageal Cancer
At least 90% of esophageal tumors are either squamous cell carcinomas or adenocarcinomas. Esophageal cancer is the eighth most common cancer worldwide and sixth most common cause of cancer mortality.1 The highest incidence rates (between 50 and 100 cases per 100,000 population per year) are in northern China, northeastern Iran, and South Africa. It is rare under the age of 30 years, with mean age at diagnosis of 68 years in the United States.2 In the Western world, the incidence of adenocarcinoma is increasing and is the most common histopathologic type, although in developing countries, nearly all cancers are squamous in origin. Squamous cell tumors are evenly distributed between the middle and distal thirds of the esophagus, usually in association with alcohol and tobacco consumption. They can appear as infiltrating, polypoid, ulcerative, or superficial spreading lesions. There is a marked tendency to invade adjacent mediastinal structures, because there is no protective serosal layer. Less than 30% of tumors are adenocarcinomas, with approximately 80% of these found toward the lower third of the esophagus. These are thought to usually arise de novo from short segment distal Barrett esophagus. For advanced esophageal tumors, the use of surgery alone or resection followed by radiotherapy (with or without chemotherapy) has failed to improve prognosis, which remains poor. For these patients, chemoradiotherapy followed by surgery or chemoradiotherapy alone has been employed in an effort to reduce both local recurrence and distant spread and to improve survival. The most common multimodality therapy consists of a combination of 5-fluorouracil and cisplatin.
Gastric Cancer
Malignant gastric tumors are adenocarcinomas in 95% of cases (the remaining being mostly lymphoma, gastrointestinal stromal tumors, and carcinoid). Gastric cancer is the fourth most common cancer worldwide and the second leading cause of cancer-related death.3,4 The highest incidence rates are in Japan and Korea. Because of mass screening programs in Japan, the mortality rates for gastric cancer in men have decreased by more than 50% since 1970, with a 5-year survival rate of 95% for early tumors. In contrast, the 5-year survival rates in the United States and Europe are less than 20%, owing to later presentation. There are two types of tumor: a differentiated intestinal type, usually affecting the distal stomach and demonstrating tubular or papillary glands (60%), and an undifferentiated diffuse type, distributed throughout the stomach with a worse prognosis (40%). The intestinal type is associated with older males, while the diffuse type has no gender predilection and occurs in a younger population. Overall, the location of gastric tumors is approximately evenly distributed between the antrum, body, and fundus or cardia. The incidence of the cardiac type has risen by five- to sixfold in the past 30 years in developed countries. Most gastric carcinomas are polypoid or ulcerated lesions, or less commonly scirrhous lesions, that diffusely infiltrate along the gastric wall. A demonstrable link between Helicobacter pylori colonization and distal tumors has been shown, with other risk factors including diet, smoking, atrophic gastritis, and pernicious anemia.
For early gastric cancer (stages 0, I, and II), subtotal or total gastrectomy is performed (depending on the site and extent of involvement) along with regional lymphadenectomy. For stage III gastric cancer, radical surgery is only carried out if there is no extensive nodal involvement at the time of surgical exploration. Both postoperative chemoradiation (for stages I through III disease) and neoadjuvant therapy (for stages II and III disease) can be considered because there is a proven survival benefit.5 For patients with stage IV cancer, palliative chemotherapy, radiotherapy, or resection might be appropriate.
Colorectal Cancer
Colorectal cancer is the third most common cancer worldwide in men and second most common in women, with the highest incidence in Australia, New Zealand, Europe, and North America. Risk factors include a diet rich in red and processed meat but low in fiber, obesity, smoking, alcohol consumption, inflammatory bowel disease, and polyposis syndromes. Greater than 90% of cases are adenocarcinomas. It is thought that at least 70% of tumors follow transformation of a benign adenoma into a carcinoma via a multistep accumulation of genetic faults (the adenoma to carcinoma sequence), with the remaining 30% of tumors arising de novo from normal mucosa. The risk of malignant transformation of an adenoma is related to its size, with adenomas greater than 1 cm in size posing a greater risk. Five-year survival rates for colorectal cancer have doubled between the early 1970s and
mid-2000s,6,7 related to improvements in surgical and radiotherapy techniques and the introduction of novel chemotherapeutic (including targeted) agents. Surgical resection is carried out in the majority of patients, although up to a third of colorectal cancer cases will relapse, usually within 3 years.8,9,10 In order to reduce recurrence, total mesorectal excision is now routinely used for middle and lower third rectal cancers. Prognosis is related to tumor stage at presentation, with 80% 5-year survival rate in patients with Dukes stage A cancers, but 35% for Dukes stage C tumors.
mid-2000s,6,7 related to improvements in surgical and radiotherapy techniques and the introduction of novel chemotherapeutic (including targeted) agents. Surgical resection is carried out in the majority of patients, although up to a third of colorectal cancer cases will relapse, usually within 3 years.8,9,10 In order to reduce recurrence, total mesorectal excision is now routinely used for middle and lower third rectal cancers. Prognosis is related to tumor stage at presentation, with 80% 5-year survival rate in patients with Dukes stage A cancers, but 35% for Dukes stage C tumors.
Postoperative chemotherapy is given to patients with Dukes stage C colon cancer and might be appropriate for patients with Dukes stage B cancer, although this remains controversial. This usually consists of 5-fluorouracil and folinic acid (with or without irinotecan and oxaliplatin). To date, chemotherapy has made little impact on the survival of patients with advanced cancer, with only a 5% to 10% improvement.11,12 In the United Kingdom, in locally advanced rectal cancer (stage T3b or greater, where the circumferential resection margin is at risk), neoadjuvant chemoradiotherapy is given prior to surgery to increase the rate of R0 resections and to reduce the risk of local recurrence. Patients with advanced colorectal cancer are treated with palliative chemotherapy or radiotherapy. Newer targeted therapies (e.g., anti–vascular endothelial growth factor [VEGF] agents), have been shown to improve survival in the metastatic setting.
Pathophysiology and Clinical Management of Benign Gastrointestinal Tract Disease
Crohn Disease
Crohn disease is a chronic transmural granulomatous inflammatory disorder of the bowel of unknown pathogenesis. The most common site of disease is the terminal ileum, but any site within the gastrointestinal tract can be affected. Typically there are discontinuous “skip” lesions with asymmetrical bowel wall involvement. Other features include bowel wall thickening and ulceration, strictures and stenoses, fistulae formation and mesenteric hypervascularity, and fibrofatty proliferation. In addition to dietary measures, several drugs can be used to induce or maintain remission in active disease (e.g., steroids and immunomodulators). Antitumor necrosis factor alpha antibodies (e.g., infliximab, adalimumab) have become an established and highly effective therapy for moderate to severe Crohn disease. Surgical resection and diversion may be required in those patients who develop complications arising from penetrating disease or obstructive symptoms from fibrotic strictures.
Diverticulitis
Diverticulitis is the most common complication associated with the presence of diverticulosis, affecting 10% of patients that have diverticulosis. Diverticulosis is most common in the sigmoid colon. Diverticulitis follows the stagnation of fecal material within the diverticulum, with associated inflammatory erosion of the mucosal lining of the diverticulum and leading potentially to perforation and intramural or extramural abscess formation. Fistulae and sinus formation are additional possible sequelae. A high fiber diet may help relieve symptoms in simple diverticular disease. If diverticulitis arises, mild symptoms may response to antibiotics and liquid diet. If complications develop, such as abscess or fistula formation, then percutaneous drainage or surgical resection may be required.
Evaluation Strategies
With DCE imaging, both qualitative assessment of the contrast enhancement time curve (shape, peak enhancement, enhancement ratio, washin rate, and washout rate), and quantitative assessment via kinetic modeling of the temporal changes in tumor enhancement can be achieved. Different strategies are required depending on whether qualitative or quantitative assessment is required. Quantitative assessment requires higher temporal sampling than qualitative assessment. High temporal resolution imaging with kinetic modeling provides more physiologically related parameters (regional blood flow, blood volume, extraction fraction or permeability surface area product, transfer constant, rate constant, extravascular extracellular volume). Although quantitative imaging is more technically demanding, parameters are less susceptible to patient, machine, and acquisition factors, particularly where good quality control is achieved.
A comparison of DCE-CT and DCE-MRI techniques applied to the gastrointestinal tract are summarized in Table 67.1. There are several advantages of CT over MRI: (a) CT is more widely available, relatively low cost, and quick to perform (5 minutes vs. 45 minutes for a comprehensive protocol); (b) At present, a greater coverage can be achieved with CT than MRI for high temporal sampling techniques; (c) The concentration of contrast in CT is proportional to the resultant increase in attenuation, unlike DCE-MRI where there might only be a linear relationship for low concentrations (<5 mm); (d) Acquisition and processing protocols can be standardized more easily with CT in the multicenter setting.
Clearly the main disadvantage of perfusion CT is the exposure to ionizing radiation. Typical radiation doses from a first pass volumetric perfusion CT study of the thorax, abdomen, or pelvis range from 13.7 mSv to 28.7 mSv for greater than 11-cm coverage and 1.5-second interscan delay.13 The dose can be minimized by using
low kilovoltage (80 or 100 kV) and milliampere values. Noise from lower-dose CT can also be reduced using techniques such as iterative reconstruction and noise reduction filters. An advantage of MRI is that it has better signal-to-noise characteristics and higher contrast to noise than CT and can be combined with other sequences such as diffusion-weighted sequences to provide a more comprehensive assessment of the tumor.
low kilovoltage (80 or 100 kV) and milliampere values. Noise from lower-dose CT can also be reduced using techniques such as iterative reconstruction and noise reduction filters. An advantage of MRI is that it has better signal-to-noise characteristics and higher contrast to noise than CT and can be combined with other sequences such as diffusion-weighted sequences to provide a more comprehensive assessment of the tumor.
TABLE 67.1 COMPARISON of DYNAMIC CONTRAST-ENHANCED COMPUTED TOMOGRAPHY AND MAGNETIC RESONANCE IMAGING TECHNIQUES | ||||||||||||||||||||||||||||||||||||
|---|---|---|---|---|---|---|---|---|---|---|---|---|---|---|---|---|---|---|---|---|---|---|---|---|---|---|---|---|---|---|---|---|---|---|---|---|
| ||||||||||||||||||||||||||||||||||||
Few gastrointestinal studies have directly compared DCE-MRI and DCE-CT. There has been one study in rectal cancer, which carried out both pretreatment DCE-CT and DCE-MRI.14 The transfer constant (Ktrans) values derived from DCE-CT were comparable to those of DCE-MRI, but no correlation was found for the extravascular-extracellular space (ve), and fractional plasma volume (vp) between CT and MRI. Thus these two techniques reflect similar vascular physiology but are not interchangeable.
Dynamic Contrast-Enhanced Computed Tomography
Technical Requirements
Multidetector CT systems that can achieve at least a 4-cm z-axis coverage with a temporal resolution of less than 2 seconds is essential for quantitative DCE-CT. This is particularly relevant for tumor evaluation to account for the heterogeneity of tumor angiogenesis. Currently, this may be achieved by using multidetector CT with a detector width of 4 cm or more, a shuttle (jog) mode, or a volumetric helical technique. With a 320-detector system, a 16-cm coverage can be achieved at a single anatomical level. With a shuttle or jog mode, where the scanner couch is moved between two contiguous positions, 8-cm coverage can be achieved. With a helical technique, coverage ranging from 11 to 28 cm can be achieved, depending on the temporal sampling (1.5 seconds or longer between acquisitions).
Patient and Lesion Selection
As per any contrast-enhanced study, patients are excluded from DCE-CT if they have had a previous reaction to iodinated CT contrast, if there is renal impairment, or if intravenous access with an 18-gauge venous cannula is not possible. Patients may also be excluded if their tumor cannot be identified on the initial planning acquisition. Lesions should typically be greater than 2 cm, particularly if no breath-holding or motion correction is applied during postprocessing.
Patient Preparation
With DCE-CT of the upper gastrointestinal tract, distension with a negative oral contrast agent is recommended, when tolerated by the patient. In the evaluation of esophageal cancers, 200 to 400 mL of water is given immediately prior to the initial CT image acquisition. When gastric tumors are being evaluated, 600 to 800 mL of water 15 to 30 minutes prior to the initial CT scan can be given, followed by an additional 200 mL of water immediately before the study. Alternatively, 1 U dose of an effervescent agent can be administered orally immediately prior to the first CT scan. In the evaluation of colorectal cancers, some centers use a water enema (>2000 mL) administered via a 24-French rectal catheter to obtain homogenous, reproducible, and persistent colonic distension. If this is performed, patients are given bowel preparation the day prior to this, which consists of a cleansing enema, oral laxative, and low fiber diet.
TABLE 67.2 ACQUISITION PARAMETERS FOR DYNAMIC CONTRAST-ENHANCED COMPUTED TOMOGRAPHY AND MAGNETIC RESONANCE IMAGING | ||||||||||||||||||||||||||||||||||||||||||||||||||||||||||||||||||
|---|---|---|---|---|---|---|---|---|---|---|---|---|---|---|---|---|---|---|---|---|---|---|---|---|---|---|---|---|---|---|---|---|---|---|---|---|---|---|---|---|---|---|---|---|---|---|---|---|---|---|---|---|---|---|---|---|---|---|---|---|---|---|---|---|---|---|
| ||||||||||||||||||||||||||||||||||||||||||||||||||||||||||||||||||
TABLE 67.3 CONTRAST AGENT DOSES AND ADMINISTRATION RATES FOR DYNAMIC CONTRAST-ENHANCED COMPUTED TOMOGRAPHY | ||||||||||||
|---|---|---|---|---|---|---|---|---|---|---|---|---|
| ||||||||||||
When evaluating the small or large bowel, an antiperistaltic is recommended to diminish bowel wall movement. Abdominal wall movement can be reduced by placing a restraining band around the abdomen and imaging the patient in the prone position if possible. Either intermittent breath-holding or shallow breathing is advised to minimize breathing artifact, especially when imaging the chest or upper abdomen. Motion correction or image registration software should be used to compensate for respiratory motion.
Acquisition Protocol
Typical acquisition parameters for the abdomen and pelvis are shown in Table 67.2. Typical contrast agent doses and administration rates for DCE-CT are shown in Table 67.3. A higher volume of contrast agent and more rapid injection rate is used for DCE-CT compared with DCE-MRI to ensure a good contrast-to-noise ratio. This is advantageous for DCE-CT, unlike DCE-MRI, where such a procedure will enhance T2* and nonlinearity effects.
A typical acquisition protocol is shown in Figure 67.8. For the first phase, an acquisition time of 45 seconds is advised, with a maximum sampling interval of 2 seconds. For the interstitial phase, at least five additional time points are recommended for analysis of the passage of contrast material into the extravascular space depending on the analysis model used.
 FIGURE 67.8. Schema showing typical dynamic contrast-enhanced computed tomography acquisition protocols. |
Image Analysis
Related posts:
 Dose Considerations in CT Perfusion
 Confounding Effects in Arterial Spin Labeling
 Arterial Spin Labeling Acquisition Protocols
 Pediatric Stroke and Congenital Disease
 Clinical Applications of Dynamic Contrast-Enhanced Magnetic Resonance Imaging in Musculoskeletal Tumors
 Cerebral Perfusion Studies in Substance Abuse and Dependence
Stay updated, free articles. Join our Telegram channel

Full access? Get Clinical Tree


