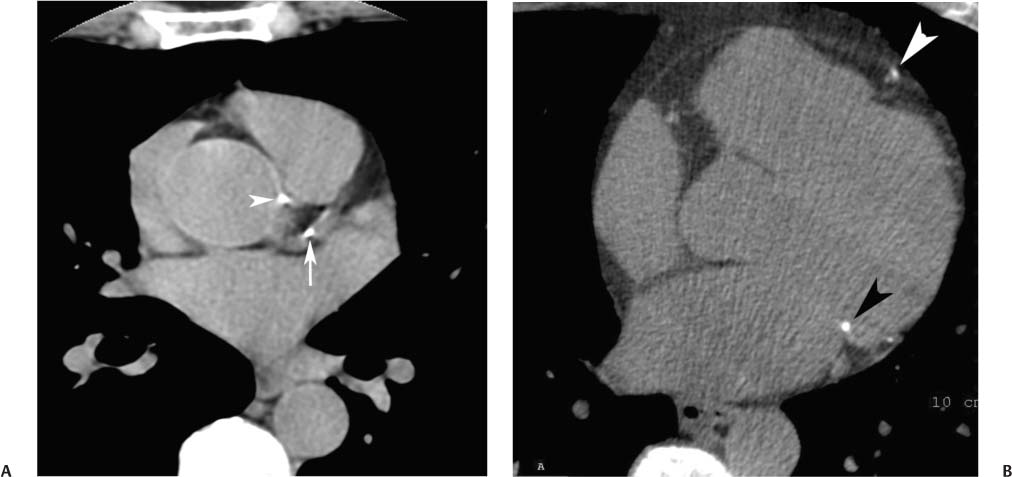
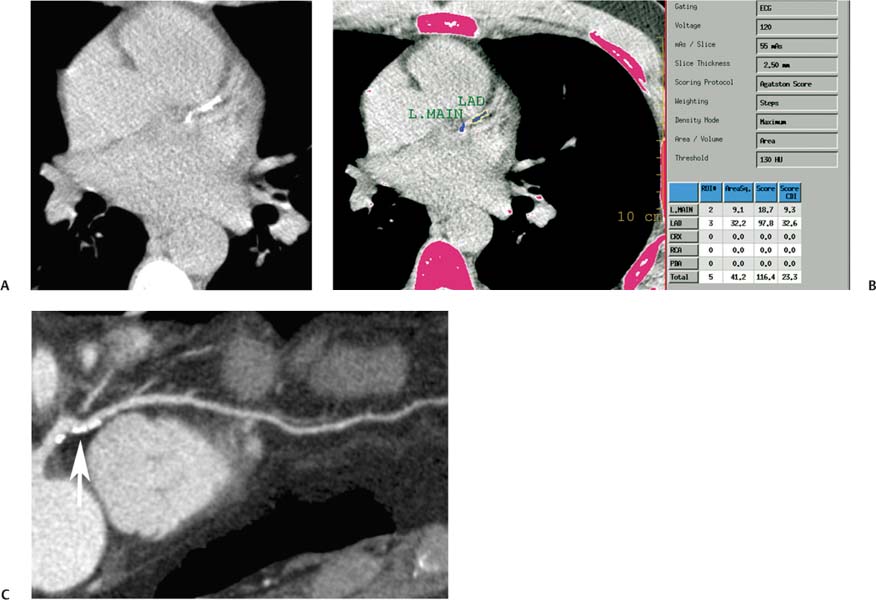
5 Based on 2009 estimates, the annual incidence of heart disease in the United States will include 785,000 new coronary attacks, 470,000 recurrent attacks, and 195,000 silent first attacks.1 The prevalence of coronary heart disease among persons over 20 years of age in the United States is estimated at 16,800,000, or 7.6% of the population. Coronary heart disease is the single largest cause of mortality among Americans and is implicated in 1 of every 5 deaths. Conventional risk factors fail to identify one third of deaths caused by coronary heart disease.2 Conventional screening tools for coronary artery disease include Framingham risk assessment, clinical examination, and stress testing. In 1948, the Framingham heart study was initiated under the auspices of the National Heart Institute (now known as the National Heart, Lung and Blood Institute, or NHLBI). This project was designed to identify risk factors for cardiovascular disease by following a cohort who had not yet developed overt symptoms. The initial study began in the town of Framingham, Massachusetts, with 5209 men and women. In 1971 the study enrolled a second-generation group consisting of 5124 children and spouses of the original group. A third generation is currently being recruited to investigate further the relationship of genetic factors to cardiovascular disease. The Framingham study identified major cardiovascular risk factors, including high blood pressure, high blood cholesterol, smoking, obesity, diabetes, and physical activity.3 A risk assessment formula has been extrapolated from the Framing-ham data to compute the 10-year risk of hard coronary heart events (myocardial infarction and coronary death) based on age, gender, total cholesterol, high-density lipoprotein (HDL), smoking status, systolic blood pressure, and use of medication to treat high blood pressure. A calculator for estimating this risk is available online under the auspicious of the National Cholesterol Education Program and NHLBI (http://hp2010.nhlbihin.net/atpiii/calculator.asp). It is important to note that that several important risk factors for coronary disease, including metabolic syndromes, obesity, and family history are not included in the Framingham risk calculation. Based on the results of the Framingham study data, evaluations of cardiovascular risk factors have become an important part of prevention and treatment strategies for cardiovascular disease. Patients are assigned a 10-year risk, and treatment goals are modified based on patient risk (see National Cholesterol Program Adult Education Treatment Plan guidelines).4 With respect to patient therapy, risk categories are divided into high risk (10-year risk >20%), moderate high risk (10-year risk 10–20%), moderate risk (10-year risk <10%), and low risk (patients with 0–1 cardiac risk factors). The distinction between the moderate- and low-risk categories is based on additional risk factors not included in the Framingham 10-year risk calculation. The risk category into which a patient is placed will impact recommendations for therapeutic lifestyle changes as well as target goals for lowering of low-density lipoprotein (LDL) levels. It is of interest that most coronary events occur in the territory of coronary arteries that do not demonstrate prior high-grade stenosis.5 Although atherosclerotic plaque is invariably present as a substrate for an acute coronary event, significant stenosis is not necessary. However, complications of atherosclerotic plaque, such as rupture or erosion with subsequent thrombus formation, are important events leading to acute coronary syndrome. Many different factors, including plaque composition, hemodynamics, endothelial function, and blood thrombogenicity may influence which plaques lead to hemodynamically significant events.6 Nonetheless, there is a strong relation between the extent of coronary plaque burden and the risk of a coronary event.7 Because atherosclerosis is the only disease process associated with calcification of the coronary arteries, the degree of coronary calcification as demonstrated by CT is predictive of the overall burden of atherosclerotic plaque.8 The role of coronary calcium scoring in assessing the risk for future coronary events has been a subject of considerable controversy.9 Updated guidelines for coronary calcium scoring were scheduled for publication by the American Heart Association (AHA) in 2004. However, the publication was canceled after an article in the Wall Street Journal on September 21, 2004, suggested that the guidelines would endorse calcium scoring for risk stratification. A subsequent statement from the AHA concluded that “EBCT has undergone a 20-year period of testing for reliability and validity and is now established as a useful technique in identifying individuals with or at risk for CHD…. The most promising use of these technologies is calcium scoring for risk assessment of the asymptomatic individual.”10 Interestingly, the AHA/American College of Cardiology (AHA/ACC) consensus statement published in 2007 provides a lukewarm endorsement of coronary calcium scoring, suggesting only that asymptomatic individuals with an intermediate Framingham risk score may be reasonable candidates for coronary calcium scoring as a potential means of modifying risk prediction and altering therapy.11 European guidelines on cardiovascular disease prevention in clinical practice more clearly state that “coronary calcium scanning is especially suited for patients at medium risk” and advocate the use of coronary calcium scores to qualify conventional risk analysis.12 More recently, a large observational outcomes study of more than 25,000 people demonstrated conclusively that coronary calcium provides independent and incremental predictive value to traditional cardiovascular risk factors for all cause mortality.13 Another large study demonstrated that these results hold true across racial and ethnic groups including blacks, Hispanics, and Chinese.14 An elevated coronary calcium burden may not indicate the direct presence of significant coronary stenosis, but it is associated with a higher risk for a coronary events. Calcium scoring is based on the identification of high-density material within the coronary circulation on a noncontrast CT scan. Both electron-beam CT (EBCT) and multislice–multidetector CT (MDCT) have been used for evaluation of coronary calcium. The largest databases are available for EBCT. However, a strong linear association is present between calcium score as provided by EBCT and MDCT, with an r-value in the range of 0.96 to 0.99.15 Current literature suggests that MDCT is comparable to EBCT for coronary calcium screening.16,17 The effective radiation dose from a calcium scoring examination with EBCT is in the range of 0.7 to 1.0 mSv for men and 0.9 to 1.3 mSv for women. The effective radiation dose from a calcium scoring examination with MDCT is in the range of 1.0 to 1.5 mSv for men and 1.3 to 1.8 mSv for women.18,19 This compares favorably to the expected dose of MDCT cardiac angiography. The effective radiation dose from a nuclear stress test is in the same range as that of a diagnostic cardiac CT angiogram performed with retrospective electrocardiographic (ECG) gating (10–12 mSv). Calcium scoring is a simple test that should take no more than 5 minutes. ECG leads are placed on the patient. A CT scout image is obtained to determine the location of the heart. A prospective ECG-gated scan with 3-mm slice thickness is then obtained from the level of the carina through the bottom of the heart. To obtain an accurate calcium score, calcium within the coronary arteries must be distinguished from calcification involving other parts of the heart, especially the annulus of the aortic or mitral valve (Fig. 5.1). Aortic annular calcification may be present adjacent to the left anterior descending artery, whereas mitral annular calcification may be present adjacent to the circumflex artery. Once the location of coronary calcium is identified on a CT examination, an automated program is used to compute a calcium score. The Agatston method has been traditionally used to score the amount of coronary calcium with CT.20 For each focus of calcified coronary plaque, plaque area and maximum attenuation are measured on each CT slice. An attenuation cofactor is assigned to each plaque based on CT attenuation measured in Hounsfield units (HU). The cofactor is assigned as 1 for 131 to 200 HU, 2 for 201 to 300 HU, 3 for 301 to 400 HU, and 4 for greater than 400 HU. The area of each plaque is multiplied by the appropriate attenuation cofactor to achieve a calcium score. Although an Agatston score may be computed for each coronary vessel, the scores of all the individual plaques in all the vessels are generally summed to obtain a single total Agatston calcium score for risk analysis. Fig. 5.1 Coronary calcification versus annular calcification. (A) Noncontrast axial image at the level of the left main coronary artery demonstrates focal calcification within the left coronary artery (arrow), as well as focal calcification of the aortic root (arrowhead). (B) Axial image at the level of the mitral valve demonstrates focal calcification of the left anterior descending artery (white arrowhead), as well as focal calcification of the mitral annulus (black arrowhead). The mitral annulus is deep to the circumflex artery, which is found along the left atrioventricular groove. The Agatston method does have its shortcomings. Modern CT units are capable of submillimeter resolution, but the Agatston score uses attenuation cofactors determined at a 3-mm slice thickness. Depending on which adjacent tissues are included in this slice thickness, cofactors in the Agatston method may be altered by partial volume averaging. A volumetric method has been proposed that is less dependent on volume averaging and slice thickness.21 Mass scores have also been defined to combine the volume and density of coronary calcium in a manner that is relatively more independent of slice thickness and spatial resolution. Although volumetric scores of coronary calcium may be more representative of the total plaque burden, volume scores may differ from the Agatston score.22 More recently, calcium scoring methods have been proposed that combine both the spatial distribution and the amount of calcified plaque to improve risk assessment.23 Although these newer methods may provide improved risk stratification, most clinicians continue to use the Agatston method for calcium scoring because of the large amount of published data relating the risk of coronary events to the Agatston score. Coronary calcium scores are generally divided into normal (no calcium), mildly elevated (1–100), moderately elevated (101–400), or severely elevated (>400). Mildly elevated coronary calcium scores are often present without significant stenosis (Figs. 5.2 and 5.3). Calcified plaque is frequently associated with positive remodeling, resulting in no significant narrowing of the internal vessel lumen. Positive remodeling is discussed more extensively with atherosclerotic disease in Chapter 6. As the level of coronary calcium increases, the risk of significant stenosis is higher, but there is not a one-to-one correlation. Moderately elevated calcium scores may be associated with normal coronary vessels on angiography (Fig. 5.4). Patients with severely elevated calcium scores are more likely to have a significant stenosis; these patients are also the most challenging to study with CT coronary angiography because of artifact from calcification (Fig. 5.5). Although very high calcium scores are often associated with coronary stenosis, calcium scoring is generally advocated to assess patient risk for a cardiac event, not to detect the presence of coronary stenosis. Fig. 5.2 Mild calcification of the left coronary artery without significant stenosis. (A)
Calcium Scoring
 Cardiac Risk Stratification
Coronary Calcium and Cardiac Risk
CT Technique for Calcium Scoring
Calcium Scores, Percentiles, and Cardiac Risk
![]()
Stay updated, free articles. Join our Telegram channel

Full access? Get Clinical Tree


