60 Calculating T1 and T2 Relaxation Times (Calculated Images)
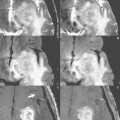
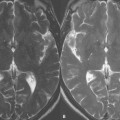
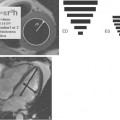
The classification of lesions based on their hypointense or hyperintense appearance is hampered by the influence of field strength and pulse sequence parameters. An alternative approach (but little used today clinically) is to calculate tissue relaxation times, thus providing a quantitative means of lesion characterization. Inversion recovery (IR) imaging techniques are considered to be the most accurate for calculation of T1 relaxation times. A simple means of estimating T1 can be achieved by acquiring two images with different inversion times, in this example, 350 and 550 msec (Fig. 60.1
Stay updated, free articles. Join our Telegram channel

Full access? Get Clinical Tree


