Cardiac magnetic resonance imaging (MRI) sequences are numerous, and possible imaging planes are infinite. Each sequence is designed to provide specific information about function, anatomy, or tissue characteristics. Each sequence also has its set of parameters that can be modified to improve image quality. Although any imaging plane can be obtained with MRI, standard orientations that follow echocardiographic planes are suitable for most examinations. The cardiac imaging specialist is therefore faced with the following challenges:
How do cardiac MRI sequences produce images, and what key parameters can be adjusted to optimize image quality?
How should imaging planes be prescribed?
How can sequences and imaging planes be combined to form comprehensive and efficient imaging protocols designed to answer clinical questions?
This chapter reviews the commonly used MRI techniques, describes the geometry of standard imaging planes, and outlines protocols tailored to common indications for cardiac MRI.
Techniques
Gating
Gating refers to the timing of events of the imaging sequence according to the cardiac or respiratory cycle. Synchronization of image acquisition to the electrocardiogram (ECG) is required because of cardiac motion. The quality of the signal depends on ECG electrode placement. Rearrangement of the electrodes can improve the signal. ECG gating is either prospective or retrospective. In prospective gating (or triggering), ECG events, often the R wave, trigger the events of the imaging sequence such as radiofrequency pulses or the start of a delay to image acquisition. In retrospective gating, data are acquired throughout the cardiac cycle, and images are reconstructed subsequently, based on the relationship of acquired data with ECG events. Retrospective gating is commonly used for cine imaging. The ECG signal may be distorted by the B 0 (static) magnetic field, by the B 1 magnetic field (the radiofrequency pulse), or by the magnetohydrodynamic effect. The magnetohydrodynamic effect refers to amplification of the T wave by the blood flow through the vessels. The use of vectorcardiography helps distinguish true ECG waves from artifacts. Sequences using k-space data sharing and partial k-space acquisition, as well as sequences acquired within one R-R interval (single shot sequences), are less sensitive to the quality of ECG gating. Three techniques are used to compensate for respiratory motion. Breath holding is usually used when the acquisition fits within approximately 15 seconds, because most patients cannot suspend breathing for a longer period. If the patient is breathing freely, respiratory motion averaging can be used. Navigator-based techniques allow tracking of diaphragmatic motion and therefore data acquisition at the same phase of each respiratory cycle with simultaneous synchronization to the ECG. Real-time images, like the ones produced by echocardiography, can be obtained with MRI. In that case, image quality does not depend on gating, but spatial and temporal resolution are low.
Types of Sequences and Overview of T1 and T2 Weighting
Spoiled gradient echo and spin echo sequences are most commonly used to produce MRI images. Spoiled gradient echoes are generated by the controlled application of magnetic field gradients after a single radiofrequency pulse. Spoiling refers to destruction of residual transverse magnetization before application of the next radiofrequency pulse. Spin echoes are produced by a 90-degree radiofrequency pulse followed by single (conventional spin echo) or multiple (turbo spin echo) 180-degree refocusing pulses. The time between each 90-degree radiofrequency pulse is called the repetition time (TR), and the time delay between the radiofrequency pulse and the generation of an echo is called the echo time (TE). When the application of a radiofrequency pulse stops, the spins of the protons begin to return to their original state. This process has two components: the recovery of longitudinal magnetization and the loss of transverse magnetization. The recovery of longitudinal magnetization, or T1 relaxation, is an exponential process with a time constant, T1. Loss of transverse magnetization occurs because protons lose phase coherence. It is also an exponential process with a time constant, T2 ∗ . Loss of phase coherence occurs because of interaction with neighboring protons (spin-spin interaction, T2 relaxation) and because of inhomogeneities in the B 0 magnetic field. MRI uses differences in T1 and T2 relaxation to produce contrast between different soft tissues.
For spin echoes, TR and TE determine the weighting of the image. T1 weighting is obtained with a short TR and a short TE. T1-weighted spin echo images are used for anatomic imaging. Fat has a bright (high) signal, and fluid has a low signal intensity. In practice, a short TR corresponds to one R-R interval. T2 weighting is obtained with a long TR and a long TE. The 180-degree refocusing pulse ensures that the effects of field inhomogeneities are canceled and that loss of phase coherence depends only on spin-spin interactions. T2-weighted spin echo images are used for edema imaging because fluid has a high T2 signal. In practice, a long TR corresponds to two or three R-R intervals. For spoiled gradient echoes, TR, TE, and the flip angle determine the T1 or T2 ∗ weighting of the images. T1-weighted spoiled gradient echoes are obtained with a short TR, a short TE, and a flip angle of approximately 30 degrees. T2 ∗ -weighted spoiled gradient echoes are obtained with a long TR and TE. These images are sensitive to magnetic susceptibility effects and are therefore well suited to detect tissue iron.
Black-Blood Sequences
Morphologic Imaging
T1-weighted black-blood turbo spin echo sequences with a double inversion recovery preparation are often used for morphologic imaging. The double inversion preparation applies a nonselective inversion pulse to the whole volume to be imaged, followed by a second slice selective inversion pulse that restores signal in the slice of interest. The 90-degree pulse of the spin echo sequence is applied after a time delay, to allow the recovering signal of the blood to cross the zero line. This delay is called the inversion time (TI), and it also allows blood that has experienced only the first inversion pulse to fill the slice. In practice, the double inversion preparation is triggered by the R wave, and the spin echoes are produced 400 to 600 milliseconds later, which correspond to diastole. Turbo spin echo sequences acquire multiple lines of k-space after a single 90-degree pulse by repeating the 180-degree refocusing numerous times, called the echo train length. An echo train length of 15 to 20 echoes usually allows the acquisition of one or two slices in a single breath hold.
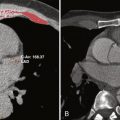
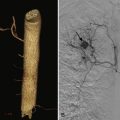
A common pitfall of double inversion recovery turbo spin echo imaging is loss of signal of the myocardium as a result of cardiac motion. Structures of interest may move out of the slice, where they do not experience the second inversion pulse. This situation is remedied by increasing the thickness of the slice selective pulse. Structures with a very short T1 time (e.g., fat) recover signal very fast and appear bright on T1 weighted images. Signal from fat can be suppressed by adding a third inversion pulse immediately before the spin echo sequence or by suppressing signal with the resonance frequency of fat molecules. Figure 4-1 shows an example of morphologic assessment of anomalous right upper pulmonary vein connection to the superior vena cava by using a T1-weighted black-blood turbo spin echo sequence (see Fig. 4-1 , A ) and a postgadolinium contrast volume interpolated gradient echo sequence (see Fig. 4-1 , B ).

Edema Imaging
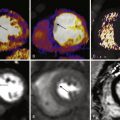
Lengthening of TR and TE produces black-blood images with T2 weighting. Water-bound protons have a longer T2 time. Thus, T2-weighted imaging is sensitive to the water content of the myocardium and, consequently, to the presence of myocardial edema. Fat saturation is usually applied in addition to blood suppression to increase the contrast between normal and edematous myocardium. Double inversion recovery T2-weighted black-blood imaging has been used to delineate the area at risk after myocardial infarction and to identify myocardial edema and inflammation in myocarditis ( Fig. 4-2 ).

Bright-Blood Sequences
Gradient Echoes
Gradient echoes produce images in which blood appears white. They are mainly used for cine imaging depicting the contraction of the heart and the flow of blood during the cardiac cycle. Gradient echo sequences feature excitation pulses separated by a constant TR. Gradients are applied along each axis for slice selection, phase, and frequency encoding. Each excitation pulse tips the longitudinal magnetization in the transverse plane of a certain flip angle. Short TRs are used for fast imaging, which means that excitation pulses are delivered at small intervals. Little time exists for recovery of longitudinal magnetization between excitation pulses. The signal of the stationary tissue in the imaged slice is reduced as it becomes saturated. Blood that flows in the imaged slice has not been excited before and generates a high signal. This phenomenon is called inflow enhancement and provides contrast between blood and myocardium, as well as the blood enhancement in time of flight magnetic resonance angiography (MRA).
Balanced Steady-State Free Precession
The most commonly used bright-blood sequence is a modification of the gradient echo sequence called balanced steady-state free precession (bSSFP). A detailed review of bSSFP is beyond the scope of this chapter and can be found in dedicated publications such as by Scheffler et al. Briefly, if the flip angle, dephasing from T1 and T2 relaxation, and TR are kept constant, a steady state of magnetization will be reached after a few TRs. bSSFP relies on application of excitation pulses with flip angles of alternating polarity on a single magnetization vector that has reached a steady state. The repeated excitation therefore leads to oscillation of magnetization around the z-axis. The magnetization vectors at the beginning and at the end of each TR are identical because all gradients applied during a TR cancel each other. Loss of phase coherence across the field of view as a result of magnetic field inhomogeneity modifies the steady state. A patient-specific process called dynamic shimming may be required to keep the magnetic field homogenous and to allow the use of bSSFP at higher magnetic fields. Contrast in bSSFP sequences is composed of T1 and T2 contributions. T2 and T1 weighting is ideal for differentiation among blood, myocardium, and fat. bSSFP offers the highest signal-to-noise ratio for assessment of function and wall motion ( Fig. 4-3 ).

Cine Imaging
Cine imaging sequences require short TR and are produced using turbo gradient echo sequences. Data are acquired at multiple time points throughout the cardiac cycle; each time point is called a (cardiac) phase. Data acquired during each phase fills a separate k-space bin corresponding to an image in a different phase. Images are then played sequentially as a movie. The more phases are acquired, the better is the temporal resolution. Turbo gradient echo sequences are repeated to acquire numerous lines of k-space per cardiac phase (a shot) during each R-R interval. These fast acquisitions are segmented. The acceleration factor is the number of lines of k-space acquired in each shot and is called the number of segments, the views per segment, or the turbo factor. Increasing the acceleration factor reduces the acquisition time, but it increases the temporal resolution. Reducing the acceleration factor increases the scan time but also the number of phases and improves temporal resolution from a routine 45 milliseconds to 15 to 30 milliseconds. Temporal resolution is calculated as the product of TR times turbo factor (or number of views per segment). However, the apparent temporal resolution can be improved by interpolation of data between adjacent phases, a technique known as view sharing. The acceleration factor must be reduced if the heart rate increases because the number of lines of k-space that can be acquired within an R-R interval decreases. This is especially relevant during stress cardiac MRI examinations. Parallel imaging techniques can reduce the acquisition time by using information obtained from multiple channels on imaging coils. Adding parallel imaging to any imaging sequence reduces its signal-to-noise ratio. Cine gradient echo sequences are less susceptible to artifacts resulting from turbulent blood flow than is cine bSSFP. Thus, cine gradient echo sequences may be preferred for assessment of valve stenosis or regurgitation.
T2 ∗ -Weighted Imaging
T2 ∗ -weighted imaging can be obtained with gradient echo sequence and is used for measurement of myocardial iron content. Iron overload causes signal loss in affected tissues because iron deposits become magnetized in the scanner. These deposits induce local irregularities in the magnetic field that cause water protons around these deposits to lose phase coherence. This effect is concentration dependent. T2 ∗ -weighted images are obtained using a single breath-hold multiecho technique. A single short-axis midventricular slice is acquired at eight TEs ranging between approximately 2 and 18 milliseconds with 2-millisecond increments. A region of interest (ROI) is then drawn in the interventricular septum to measure the signal intensity at each TE. Plotting the signal intensity against the TE produces an exponential decay curve. T2 ∗ is calculated from the equation SI = Ke -TE/T2 ∗ where SI is signal intensity and K is a constant. A myocardial T2 ∗ less than 20 milliseconds is abnormal and indicates probable iron overload, and a myocardial T2 ∗ less than 10 milliseconds indicates severe iron overload.
Phase Contrast Imaging
Phase contrast imaging allows quantification of blow flow velocities and flow rates. The phase is the angular position of a proton spin vector in relation to a frame of reference. Spins moving in a magnetic field acquire a phase shift in comparison with stationary spins. The phase shift is proportional to the velocity of blood. Transverse magnetization can acquire a phase shift, and a phase contrast sequence begins with an excitation pulse to induce transverse magnetization. Then, bipolar gradients oriented in the direction of blood flow and with opposite dephasing and rephasing lobes are applied to each frame of the imaging slice. Repeating the measurement with an inverted bipolar gradient cancels the phase shifts of stationary tissues and those induced by the sequence. The phase shift, or difference, that remains after subtraction of the two measurements represents motion resulting from blood flow. Phase shift for each voxel is expressed in degrees and ranges from +180 to −180 degrees. A greater velocity results in a greater phase shift. Data from a phase contrast acquisition are displayed side by side in a magnitude image, which resembles a bright-blood image, and in a velocity image. The gray scale in the velocity image contains the velocity data for each voxel. The directions of black and white flows depend on the selected velocity encoding direction (head to foot, anterior to posterior, or left to right).
ROIs are usually drawn around the vessel of interest on the velocity images, but they should be cross-checked on magnitude images for appropriate anatomic orientation. Small ROIs are used for peak velocity measurement, and large ROIs are used for flow measurements. The instantaneous blood flow (cm 3 /second) is obtained by multiplying the velocity (cm/second) of each voxel by the area (cm 2 ) for each phase of the cardiac cycle. Phase contrast acquisitions use a FLASH gradient echo sequence with retrospective gating. The acquisition is segmented, as for cine imaging, and can be done with breath holding or free breathing with multiple signal averages. Although breath-held acquisition are shorter, free breathing is usually preferred to avoid changes in intracardiac blood flows induced by the respiratory cycle. All measured velocities are averaged over a range of cardiac cycles. The temporal resolution can be calculated as follows: 2 × TR × views per segment. Each k-space line is sampled twice using the same TR, and the data from the two acquisitions are subtracted. The sequence can be optimized by using the shortest TR and TE possible, especially if the flow of interest is highly accelerated. Slice thickness is usually between 6 and 8 mm but can be reduced to 5 mm for small vessels. The operator must adequately set the velocity encoding (Venc) parameter, which is expressed in cm/second. The Venc should be set just above the anticipated peak velocity of the blood flow of interest. A Venc that is too high leads to a reduced signal-to-noise ratio. A Venc that is too low leads to aliasing. Aliasing is wrapping around of the velocity within a voxel. Correction for aliasing can be done manually or with specialized software, but it is usually best to repeat the acquisition with a higher Venc setting. Setting up the imaging plane is also operator dependent.
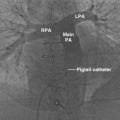
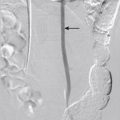
For flow measurement, the imaging plane should be perpendicular to the direction of flow (through-plane flow; Fig. 4-4 ). Velocity measurements can be made both in plane and through plane. An artery that appears ovoid usually indicates deviation from the optimal plane. Partial volume effect can occur if the pixel size exceeds one third of the vessel diameter. Spatial resolution must therefore be increased to image small vessels.