Introduction
Cardiovascular magnetic resonance (CMR) imaging uses the 1 H nucleus in water (H 2 O) and fat (CH 2 and CH 3 groups) molecules as its only signal source, and therefore offers little insight into the biochemical state of cardiac tissue. In contrast, MR spectroscopy (MRS) of the heart allows the study of many other nuclei. It is the only available method for the noninvasive assessment of cardiac metabolism without needing the application of external radioactive tracers. Information on the major nuclei of interest for the metabolic study of cardiac tissue by MRS is given in Table 9.1 , including 1 H, 13 C, 23 Na, and 31 P. Although, theoretically, many clinical questions can be answered with cardiac MRS, the main reason why MRS has not yet fulfilled its potential in clinical cardiology is related to the fundamental physical limitations of the method. MRS is often used to study nuclei other than 1 H, which have a much lower intrinsic MR sensitivity than 1 H. Furthermore, metabolite concentrations in vivo are typically in the mM (millimolar) range, which is several orders of magnitude lower than for water (approximately 80 M) or fat (often >1 M). Therefore the temporal and spatial resolution of MRS has so far remained far behind that of CMR imaging. Successful applications of MRS are those in which the unique metabolic insights of MRS are more important than obtaining high spatial or temporal resolution.
| Nucleus | Natural Abundance | Relative MR Sensitivity | Myocardial Tissue Concentrations |
|---|---|---|---|
| 1 H | 99.98% | 100% | H 2 O 110 M; up to ~90 mM (CH 3 – 1 H of creatine) |
| 13 C | 1.1% | 1.6% | Labeled compounds, several mM |
| 23 Na | 100% | 9.3% | 10 mM (intracellular); 140 mM (extracellular) |
| 31 P | 100% | 6.6% | Up to ~18 mM (PCr) |
Although this chapter focuses on clinical cardiac MRS, some explanation of the experimental principles of MRS is important even for the clinical reader: MRS has been a widespread method in experimental cardiology, ever since the first 31 P-MR spectrum from an isolated heart was obtained by Radda’s group in the 1970s, and since then experimental MRS studies have offered numerous fundamental insights into cardiac metabolism. Furthermore, only with an understanding of the major implications of experimental MRS studies are we able to fully appreciate the potential of the method and extrapolate to clinical cardiac MRS applications that should become feasible in the future, once the technical challenges presently limiting the clinical utility of MRS have been overcome. For those interested in greater detail on experimental MRS and methodological background, comprehensive reviews of the subject are available elsewhere. Complementary clinical reviews are also available.
Physical Principles
The basic principles of MRS (see the reference list for textbooks on the general physical principles of CMR and MRS ) are best explained from the most extensively studied nucleus, 31 P, and from the most widely used animal model, the isolated buffer-perfused rodent heart. These principles apply to MRS of all nuclei. An MR spectrometer consists of a high-field superconducting magnet (currently up to 23.5 T, where tesla [T] is the unit of magnetic field strength) with a bore size ranging between ~5 cm and ~1 m. The nucleus-specific probe head with the radiofrequency (RF) coils, which are used for MR excitation and signal reception, is seated within the magnet bore. The magnet is interfaced with a computer, a pulsed magnetic field gradient system, an RF transmitter, and RF receivers. MRS requires a much higher magnetic field homogeneity than CMR; therefore, before any MRS experiment, the magnetic field must first be homogenized with shim gradients. Spin excitation is achieved by transmitting a radiofrequency pulse through the RF coils into the subject. The resulting MR signal, known as the free induction decay (FID), is then received from the subject by RF coils and recorded by the scanner. The signal (or FID) oscillates with time but within an overall exponentially decaying “envelope.” It typically reaches negligible levels after tens of milliseconds. An MR spectrum is then computed from the FID (by applying the discrete Fourier transform formula ). The MR spectrum describes the signal intensity as a function of resonance frequency. Because of the low sensitivity of MRS, in practice, many FIDs are averaged to obtain MR spectra with an adequate “signal-to-noise ratio” (SNR; i.e., the height of a peak in the spectrum after “matched filtering” divided by the standard deviation of baseline noise ). The required number of averages depends on the concentration of the metabolite under investigation, its MR relaxation times (T1, T2, T2*), the “filling factor” (the mass of the heart relative to the coil size), the natural abundance of the nuclear isotope studied, its relative MR sensitivity (see Table 9.1 ), the pulse angle, and the pulse repetition time (TR). For a perfused rat heart experiment at ≥7 T, 100 to 200 FIDs are typically acquired. To quantify metabolite concentrations from MR spectra, it is vital to correct for partial saturation, which depends on the selected pulse angles and TR. This is because the maximum MR signal is only obtained when nuclei are excited from a fully relaxed spin state, that is, when a time of at least 5 × T1 has passed since a previous excitation (e.g., T1 of phosphocreatine [PCr] at 7 T is ~3 s requiring TR of ≥15 s, at 1.5 T the PCr T1 ~4.4 s requiring TR of ≥22 s); acquisition of fully relaxed MR spectra therefore requires long TRs, leading to prohibitively long acquisition times. In practice, we take advantage of the fact that the initial part of the FID contains most of the signal. Use of shorter TRs therefore yields spectra with higher SNR for a given acquisition time, but some of the signal is lost because of saturation. Such spectra are termed “partially saturated.” The extent of saturation also varies for different 31 P-resonances, because the T1s of 31 P-metabolites such as PCr and adenosine triphosphate (ATP) are significantly different (T1 of PCr is 2–3 × longer than T1 of ATP). Therefore for metabolite quantification from partially saturated spectra, the spectral peak areas are determined (e.g., fitted using the Advanced Method for Accurate, Robust, and Efficient Spectral Fitting [AMARES] or LCModel ), and then correction factors are applied to obtain the metabolite concentration. By comparing fully relaxed and saturated spectra, these factors can be determined for each metabolite. In practice, TRs and pulse flip angles for MRS are chosen to yield acceptable measurement times at an ~20% to 50% degree of saturation. Larger degrees of saturation, resulting from the use of extremely short TRs, make quantification of spectra unreliable because of uncertainties in the metabolite T1 values and the dynamic chemistry of these metabolites.
A 31 P-MR spectrum from an isolated, beating rat heart, obtained in 5 minutes at 7 T with a TR of 1.93 seconds and a pulse angle of 45 degrees, is shown in Fig. 9.1 . A typical cardiac 31 P-spectrum shows six resonances, corresponding to the three (γ, α, β) 31 P atoms of ATP (the resonance at the right shoulder of the α-ATP peak represents the 31 P atom in nicotinamide adenine dinucleotide [NAD + ]), PCr, inorganic phosphate (Pi), and phosphomonoesters (PME), mostly representing adenosine monophosphate (AMP) and glycolytic intermediates. The reason why only a small number of 31 P resonances is detectable, in spite of many more 31 P-containing metabolites being present in the heart, is that, for 31 P nuclei to be visible, they must be present above a certain concentration threshold of ~600 µM and free to tumble in solution. Largely immobilized metabolites such as plasma membrane phospholipids do not yield a quantifiable MR signal because of their very short T2 values; instead, these metabolites contribute to the broad “baseline hump” of 31 P spectra, which is particularly pronounced in the brain. Because of the phenomenon termed “chemical shift,” different metabolites resonate at distinct frequencies, allowing their discrimination from each other. Chemical shift is given in units of parts per million (ppm) relative to the resonance frequency of a reference compound (e.g., phosphoric acid H 3 PO 4 ). 31 P-metabolite resonances extend over a range of ~30 ppm. The physical basis of chemical shift is that nuclei at different positions in the molecule have different spatial distributions of electrons around them, which interact differently with the scanner’s magnetic field. Fitting of spectral peak areas (e.g., with AMARES) and saturation correction gives metabolite concentrations in arbitrary units. Often metabolite ratios, such as the PCr/ATP ratio, are then calculated—implicitly assuming that the concentration of the metabolite in the denominator (ATP here) is well regulated enough to act as an endogenous reference. Alternatively, using an exogenous reference phantom, absolute metabolite concentrations can be computed. Frequently, phenylphosphonic acid (PPA) is used for this purpose because this generates an additional peak in the spectrum, which does not overlap with the cardiac 31 P resonances. The most significant advantage of MRS over destructive methods such as traditional biochemical assays, where the tissue has to be frozen and extracted, is that the MRS measurement is noninvasive. Therefore, spectra can be acquired sequentially, and the response of energy metabolites to ischemia, hypoxia, or inotropic stimulation can be followed longitudinally in the same tissue. With this approach, each heart can serve as its own control, yielding a more powerful experimental design and substantially reducing the number of required experiments.

Experimental Foundations
31 P-MRS
With 31 P-MRS, cardiac high-energy phosphate metabolism, that is, the energetic state of the heart, can be monitored noninvasively. ATP is the direct energy source for all energy-consuming reactions in the heart. PCr acts as a temporal energy buffer and as an energy transport molecule in the “creatine kinase energy shuttle” ( Fig. 9.2 ). For this, the high-energy phosphate group is transferred from ATP to creatine in the mitochondria (where ATP is produced by ATP synthase), yielding PCr and adenosine diphosphate (ADP) in a reaction catalyzed by the mitochondrial creatine kinase isoenzyme (CK mito ). PCr diffuses through the cytoplasm to the site of ATP utilization, the myofibrils, where the back reaction occurs (catalyzed by the myofibrillar-bound MM-creatine kinase isoenzymes; CK MM ), ATP is reformed and is used for contraction. Free creatine then diffuses back to the mitochondria. The reaction rates at the creatine kinase (CK) isoenzymes complement each other to maintain this steady state. The second important function of PCr and creatine kinase is to control the thermodynamic state of the cell, that is, to maintain free cytosolic ADP at low concentration on exertion, instead of raising ADP and consuming Cr in the mitochondria, thereby up-regulating oxidative phosphorylation. This is a requirement for normal cardiac function, because ADP determines the free energy change of ATP hydrolysis (Δ G ; kJ/mol), a measure of the maximum amount of energy released from ATP hydrolysis (see Neubauer for details on the calculation of free ADP and Δ G from creatine kinase shuttle metabolites). In the normal heart, Δ G is ~−58 kJ/mol. Many intracellular enzymes such as SR-Ca 2+ -ATPase and others will not function properly above a threshold value for Δ G of about −52 kJ/mol. CK has also been implicated in minimizing cellular ADP loss, maintaining cellular pH, and activating glycogenolysis and glycolysis.

Pi is formed when ATP is hydrolyzed: ATP ⇌ ADP + Pi. Pi increases when ATP utilization exceeds ATP production, for example, during ischemia. Intracellular pH (pH i ) can also be measured with 31 P-MRS, from the chemical shift difference between PCr and Pi, which is pH-sensitive because of shifts in the equilibrium H 2 PO 4 − ⇌ HPO 4 2 − + H + near pH 7.
In principle, the intracellular magnesium ion concentration can also be measured by 31 P-MRS from the chemical shift difference between PCr and β-ATP.
Cardiac energy metabolism has been investigated by 31 P-MRS under various experimental conditions. For example, the effect of changes in cardiac workload on energetics has been examined. PCr levels do not change with moderate changes in workload, but decline with substantial increases in cardiac work. ATP content remains almost constant with varying workload and during the cardiac cycle, because the creatine kinase equilibrium favors ATP synthesis over PCr synthesis by a factor of ~100. Thus for any situation of myocardial stress, including ischemia, ATP only decreases when PCr levels are substantially depleted. This is the fundamental reason why the PCr/ATP ratio is a highly sensitive indicator of the energetic state of the heart. Changes of myocardial energy metabolism in experimental models of ischemia and reperfusion highlight the potential of 31 P-MRS for the detection of ischemia in the human heart. Fig. 9.3 shows an example of 31 P-MR spectra during control, ischemia, and reperfusion. After 15 minutes of total, global ischemia, ATP and PCr resonances have disappeared, and almost all the 31 P in heart is present as Pi and PME. During reperfusion, PCr and Pi show full, and ATP partial recovery. We showed that, when hearts are pretreated with endothelin-1, a hormone that increases susceptibility to ischemia, recovery of high-energy phosphate metabolism is impaired. By summing up data from several experiments, Clarke et al. demonstrated that the decrease of PCr and the increase of Pi were amongst the very earliest metabolic responses in myocardial ischemia, with significant changes occurring within seconds. Thus if we were successful in measuring energetics in human myocardium with high temporal and spatial resolution, we could directly image parameters that detect myocardial ischemia within seconds after its onset. No other diagnostic approach currently achieves this, although hyperpolarized 13 C imaging technology seems likely soon to offer similar insight earlier in the energetic chain.

With the magnetization (saturation) transfer method, the forward rate and velocity of the creatine kinase reaction, a measure of ATP transfer from mitochondria to myofibrils, can be measured in vivo. Creatine kinase reaction velocity correlates with cardiac workload and with recovery of mechanical function after ischemia. In animal models or skeletal muscle, magnetization transfer also allows measurement of the forward rate and velocity of the ATP hydrolysis reaction in the myofibrils as a measure of ATP consumption.
Experimental 31 P-MRS studies have substantially contributed to our understanding of the role of energetics in heart failure. Independent of the etiology of heart failure, the failing myocardium shows reduced PCr, unchanged or moderately (by <30%) reduced ATP, unchanged or increased Pi, and substantially reduced creatine kinase reaction velocity and flux. These changes are likely to contribute to the impairment of contractile reserve in failing myocardium, because of the failure to maintain appropriate Δ G values during inotropic stimulation.
1 H-MRS
Other than 31 P, the nuclei with the greatest potential for clinical cardiac MRS are 1 H and hyperpolarized 13 C (of which, more below). Protons have the highest MR sensitivity of all MR-detectable nuclei as well as high natural abundance (see Table 9.1 ). 1 H is contained in a large number of metabolites, for example, creatine, lactate, carnitine, taurine, and −CH 3 and −CH 2 resonances of lipids. Measurement of total creatine by single voxel spectroscopy or navigator-gated echo planar spectroscopic imaging (EPSI) or potentially by creatine chemical exchange saturation transfer (CrCEST) imaging should, in conjunction with 31 P-MRS, allow the noninvasive determination of free ADP and Δ G of ATP hydrolysis, as demonstrated by Bottomley and Weiss in dogs and humans. By means of the oxymyoglobin and deoxymyoglobin resonances, tissue deoxygenation can be measured. Technical challenges for 1 H-MRS include the need for suppression of the strong 1 H signal from water and the complexity of 1 H spectra with overlapping resonances, many of which remain to be characterized, and which means that excellent shimming and motion compensation are needed.
13 C-MRS
The 13 C nucleus has a low natural abundance (~1%), and for a classical 13 C-MRS experiment, the heart has to be supplied with 13 C-labeled compounds such as, for example, 1- 13 C-glucose. Cardiac substrate utilization, citric acid cycle flux, pyruvate dehydrogenase flux or beta-oxidation of fatty acids can then be quantified. Clinical cardiac studies have yet to be reported because of the low sensitivity of 13 C-MRS and the requirement for high concentrations of exogenous 13 C-labeled precursors.
However, the technique of hyperpolarization can increase the SNR of 13 C experiments by a factor of up to 10,000× for a few minutes, until the magnetization decays by T1 relaxation back to thermal equilibrium. This is a very active area of research as new pulse sequences, analysis methods, and injectable hyperpolarized agents are developed to capitalize on this extraordinary but brief burst of enhanced signal-to-noise. Pyruvate is a particularly attractive molecule to hyperpolarize because it plays a pivotal role in substrate uptake before oxidative phosphorylation, enabling fluxes into acetyl acetate, lactate, and bicarbonate to be quantified. These enable experimental assessment of the balance between fats, carbohydrates, and ketone bodies being metabolized by the heart, a balance which may well be disturbed in disease. Hyperpolarization studies in animal models are revisiting many of the systems previously characterized by 31 P-MRS to obtain further insight, for example, ischemia-reperfusion models.
23 Na-CMR
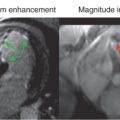
23 Na-CMR can evaluate changes in total and intracellular and extracellular Na + during cardiac injury. A cardiac 23 Na spectrum shows a single peak representing the total Na + signal. To split the intracellular and extracellular Na + pools into two resonances, paramagnetic shift reagents, such as [TmDOTP] 5− , are added to the perfusate. This method has been used experimentally to examine the mechanisms of intracellular Na + accumulation in ischemia-reperfusion injury, but 23 Na-MR shift reagents are not yet available for clinical use. Experimental CMR of total 23 Na shows that in acute ischemia, the total myocardial 23 Na CMR signal increases because of the breakdown of ion homeostasis and the formation of both intracellular and extracellular edema (see Kim et al. and Horn et al. ). Furthermore, 23 Na remains significantly elevated during chronic scar formation post coronary ligation because of the expansion of the extracellular space in scar, and the area of elevated 23 Na signal correlates closely with histologically determined infarct size. Importantly, 23 Na content is not elevated in stunned or hibernating myocardium. Thus 23 Na CMR may allow detection of myocardial viability without the use of external contrast agents. Significant improvements in image quality were made at 3 T, and, recently, high-quality human 23 Na images and retrogated cine movies have been acquired at 7 T in the human heart. An example of the high spatial and temporal resolution from 7 T is shown in Fig. 9.4 . Furthermore, Umathum et al. have recently presented the first results from a whole-body 23 Na birdcage coil at 7 T, which can image from the pelvis to the heart in one scan. The outlook for cardiac sodium CMR has recently been reviewed by Bottomley.

Other Nuclei
The availability of ultra-high field (7 T) CMR scanners is making it possible to perform human in vivo spectroscopy and imaging also of fluorine ( 19 F), which is not present naturally in the body in mobile form and therefore makes an attractive CMR tracer to study, for example, in drug uptake. Imaging of chlorine ( 35 Cl) and potassium ( 39 K) has also been demonstrated at 7 T, which makes it possible to map cell membrane potential in vivo.
Clinical Magnetic Resonance Spectroscopic Studies
Methodologic Considerations
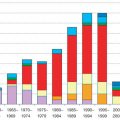
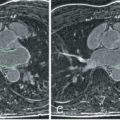
Historically, almost all human cardiac MR spectroscopy studies have interrogated the 31 P nucleus. The main reason for the slow progress with clinical cardiac MRS is that the method poses major technical challenges. In practice, total examination time should not be more than 60 minutes, and time for signal acquisition is therefore limited. The heart is a rapidly moving organ, currently requiring gating to the electrocardiogram (ECG), and, when resolution is further improved, ultimately to respiration as well. Most clinical MRS studies were performed at 1.5 T until the early 2000s, and since then mostly at 3 T; the first 7 T studies are now being published. Although the field strength of animal scanners continues to increase, the latest 7 T human systems have comparable field strength with that used historically for many important animal studies. The cardiac muscle lies behind the chest wall skeletal muscle, which creates a strong 31 P signal that must be suppressed by spectral localization techniques, outer volume suppression, or surface spoiling gradient coils. Such localization methods include depth-resolved surface coil spectroscopy (DRESS), rotating frame one-dimensional chemical shift imaging (1D-CSI), image-selected in vivo spectroscopy (ISIS), and three-dimensional (3D)-CSI ( Fig. 9.5 ). These methods are reviewed in detail elsewhere. Bottomley et al. have pioneered most of the early methodological development of human cardiac MRS. Most MRS studies have been performed in prone position rather than supine because this reduces motion artifacts and may slightly reduce the distance of the heart from the surface coil, thereby improving sensitivity. Most spectroscopic techniques require a stack of 1 H scout images to be obtained first, which are used to select the spectroscopic volume(s). The low sensitivity of 31 P-MRS requires relatively large voxel sizes, typically about 20 to 70 mL (and often rather larger if one considers the “true” integrated point-spread-function volume). A set of 31 P-MR spectra acquired from a healthy volunteer with 3D-CSI at 1.5 T, 3 T, and 7 T is shown in Fig. 9.6 . Compared with the rat heart spectrum in Fig. 9.1 , the signal-to-noise is lower at 1.5 and 3 T, and two additional resonances are detected: 2,3-diphosphoglycerate (2,3-DPG), because of the presence of erythrocytes in the interrogated voxel, and phosphodiesters (PDE), a signal caused by membrane as well as serum phospholipids. The 2,3-DPG peaks overlap with the Pi resonance, which is therefore challenging to discriminate in blood-contaminated human 31 P-MR spectra. Thus intracellular pH is hard to determine; early results suggest that Pi and pH become detectable in human myocardium when spatial resolution and signal-to-noise are increased by scanning at 7 T. By calculating the PCr/ATP and PDE/ATP peak area ratios, relative quantification of human 31 P spectra is simple. PCr/ATP is a powerful index of the energetic state of the heart (see Experimental Foundations section), whereas the meaning of the PDE/ATP ratio is poorly understood, and this ratio probably does not change with cardiac disease. 31 P resonances must be corrected for partial saturation, as described for experimental MRS. Appropriate T1 values have been summarized. Intrinsic 31 P-T1 values are believed to remain constant in the presence of cardiac disease, although observed T1 values can change because of the effects of chemical exchange in the CK system. Furthermore, 31 P spectra require correction for blood contamination: blood contributes signal to the ATP, 2,3-DPG and PDE resonances. Because human blood spectra have an ATP/2,3-DPG area ratio of ~0.11 and a PDE/2,3-DPG area ratio of ~0.19, for blood correction, the ATP resonance area of cardiac spectra is reduced by 11% of the 2,3-DPG resonance area, and the PDE resonance area is reduced by 19% of the 2,3-DPG resonance area. 31 P-metabolite ratios in blood also change in the presence of disease, which should be taken into account.


Absolute quantification of PCr and ATP is technically challenging, but is desirable because the PCr/ATP ratio does not detect simultaneous decreases of both PCr and ATP, which occur in the failing heart or in infarcted nonviable myocardium. Absolute 31 P-metabolite levels can be obtained by acquiring signal from a 31 P standard as well as estimates of myocardial mass from CMR. A different approach calibrates the 31 P signal to the tissue water proton content, measured by 1 H-MRS. Signals can be calibrated to an electronically synthesized reference signal using the “electronic reference to access in vivo concentrations” (ERETIC) method. Modern “non-Fourier” methods solve for the metabolite concentrations using the powerful “inverse problem” mathematical formulation. For example, spectral localization with optimum pointspread (SLOOP) postprocessing can deliver concentrations in noncuboidal compartments (e.g., myocardium). Spectroscopy with linear algebraic modeling (SLAM) accelerates the acquisition steps to focus the scan time most effectively to find concentrations in a predetermined compartment, for example, myocardium segmented from a 1 H image. A variety of non-Cartesian acquisition methods, such as compressed sensing (CS) spectroscopy or spiral 31 P-MRS, also enable a smooth tradeoff between acquisition time, spatial resolution, and spectral resolution.
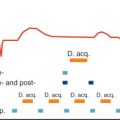
A long-term goal for human cardiac MRS is to combine 31 P- and 1 H-spectroscopy to measure free ADP and Δ G of ATP hydrolysis, as described in canine myocardium by Bottomley et al. Another highly relevant energetic parameter is the rate and extent of ATP transfer (“CK rate k f ” and “CK-flux”; see Experimental Foundations section). Bottomley et al. developed the four-angle saturation transfer (FAST) method, which allows measurement of creatine kinase rates in ~30 minutes at 1.5 T. More recently, Bottomley et al. have introduced the triple repetition time saturation transfer (TRiST) and two repetition time saturation transfer (TwiST) methods to measure CK flux at 3 T based on dual-TR T1 measurements during saturation (illustrated in Fig. 9.7 ), and we have introduced Bloch-Siegert four angle saturation transfer (BOAST) to measure 3D-resolved CK rates at 7 T.

The methods of 31 P-MRS are still being improved significantly. Nevertheless, a major effort to standardize protocols and to make routinely available advanced RF coils and pulse sequences at ultra-high field strengths will be required to bring cardiac MRS into clinical practice.
Healthy Volunteers
Because of differences in the MRS methods used, the range of “normal” human heart PCr/ATP ratios reported in the literature is considerable, from about 1.1 to 2.4, with an overall average of about 1.8. This attests to the need for development of methodologic standards for MRS. SLOOP values for absolute PCr levels in normal human myocardium are 9.0 ± 1.2 mmol/kg wet weight, and ATP levels are 5.3 ± 1.2 mmol/kg wet weight. There is an accumulation of evidence that high-energy phosphate levels decrease slightly with advanced age, perhaps because of increasing mitochondrial dysfunction. During stress, PCr/ATP ratios stay normal for all but extreme levels of inotropic stimulation, when there is a small decrease. Using FAST (see earlier), high-energy phosphate turnover rates (CK reaction rates) were found to be 0.29 ± 0.06 s -1 in healthy volunteers at rest and did not change during doubling of the cardiac rate–pressure product.
Athlete’s Heart and Hypertension
In patients with hypertension, Lamb et al. demonstrated reduced PCr/ATP ratios both at rest and during dobutamine stress, and PCr/ATP ratios also correlated inversely with indices of diastolic function (E deceleration peak). In contrast, two other studies showed no significant changes of cardiac energetics in patients with hypertension. Differences in patient characteristics—for example, severity and duration of hypertension—may be responsible for this discrepancy. Experimental data clearly suggest that cardiac energetics are impaired in long-standing hypertension. In contrast, physiologic hypertrophy in the athlete’s heart does not lead to a decrease of the myocardial PCr/ATP ratio, either at rest or during stress ; experimental studies in exercise-trained rats had predicted this finding. In the future, it will be important to unravel the molecular mechanisms responsible for these differences in energy metabolism between physiologic and pathologic hypertrophy.
Diabetes and Obesity
Other than via the well-recognized secondary mechanisms (e.g., accelerated coronary disease), diabetes has numerous deleterious effects on cardiac metabolism that may lead to cardiomyopathy. For example, the diabetic heart is insulin resistant and glucose utilization is impaired. Plasma free fatty acid levels are elevated, leading to increased expression of mitochondrial uncoupling proteins and reduced expression of glucose transporters (GLUT4). Several studies have examined cardiac energy metabolism in patients with maintained left ventricular (LV) ejection fraction and type 2 or type 1 diabetes mellitus and have uniformly shown reduced PCr/ATP ratios. Van der Meer et al. observed no change in PCr/ATP in 78 type 2 diabetes mellitus men given either pioglitazone or metformin for 24 weeks, despite improvements in LV function. PCr/ATP ratios were found to correlate inversely with plasma free fatty acid levels and with indices of diastolic function. Shivu et al. showed that in 25 asymptomatic type 1 diabetic patients, PCr/ATP was reduced (1.6 ± 0.2 vs. 2.1 ± 0.5 in controls) within 5 years of diagnosis and that this changed little more than 10 years after diagnosis (to 1.5 ± 0.4), whereas microvascular dysfunction worsened in diabetics over time (myocardial perfusion reserve index 1.7 ± 0.6 vs. 2.3 ± 0.4, P = .005). We recently showed in a study of 31 type 2 diabetic patients that exercise further reduced the PCr/ATP ratio (resting PCr/ATP was 1.74 ± 0.26 in patients vs. 2.07 ± 0.35 in controls, and dropped to 1.54 ± 0.26; P = .005), and that this correlated with myocardial perfusion reserve index from adenosine stress CMR imaging.
Initial evidence also suggests reduced PCr/ATP ratios in patients with uncomplicated obesity and elevated free fatty acid levels. For example, Rider et al. demonstrated cardiac energetic differences between obese and normal-weight subjects by 31 P-MRS at rest: the obese group had a 15% lower PCr/ATP ratio (1.73 ± 0.40 vs. 2.03 ± 0.28; P = .048). During dobutamine stress, a further reduction in PCr/ATP occurred in the obese group (from 1.73 ± 0.40 to 1.53 ± 0.50; P = .03) but not in normal-weight subjects (from 1.98 ± 0.24 to 2.04 ± 0.34; P = .50). Together, these results suggest that early cardiac metabolic derangement as observed in diabetes and obesity may contribute to the later development of heart failure, suggesting a possible explanation for the increased incidence of heart failure in diabetes and obesity. However, intriguingly, it is also observed that obese patients with heart failure survive longer than normal-weight patients with heart failure, a phenomenon termed the “obesity paradox.”
Proton spectroscopy ( 1 H-MRS) is an established method to monitor triglyceride (TG) concentration (“fat fraction”) in the liver and heart. Van der Meer et al. investigated the effect of drinking 800 mL cream for 3 days on healthy young men, observing a more than doubling of hepatic TG concentration, but no significant effects on cardiac TG, function, or energetics. Holloway et al. compared the effect of a 5-day high-fat or normal-fat diet in healthy males, observing a 9% ( P < .01) reduction on cardiac PCr/ATP in the high-fat group. Recently, Levelt et al. demonstrated that myocardial triglyceride content is an independent predictor of LV concentric remodeling and cardiac systolic strain in a study of 46 patients with type 2 diabetes.
Heart Failure
Experimental studies have firmly established altered energy metabolism as a hallmark of the chronically failing myocardium (see above). Initial clinical 31 P-MRS studies, however, which included mild stages of heart failure, did not find significant reductions of PCr/ATP ratios. Hardy et al. first reported that the myocardial PCr/ATP ratio is significantly reduced (from 1.80 ± 0.06 to 1.46 ± 0.07) in patients with symptomatic heart failure of ischemic or nonischemic etiology. Subsequently, we found that the decrease of PCr/ATP ratios in dilated cardiomyopathy (DCM) correlated with the New York Heart Association (NYHA) class and with LV ejection fraction. Thus PCr/ATP ratios decrease in advanced stages of heart failure ( Fig. 9.8 ) but initially remain normal. This pattern was observed also by Leme et al. in a study of 39 patients with Chagas disease, whose PCr/ATP ratios at rest correlated with NYHA class and where PCr/ATP dropped further during isometric handgrip exercise, consistent with the involvement of ischemia in Chagas disease. PCr/ATP ratios also hold prognostic information on survival of patients with heart failure. We showed that in DCM, the myocardial PCr/ATP ratio was a better predictor of long-term survival than LV ejection fraction or NYHA class ( Fig. 9.9 ). It is known from experimental work that in heart failure, both PCr and ATP levels decrease in parallel, and this cannot be detected by measurement of PCr/ATP ratios. Accordingly, using SLOOP (see above) in patients with heart failure because of DCM (ejection fraction 18%), Beer et al. reported that absolute PCr levels were reduced by 51%, ATP levels by 35%, whereas the PCr/ATP ratio decreased by 25% only. Furthermore, significant correlations between LV volumes/ejection fraction and energetics were found, with the strongest correlations observed for PCr and the weakest for the PCr/ATP ratio. Thus ATP levels are reduced in human heart failure, and the true extent of changes in energy metabolism in heart failure is underestimated when PCr/ATP ratios rather than absolute concentrations are measured. In a later study, Beer et al. applied SLOOP 31 P-MRS before and after exercise training in a study involving 24 DCM patients. They demonstrated that exercise training improves LV function without causing deterioration in cardiac energetics. Similar results were obtained by Holloway et al. in a study of 15 DCM patients using 3 T 31 P-MRS at rest and during exercise, where LV function improved but no significant changes in PCr/ATP were observed. Nakae et al. used 1 H-MRS to demonstrate significant reductions of total creatine levels and a correlation of creatine and LV ejection fraction in patients with DCM.


Weiss et al. showed a 50% reduction of CK reaction rates in mild-to-moderate heart failure, indicating that energy turnover rates are depressed to a greater extent than steady-state levels of PCr and ATP. Weiss et al. subsequently measured the CK flux (i.e., ATP synthesis rate) in failing hypertrophied myocardium, suggesting that the kinetics of ATP turnover through CK distinguish failing from nonfailing hypertrophic hearts more clearly than the relative or absolute CK metabolite pool sizes. Weiss et al. subsequently performed a prospective study following 58 heart failure patients for a median of 4.7 years, and showing that CK flux was a significant predictor of heart failure outcomes even after correction for NYHA class, LV ejection fraction, and race. For each increase in CK flux of 1 µmol/g/s, risk of heart failure–related composite outcomes decreased by 32% to 39%. Overall, therefore, 31 P-MRS may be valuable for prognosis evaluation in heart failure.
Heart failure trials from the past two decades show that energy-costly treatment, such as beta-receptor mimetics or phosphodiesterase inhibitors, increases mortality, whereas energy-sparing treatment, such as beta-blockers, angiotensin-converting enzyme (ACE) inhibitors, or angiotensin II receptor blockers, improves survival. Thus one of the most promising future applications of clinical 31 P-MRS is monitoring of the cardiac energetic response to new forms of heart failure treatment, and it is likely that the PCr/ATP ratio or absolute concentrations of PCr and ATP are powerful surrogate parameters for mortality in this situation. For example, in 6 patients with DCM treated with ACE inhibitors, digitalis, diuretics and beta-blockers for 3 months, PCr/ATP ratios improved significantly during clinical recompensation, from 1.51 ± 0.32 to 2.15 ± 0.27. However, no systematic controlled study has so far used 31 P-MRS to monitor cardiac energetics during heart failure treatment. A treatment trial using 31 P-MRS to monitor cardiac energetics has been reported for Friedreich ataxia. This primarily neurological disease is often associated with cardiomyopathy, as lack of the mitochondrial protein frataxin leads to deficient mitochondrial respiration and increased free radical damage. In patients with Friedreich ataxia treated with antioxidants (coenzyme Q and vitamin E) for 6 months, Lodi et al. reported that the myocardial PCr/ATP ratio increased from 1.34 ± 0.59 to 2.02 ± 0.43, demonstrating that cardiac energy metabolism was markedly improved by antioxidative treatment. Hirsch et al. demonstrated that 600 mg allopurinol (a xanthine oxidase inhibitor) improved cardiac energetics in patients with heart failure (i.e., PCr/ATP increased by 11%, P < .02), and CK flux increased by 39% (from 2.07 ± 1.27 µmol/g/s to 2.87 ± 1.82 µmol/g/s, P < .007). However, the 253 patient multicenter randomized controlled Xanthine Oxidase Inhibition for Hyperuricemic Heart Failure Patients (EXACT-HF) trial failed to observe any improvement in outcomes after 24-week administration of allopurinol, suggesting that effective treatment requires modification of more than this one aspect of the cardiac nitroso-redox balance.
Frenneaux et al. investigated the application of the antianginal drug perhexiline to treat heart failure in a series of studies. Perhexiline is believed to inhibit the metabolism of free fatty acids. In heart failure patients, perhexiline increased the rate of PCr recovery in skeletal muscle after exercise, indicating improved mitochondrial capacity. Recently, Frenneaux et al. published the results of a clinical trial in 50 patients with nonischemic heart failure, observing that treatment with perhexiline 200 mg once daily for 1 month was associated with a 30% increase in PCr/ATP (from 1.16 ± 0.39 to 1.51 ± 0.51; P < .001).
Specific Gene Defects With Cardiac Pathology
Clinical cardiac 31 P-MRS has major potential for the noninvasive phenotyping of cardiomyopathies because of specific gene defects, which may eventually be identifiable by a specific metabolic profile. Most of the work in this area has been on hypertrophic cardiomyopathy (HCM), which is, in most cases, because of specific gene mutations associated with structural disarray of myofibrils and often with substantial increases of left ventricular wall thickness. Energetic derangement has been suggested as the common pathophysiologic mechanism underlying all forms of HCM, and experimental studies of transgenic models of HCM confirm this. Human studies in HCM have uniformly shown reduced PCr/ATP ratios. For example, Jung et al. demonstrated that in young, asymptomatic patients with HCM, PCr/ATP ratios were reduced, indicating that energetic imbalance occurs early in the disease process. They also reported that HCM patients with a familial history of the disease showed a more pronounced derangement of energetics than those patients without a family history. Abraham et al. observed a 24% reduction in myocardial PCr, 26% reduction in CK k f , and 44% reduction in forward CK flux in patients with HCM caused by a point mutation of Arg403Gln compared with volunteers. They argue that the energetic deficit, even in patients without changes in cardiac function, means that the energetic deficit results from the mutation and is not simply a consequence of mechanical dysfunction. Larger studies at 3 T have confirmed the derangement of energetics in HCM. Dass et al. demonstrated that in 35 patients with HCM, leg exercise further reduced PCr/ATP (1.56 ± 0.29 vs. 1.71 ± 0.35 at rest; P = .02), whereas there was no change on exercise in normal (2.16 ± 0.26 vs. 2.14 ± 0.35 at rest; P = .98). Frenneaux et al. showed that treatment of HCM patients with perhexiline for 4.6 ± 1.8 months improved PCr/ATP (from 1.27 ± 0.02 to 1.73 ± 0.02, P = .003). Using 1 H-MRS, Nakae et al. reported reduced total creatine content in patients with HCM. In the future, large patient groups with HCM and known specific gene defects will have to be studied to establish whether metabolic phenotyping by 31 P- and 1 H-MRS can identify the underlying genetic mutation.
Becker muscular dystrophy, an X-chromosome linked disease associated with the absence or altered expression of dystrophin in cardiac and skeletal muscle, may lead to the development of cardiomyopathy and heart failure. Clarke et al. showed that both patients (PCr/ATP ratio 1.55 ± 0.33) and female gene carriers (1.37 ± 0.25) had significantly lower PCr/ATP ratios than control subjects (2.44 ± 0.33), although all of the carriers and most of the patients showed preserved left ventricular function. Thus energetic imbalance occurs early in the disease process and may contribute to the development of contractile dysfunction in Becker disease. Altered cardiac energetics have also been demonstrated in hereditary hemochromatosis, in familial hypercholesterolemia, where PCr/ATP ratios returned to normal after treatment with statins, and in Fabry disease where PCr/ATP in 23 patients was 1.68 ± 0.43 compared with 1.92 ± 0.50 in volunteers.
Valvular Heart Disease
Experimental studies have shown impaired cardiac energy metabolism in advanced left ventricular hypertrophy. Similarly, in patients with left ventricular hypertrophy resulting from aortic stenosis or incompetence, Conway et al. detected reduced PCr/ATP ratios (1.1 ± 0.32 vs. 1.5 ± 0.2 in volunteers; mean ± standard deviation) when patients were in clinical heart failure, but PCr/ATP ratios were normal (1.56 ± 0.15) for clinically asymptomatic stages. Likewise, in patients with aortic valve disease, we showed reduced PCr/ATP ratios only for NYHA classes III and IV but not for classes I and II. When matched for the degree of heart failure, energy metabolism was more affected in aortic stenosis (pressure overload) than in aortic incompetence. We also showed that in aortic stenosis, altered energetics correlated with left ventricular end-diastolic pressures and with end-diastolic wall stress. We reported unchanged absolute ATP concentrations and a 28% decrease of PCr concentrations in aortic stenosis using SLOOP. The time course of recovery of cardiac energetics during regression of hypertrophy after surgical valve replacement can also be monitored by 31 P-MRS. When patients with aortic valve stenosis were studied before and 40 weeks after surgery, the PCr/ATP ratio increased from 1.28 ± 0.17 to 1.47 ± 0.14 (control subjects 1.43 ± 0.14); that is, energetic impairment was completely reversed 9 months after valve replacement. Energetics in aortic stenosis patients (1.45 ± 0.21 vs. 2.00 ± 0.25 in controls, P < .001) have been shown to correlate with perfusion, oxygenation, and LV functional defects, and to improve markedly 8 months after aortic valve replacement energetics (PCr/ATP 1.86 ± 0.48). A recent multicenter randomized control trial of perhexiline to augment myocardial protection in patients with left ventricular hypertrophy undergoing cardiac surgery was halted early when it became clear that perhexiline did not provide an additional benefit in hemodynamic performance or attenuate myocardial injury in the hypertrophied heart secondary to aortic stenosis (AS). Nevertheless, long-term prospective clinical studies of the role of energetics in valvular disease remain the best strategy to determine whether 31 P-MRS provides clinical information on the optimum timing of valve replacement.
Ischemic Heart Disease
Magnetic Resonance Spectroscopy Stress Testing to Detect Ischemia
Within seconds after reduction of oxygen supply, PCr levels decrease and inorganic phosphate increases; that is, these changes are extremely rapid indicators of myocardial ischemia (see above). If it were feasible to detect these metabolites in human myocardium with high temporal and spatial resolution, a 31 P-MRS-based “biochemical stress test” would be a powerful diagnostic tool for detecting exercise-induced regional ischemia, only requiring low levels of stress and without the need for intravenous agents or radiation. In selected patients with large anterior wall territories, which become ischemic on exercise, the feasibility of this principle has been demonstrated: Weiss et al. ( Fig. 9.10 ) showed that in patients with high-grade stenosis of the left anterior descending or left main coronary arteries, PCr/ATP ratios were normal at rest, decreased during handgrip exercise (leading to a 30%–35% increase of cardiac work) from 1.5 ± 0.3 to 0.9 ± 0.2, and returned toward normal during recovery. After revascularization, PCr/ATP ratios remained constant during exercise. These findings were reproduced by Yabe et al., who also demonstrated that a decrease of PCr/ATP ratios was only detected in patients with reversible defects on thallium scintigraphy (viable myocardium) but not in those with fixed thallium defects (scar), where PCr/ATP was already reduced at rest. Najjar et al. applied 31 P-MRS stress testing to investigate potential cardioprotective effects of RSR13 (an allosteric modifier of hemoglobin’s affinity for oxygen) in seven subjects with coronary artery disease but did not observe significant changes in energetics, in contrast to successful results in canine models. Exercise testing has also been performed at 3 T. With a 31 P-MRS stress test, we would also be able to test the efficacy of revascularization procedures or of established or new antianginal medication. It is conceivable that a “PCr threshold” may become a clinically relevant parameter as the level of exercise achievable without a decrease of myocardial PCr concentrations. This may in the future allow objective fine-tuning of antianginal therapy.

Related posts:
 Use of Navigator Echoes in Cardiovascular Magnetic Resonance and Factors Affecting Their Implementation
 Acute Myocardial Infarction: Cardiovascular Magnetic Resonance Detection and Characterization
 Atherosclerotic Plaque Imaging: Coronaries
 Cardiac Iron Loading and Myocardial T2*
 Pulmonary Vein and Left Atrial Imaging
 Noncardiac Pathology
Stay updated, free articles. Join our Telegram channel

Full access? Get Clinical Tree


