Abstract
The differential diagnosis for a cardiac mass is broad, and includes thrombus, normal anatomical variants, metastases, and a variety of primary cardiac tumours. Although cardiac tumours are rare, they can lead to serious complications such as intra-cardiac obstruction and fatal arrhythmias, even when benign. Over the last decade, there have been significant advances in cardiac imaging. This chapter discusses the roles of echocardiography, cardiovascular magnetic resonance, cardiac computed tomography, and nuclear imaging in the diagnosis, characterisation, and management of cardiac masses. This chapter also provides an overview of the most common cardiac masses and their key imaging features across all modalities.
Keywords
Cardiac tumours, Cardiovascular MR, Echocardiography, Cardiac CT, Cardiac PET.
17.1
Introduction
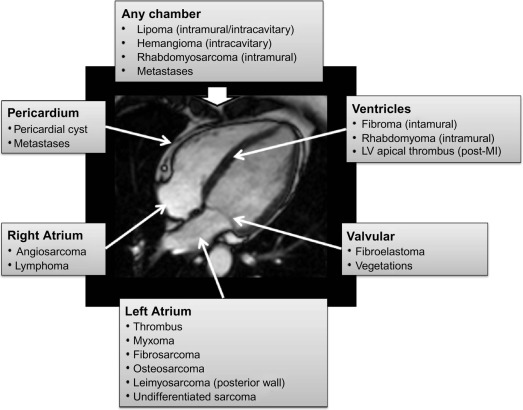
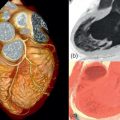
Cardiac tumours are a rare finding, with an autopsy prevalence of less than 0.5% [ , ]. However, even when pathologically benign, they can fatally compromise cardiac haemodynamics or lead to serious complications such as embolism or arrhythmia [ ]. Approximately 75% of all primary cardiac tumours are benign, and the most common in adults are myxomas (50%), papillary elastomas (20%), lipomas (15–20%), and haemangiomas (5%) [ , ]. The remaining 25% of primary cardiac tumours are malignant; ~ 95% of these are sarcomas and ~ 5% are lymphomas ( Table 17.1 and Figure 17.1 ) [ , ]. Secondary cardiac tumours, i.e. metastases, are 20–40 times more common than primary cardiac tumours [ , ]. However, the differential diagnosis for a cardiac mass extends beyond cardiac tumours, and more common diagnoses are intra-cardiac thrombus or misinterpreted normal anatomical variants [ ]. Multimodality knowledge regarding the imaging features of cardiac neoplasms and other masses is therefore important for establishing an accurate diagnosis, avoiding misinterpretation of normal variants and for guiding treatment and staging in confirmed tumours. In this chapter, we review the role of echocardiography, cardiovascular magnetic resonance (CMR), cardiac computed tomography (CCT), and nuclear imaging techniques in the assessment of a suspected cardiac mass.
| Benign | Malignant | ||
|---|---|---|---|
| Myxoma | 30% | Angiosarcoma | 9% |
| Lipoma | 10% | Rhabdomyosarcoma | 6% |
| Fibroelastoma | 10% | Mesothelioma | 4% |
| Rhabdomyoma | 8% | Fibrosarcoma | 3% |
| Fibroma | 4% | Lymphoma | 2% |
| Hemangioma | 3% | Other sarcomas | 3% |
| Teratoma | 3% | Teratoma | < 1% |
| Others | 5% | Others | < 1% |
| Total | 70–75% | Total | 25–30% |
17.2
Echocardiography
Transthoracic echocardiography (TTE) is the most readily available noninvasive imaging technique and thus remains the first-line diagnostic test when a cardiac tumour is suspected ( Figure 17.2 ). Moreover, many cardiac masses are detected incidentally during routine echocardiographic studies for other indications. In many cases, echocardiography demonstrates characteristic anatomical and functional features that already permit a differential diagnosis of a cardiac mass. 3D echocardiography has further enhanced the role of echocardiography in the assessment of cardiac masses particularly in terms of anatomical location, morphology, and functional impact [ , ] (see Chapter 2 ).
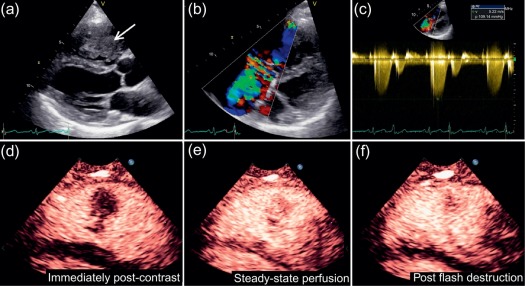
Although the widespread availability of echocardiography is a major advantage, there are also several limitations, including operator dependence/experience, a restricted field of view (particularly in patients with pulmonary disease or a large body habitus), and limited imaging of the right heart and mediastinal structures. Although TTE is usually sufficient to identify a cardiac mass, transoesophageal echocardiography (TOE) can sometimes be more informative due to the higher spatial resolution afforded by high-frequency transducers, better acoustic windows, and the feasibility of additional imaging planes. Whilst some tissue characterisation is possible with echocardiography (particularly assessment of calcification) and some masses show specific echogenic properties, it is generally limited outside of advanced research techniques such as ultrasonic back scatter, strain rate analysis, or contrast-enhanced power modulation for perfusion imaging ( Figure 17.2 ) [ ] (see Chapter 2 ).
17.3
Cardiovascular magnetic resonance
Whilst most cardiac masses are first detected by echocardiography, patients commonly undergo further advanced cross-sectional imaging with either CMR or CCT to characterise the lesion and inform management [ , , , ]. In this context, CMR is particularly attractive because it offers a multi-plane assessment, high spatial resolution, and an unrestricted field of view, without the use of ionising radiation [ ]. This usually allows a definitive anatomical assessment of lesion size, location, functional impact, and relationship to other cardiac structures, which is vital for any proposed surgical intervention or biopsy. Furthermore, CMR has the unique ability to characterise the tissue composition of a mass based on differing signal patterns with T1- and T2-weighted techniques according to relative water and fat content of the tissue [ , , ]. Neoplastic cells tend to be larger than normal cells and contain more free intracellular water; in addition, they are usually associated with an inflammatory reaction and more interstitial fluid. As a result, malignant tissue has higher free water content than normal tissue and thus longer T1/T2 relaxation times, creating an inherent signal intensity difference between tumours and normal tissue [ , ]. Differences between the individual T1 and T2 signal patterns which depend on the exact tissue composition are exploited for further tissue characterisation. With contrast-enhanced pulse sequences, additional tissue properties such as vascularity and fibrosis can also be demonstrated [ ] ( Table 17.2 ).
| Cardiac mass | T1-w imaging a | T2-w imaging a | Post-contrast (LGE) |
|---|---|---|---|
| Pseudotumours | |||
| Thrombus | Low (high if recent) | Low (high if recent) | No uptake b |
| Pericardial cyst | Low | High | No uptake |
| Benign | |||
| Myxoma | Isointense | High | Heterogeneous |
| Lipoma | High c | High c | No uptake |
| Fibroma | Isointense | Low | Hyperenhancement d |
| Rhabdomyoma | Isointense | Isointense/high | No/minimal uptake |
| Malignant | |||
| Angiosarcoma | Heterogenous | Heterogenous | Heterogeneous |
| Rhabdomyosarcoma | Isointense | Hyperintense | Homogeneous |
| Undifferentiated sarcoma | Isointense | Hyperintense | Heterogeneous/Variable |
| Lymphoma | Isointense | Isointense | No/minimal uptake |
| Metastasis e | Low | High | Heterogeneous |
a T1-w and T2-w imaging signal is given relative to myocardium.
b Best seen on early gadolinium enhancement imaging (no uptake) 2 min after contrast ( Figure 17.1 ).
c Similar to surrounding fat signal and characterized by marked suppression with fat-saturation pre-pulse.
d However, fibromas are non-enhancing on perfusion-imaging due to avascularity.
e The exception is metastatic melanoma which has a high T1-w and a low T2-w signal.
CMR tissue characterisation can be used to predict the likelihood of malignancy of a cardiac mass [ , ] ( Table 17.3 ). Hoffman et al. used a multi-parametric CMR imaging protocol to evaluate the signal properties, morphological characteristics (location, size, infiltrative nature, presence of pleural/pericardial effusions) and contrast enhancement of cardiac tumours in 55 patients [ ]. An overall interpretation of the CMR imaging features was found to have a diagnostic accuracy of 0.92 (area under the curve) for predicting the histological malignancy of a cardiac mass.
| Tumour location and morphology |
| Large size – especially if > 5 cm |
| Irregular, ill-defined borders |
| Direct invasion through tissue planes |
| Most cardiac tumours involving the right heart are suspicious for malignancy |
| Pericardial or pleural involvement – effusions and nodular masses |
| Multiple lesions |
| Tissue characterisation with CMR – features suggestive of malignancy |
| Tissue heterogeneity on T1-w and T2-w imaging (haemorrhage and necrosis within mass) |
| Haemorrhagic pericardial effusion (high T1-w signal) |
| Contrast enhancement |
| A high T1-w with low T2-w signal is suggestive of metastatic malignant melanoma |
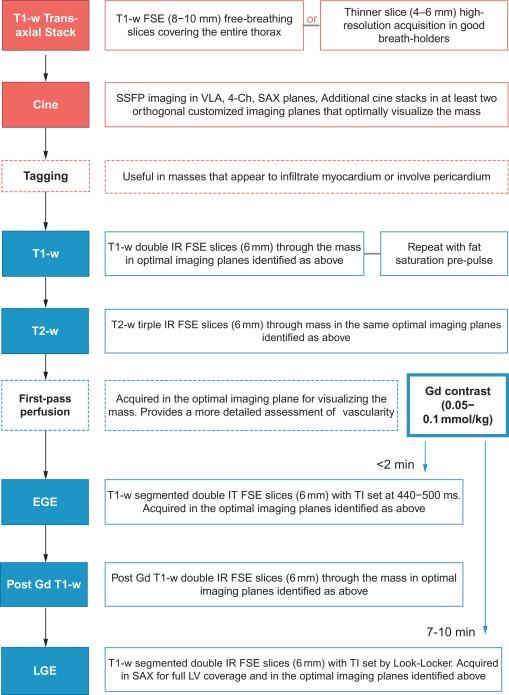
In general, lesions are identified and localised with a black-blood (BB) T1-weighted (T1w) transaxial stack covering the entire thorax, and then further examined with cine imaging in multiple planes for morphology and functional consequences such as contractile impairment or obstruction to flow [ ] ( Figure 17.3 ). Myocardial tissue tagging (see Chapter 6 ) can sometimes be useful to detect more subtle regions of contractile dysfunction due to tissue infiltration ( Figure 17.3 ) or for assessing pericardial involvement. Further tissue characterisation is then possible with a number of different pulse sequence acquisitions as described below.
In recognition of its diagnostic capabilities, several consensus statements now position CMR imaging as the primary imaging technique in the work-up of cardiac tumours [ , ]. More realistically, the conjugate use of echocardiography and CMR provides a pathway for rapid initial diagnosis (TTE or TOE), subsequent detailed assessment (CMR), and the option of surveillance with either modality.
17.4
Cardiac computed tomography
Where echocardiography alone has not been sufficient to fully assess a mass, or where CMR is not available or is contraindicated, CCT is a commonly used second-line diagnostic modality [ , ]. In addition, incidental findings of cardiac masses are becoming more common as CCT is increasingly used to evaluate coronary artery disease [ , ]. Several technological advances in computed tomography (CT) including sub-millimetre detector arrays, increased rows of detectors, half-scan post-processing algorithms, and ECG synchronisation have resulted in improved imaging of cardiac structures [ , ] (see Chapter 5 ).
Although less versatile than CMR, CCT is able to provide some degree of tissue characterisation, discriminating fat, soft tissues and calcium particularly well. Although dynamic perfusion is possible it is rarely done since – even with dose restraints applied – the return of information is often marginal compared to the higher radiation dose required. However, tumour vascularity can be assessed indirectly by acquiring a low-dose set of images up to 5 min after contrast injection. This technique of ‘late iodine enhancement’, which has been demonstrated for ischaemic scar is analogous in principal to the late gadolinium enhancement technique in CMR, although the contrast-to-noise ratio is substantially lower in CCT because of an inability to null remote normal myocardium [ ].
One benefit of CCT over both echocardiography and CMR is its flexibility. A rapid acquisition in 10 s or less not only minimises the problems associated with scanning unstable or uncooperative patients for more prolonged periods, but also provides a large field of view 3D data set which may be post-processed at leisure in order to assess the mass in any plane desired. This can be extremely useful with more diffuse or infiltrating mass lesions, in communicating the extent of the lesion to surgical colleagues. If CT coronary angiography is performed as part of the scanning protocol, it can also provide information on concomittant coronary artery disease which may be important if surgical removal of the cardiac mass is considered. Finally, the ability to interrogate the lungs and bones by CCT allows for assessment of metastatic spread or indeed identification of the primary malignancy if the cardiac mass is a secondary metastasis.
17.5
Nuclear imaging techniques
Nuclear imaging techniques have traditionally held a rather restricted role in the imaging of intra-cardiac masses. High radiation doses and limited spatial resolution are the major disadvantages, whilst lack of availability of machinery and radiotracers continue to hamper the development of positron emission tomography (PET) as a diagnostic tool in many countries (see Chapters 3 and 4 ). Single-photon emission computed tomography (SPECT) is occasionally used in the investigation of carcinoid tumours, with the tracer octreotide showing avidity for both the primary tumour and even relatively small metastases, but there is no other significant role of SPECT in the diagnostic work up of a cardiac mass.
PET with 18 F-fluorodexyglucose (18 F-FDG) is considered the gold standard technique for assessing staging and evaluating metabolic response to therapy for a large variety of systemic malignancies (including extracardiac primaries with cardiac metastases). 18 F-FDG uptake can be quantified using standardised uptake values (SUV), which represent the ratio of mean tissue radioactivity concentration in a given region of interest (in MBq/kg = kBq/g) over injected dose (MBq) per body weight (kg).
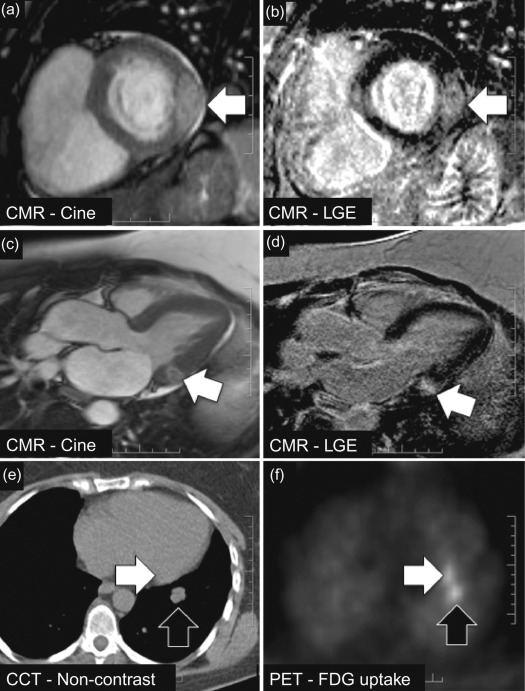
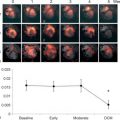
Generally, PET signal is fused with anatomical information from CT (using a PET/CT hybrid scanner) to co-localise 18 F-FDG signal with anatomical structures. In primary cardiac tumours, however, the evidence of PET/CT is limited to small series in which metabolic activity of large cardiac masses can be assessed and used to distinguish between malignant and benign and to detect extracardiac manifestations [ ]. Rahbar and colleagues analysed 18 F-FDG PET/CT scans (whole-body imaging with low-dose CT) in 24 consecutive patients with newly diagnosed cardiac tumours (7 benign, 17 malignant [8 primary, 9 metastases]) and measured the maximum standardised uptake values (SUV max ) in each tumour [ ]. Mean SUV max was 2.8 ± 0.6 in benign cardiac tumours and significantly higher in both primary and secondary malignant cardiac tumours (8.0 ± 2.1 and 10.8 ± 4.9, P < 0.01). Malignancy was determined with a sensitivity of 100% and specificity of 86% (accuracy, 96%) using a cut-off SUV max value of 3.5. In addition, extra-cardiac tumour manifestations were detected in four patients by whole-body 18 F-FDG PET/CT. These findings suggest that quantification of 18 F-FDG uptake with PET/CT may support the non-invasive, pre-treatment differentiation between benign and malignant cardiac tumours and be helpful in detecting metastases of malignant cardiac tumours ( Figure 17.4 ).
A limitation of 18 F-FDG PET is the high and often inhomogeneous baseline myocardial 18 F-FDG uptake which may obscure weak pathological uptake from malignancy. Very recently, several vendors have developed integrated PET/MR scanners which might be expected to provide additional benefit in terms of cardiac mass characterisation over PET alone ( Chapter 4 ). The validity of this approach is currently untested, however.
17.6
Cardiac masses
17.6.1
Pseudotumours
17.6.1.1
Thrombus
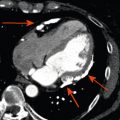
Thrombus is one of the commonest causes of an intra-cardiac mass and is a frequent differential diagnosis for suspected cardiac tumours. Thrombus is typically found in the left atrium (LA) or atrial appendage in association with atrial fibrillation or mitral valve disease, or in a severely dysfunctional left ventricle following MI ( Figure 17.5 ). Right-sided thrombi are sometimes seen in association with veno-thromboembolism, and more rarely, thrombi can be found in any cardiac chamber due to systemic conditions such as Churg-Strauss syndrome ( Figure 17.5 ).
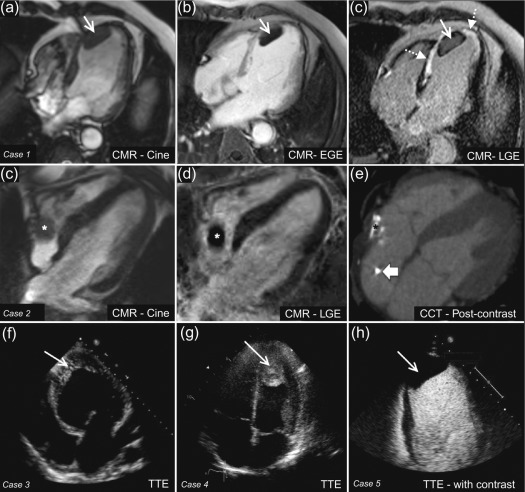
It can be difficult to reliably distinguish thrombus from tumour with echocardiography alone as the imaging appearance can vary. In particular, thrombi show a different echodensity depending on their age and degree of thrombus organisation ( Figure 17.5 ). Often, it is the presence of risk factors for thrombus formation, such as adjacent regional wall motion abnormalities, chamber dilatation, or slow flow with spontaneous echo-contrast that allows some differentiation from cardiac tumours. With regards to thrombus in the LA or left atrial appendage (LAA), this is best assessed by TOE in order to achieve the optimal imaging plane. Atrial fibrillation, LA dilatation, low filling/emptying velocities (< 40 cm/s with pulsed wave Doppler placed 1 cm into the LAA), and smoke-like spontaneous contrast due to sludging of red blood cells are all associated with an increased risk of atrial thrombus. With regards to LV thrombus detection, TTE provides high sensitivity (95%) and specificity (85–90%), provided the thoracic anatomy of the patient allows sufficient visualisation [ , ]. However, in reality, the LV apex is frequently poorly defined, leading to an estimated 10–46% of echocardiograms that are inconclusive [ ]. Although the use of intravenous echocardiography contrast during TTE improves the diagnostic assessment of LV thrombus, non-protruding and small mural LV thrombi may still go undetected [ ] ( Figure 17.5 ). A tangentially cut or foreshortened LV can also lead to a false positive study; therefore, it is important to vary the depth of field settings and to acquire images in multiple views. Additionally, care must be taken to exclude false tendons and trabeculae and to rule out artefacts (reverberations, side lobe or near field artefacts), which constitute the most common cause for a false diagnosis with echocardiography [ ].
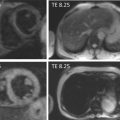
CMR features also vary depending on the age of a thrombus and its state of degradation or organisation, but in a more predictable fashion than with echocardiography. An acute thrombus can have high or intermediate signal intensity on both T1- and T2-weighted images depending on how much of the haemoglobin content remains in the oxygenated state. In sub-acute thrombus, the haemoglobin has been metabolised to methaemoglobin, which has a different paramagnetic effect leading to a higher T1-weighted signal intensity and lower T2-weighted signal intensity ( Table 17.4 ) [ ]. Over time, a chronic organised thrombus becomes heavily water-depleted and therefore has low signal intensity on both T1- and T2-weighted images ( Table 17.2 ). Contrast-enhanced CMR with first pass perfusion, EGE, or LGE imaging reliably differentiates thrombus from surrounding myocardium because thrombus is avascular and hence characterised by an absence of contrast uptake; rarely, very chronic, organised thrombus may enhance peripherally due to its fibrous content [ ].
| Age of thrombus | T1-w Signal | T2-w Signal | EGE imaging | LGE imaging |
|---|---|---|---|---|
| Acute | High | High | No uptake | No uptake |
| Subacute | High | Low | No uptake | No uptake |
| Chronic | Low | Low | No uptake | No uptake a |
Related posts:
Stay updated, free articles. Join our Telegram channel

Full access? Get Clinical Tree


