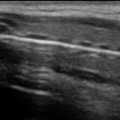
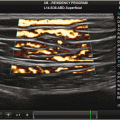
Fig. 3.1
Parasternal long axis (PLA) in cardiac and abdominal imaging. The image on the left is the PLA in cardiac presets, and the image on the right is in abdominal presets. AV, aortic valve; LV, left ventricle. The P icon at the top of the image corresponds to probe orientation. Note the orientation of the heart is opposite with the AV on the right in cardiac imaging and on the left with abdominal imaging
At our center, and most centers that do dedicated cardiac point-of-care US , the orientation is cardiac (probe grove displayed on the right of the screen) to maintain consistency with a standard echocardiogram. When performing a cardiac ultrasound in abdominal presets, standard TTE orientation can obtained by simply rotating the probe 180°. For the remainder of this chapter the images will be displayed and discussed in standard cardiac orientation. Keep in mind that some centers that do primarily abdominal imaging use the abdominal convention with the grove displayed on the left.
Modalities in Cardiac Imaging
2D/B-mode: The terms 2D and B-mode are interchangeable. They describe standard 2D imaging that assigns a pixel value, or brightness value hence B-mode, to the amplitude of the return signal. In general systems and individuals primarily trained in abdominal imaging use the term B-mode, whereas those from a cardiac background use the term 2D. The 2D image is created by intermittently firing the crystals that send and receive the US signal across the field, thus sweeping it across the object. The difficulty is in measuring rapid movement, because high sweep speeds involve sending less scan lines and the still image will appear blurry (as discussed above).
M-mode: In distinction motion-mode or M-mode uses one crystal to continually send and receive the signal, so there is no sweep speed. It can be thought of as an ice-pick view through a 2D image. M-mode is ideal for precisely measuring motion of an object (Fig. 3.2).
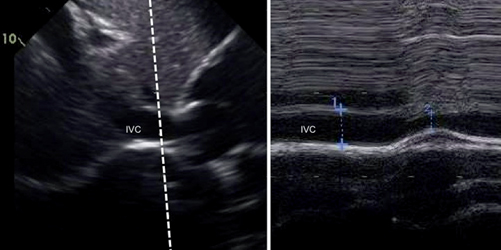
Fig. 3.2
M-mode of the inferior vena cava (IVC). The image on the left is a 2D depiction of the liver at the IVC, and the image on the right is the M-mode or icepick view of the IVC. The dotted line is the cursor showing the plane through which the M-mode image is taken. The variation in the IVC seen in the M-mode is respiratory variation
Doppler Ultrasound: Whereas both 2D and M-mode measure amplitude of the return signal; Doppler ultrasound measures the frequency-shift (also called Doppler shift) of the return signal created by impact with a moving object. Objects moving towards the transducer will increase the frequency of the return signal, whereas those moving away will decrease it. The velocity of the movement determines the magnitude of the shift.
There are two different ways of sending/receiving the signal; pulsed-wave (PW) and continuous-wave (CW) as described below. Color flow Doppler (CF) is a form of PW Doppler. In both PW and CW the Doppler shift is assigned a pixel value and displayed around a baseline, with flow towards the transducer above, and away from the transducer below the baseline. This allows for detailed assessment of flow including identification of stenotic areas. Conversely in CF the Doppler shift is assigned a color value and displayed over a 2D image, which allows for localization of flow.
Pulsed-wave Doppler (PW): As the name implies in PW the ultrasound signal is pulsed. One crystal is used to send and receive the signal, thus the time the signal returns is known. In ultrasound time of signal return is how depth of an object is determined, so PW Doppler allows flow to be assessed at a specific depth, or anatomic location. PW is ideal for quantifying flow in a specific area (Fig. 3.3).The frequency of the pulse is called the pulse-repetition frequency (PRF) which is important because there is an upper limit of flow that be accurately displayed with PW determined by the Nyquist limit. If the frequency shift is greater than on-half the PRF, then the signal will alias (Fig. 3.4). As a result high flow jets will alias with PW, and flow cannot be accurately displayed.
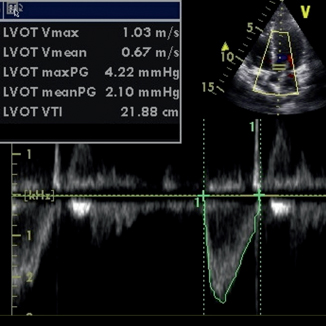
Fig. 3.3
Pulsed-wave Doppler (PWD). This image shows pulsed wave through the aortic valve. LVOT, left ventricular outflow tract; VTI, velocity time integral. The LVOT VTI is used to calculate the stroke volume and cardiac index. PWD allow assessment at a specific location, in this care at the LVOT, shown by the double hash marks on the cursor in the top right of the image
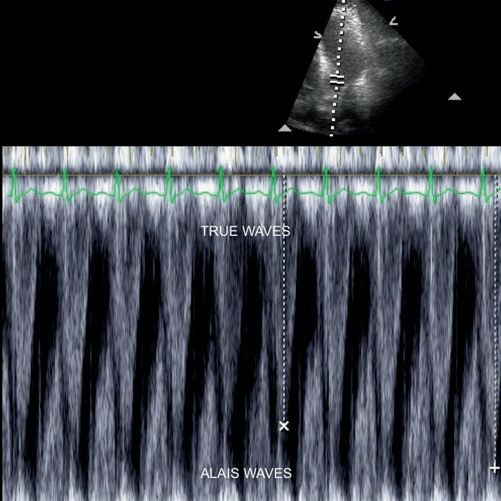
Fig. 3.4
Aliasing in pulsed-wave (PW) Doppler. Aliasing is a common artifact in PW imaging, observed with high flow jets. Aliasing can make it very difficult to perform accurate measurements
Continuous-wave Doppler (CW): CW Doppler uses two crystals, one to continually send, and one to continually receive the signal. Because the signal is continuous and not pulsed there is no PRF. As a result, the signal does not alias, which makes it ideal for assessing areas of high flow. However, because the signal is continuously received, the time it takes the signal to be sent and return cannot be determined, so flow cannot be measured at a precise depth. PW and CW can be used together to precisely locate and quantify stenosis (Fig. 3.5).
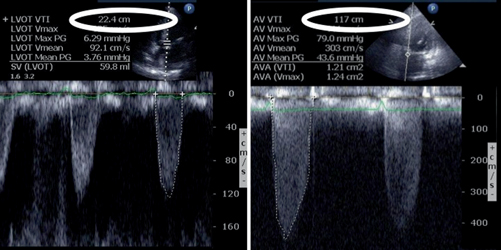
Fig. 3.5
Pulsed-wave Doppler (PWD) and continuous-wave Doppler (CWD) in aortic stenosis. PWD on the right measures at a specific point, whereas CWD measures along the entire cursor. Used in conjunction they can detect areas of stenosis. Note the much higher velocity time integral (white circle at the top of each image), with CWD. This finding indicates an area of stenosis at the aortic valve
Duplex or Color Flow (CF) Doppler: Color flow is a type of PW Doppler, as a result it will alias with high velocity flow. Color flow applies a color value to the frequency shift. By convention flow towards the transducer is red and away blue. The brightness of the pixel corresponds to flow velocity of flow. Duplex refers to displaying CF over a 2D image. This makes duplex CF Doppler ideal for localizing both normal and pathologic blood flow (Fig. 3.6).
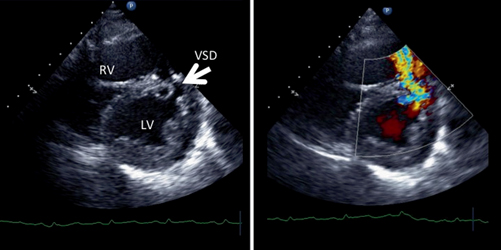
Fig. 3.6
Ventricular septal defect (VSD) with color flow Doppler (CFD). This is a short-axis view of the heart. On the left is a 2D image, and on the right is the same image with CFD applied, showing pathologic blood flow from the left ventricle to the right. RV, right ventricle; LV, left ventricle
Focused Cardiac Ultrasound
Focused cardiac imaging has become a standard of care for diagnostic imaging in the emergency room, the intensive care unit , and any clinical scenario requiring assessment of the heart and great vessels [2, 6]. There is currently a concept of the ultrasound stethoscope and sonography replacing the physical exam. The intention of the ultrasound should not be used to replace clinical decision making or physical exam of the patient, but should instead be seen as a useful adjunct to evaluation of the critically ill patient. It also has the added benefits of avoiding ionizing radiation, providing real time diagnostic information, allows findings to be directly correlated with the patients signs and symptoms, and is repeatable, allowing the clinician to follow a clinical course or track an intervention.
History
Traditionally, ultrasound of the heart was the sole domain of the cardiologist. As a community, cardiologists have been resistant to accept a non–cardiologist-performed echo for fear of false information being obtained, and patients subsequently suffering from misdiagnosis or misguided interventions. This is reflected in the early American Society of Echocardiography guidelines from 1999 [8]. In this policy statement there is a clear concern that even simple conditions, like cardiac tamponade, may be misdiagnosed or misinterpreted by non-cardiologist sonographers. In their summary statements, it is recommended that all emergency departments collaborate with more experienced echo providers and that systems be established to limit gaps in coverage by a trained sonographer. In the situation of a life-threatening condition like tamponade, if the sonographer was not immediately available, they hesitantly supported the concept of a lesser trained physician acquiring and interpreting initial images with subsequent review by a sonographer as soon as possible.
In 2010 a combined statement between the American Society of Echo and the American College of Emergency Physicians describe a much more collaborative approach. In this statement it is suggested that the term focused cardiac ultrasound (FOCUS) be used to describe point-of-care evaluations , allowing differentiation between a comprehensive TTE, performed by a cardiologist, a limited echo (performed by a cardiologist but without all images obtained) and FOCUS performed by a non-cardiologist [9]. They state that the goal of focused sonography in symptomatic emergency patient is limited. Specifically, the focused exam, per their guidelines, should be used in assessing for cardiac tamponade or effusion, global left and right heart function, and an intravascular volume. In the cases of effusion or tamponade, ultrasound can be also used for guidance of pericardiocentesis.
Flash forward to 2013 and the most recent policy statements of the American Society of Echo, where clearly a softer attitude towards FOCUS exists [10]. With the proper definitions of comprehensive echo, limited echo, and focused ultrasound having been delineated, the American Society of Echo seems to have accepted the role of FOCUS as an adjunct to the physical exam in the emergency setting, off hours, or when formal echo is not available. These guidelines state that focused cardiac ultrasound should be used only for specific situations and answering specific questions, with the intent that follow up formal echo will be performed to confirm findings as well as identify associated findings that would likely go unrecognized by the focused exam.
There are a variety of important applications of FOCUS , and there is substantial emergency medicine literature supporting its use in bedside decision making, even without confirmatory imaging by a cardiologist [2, 11]. For example independent assessment of the heart in the setting of blunt and penetrating trauma has been the standard of care since the introduction of the FAST exam in the 1990s [12]. The subxyphoid view of the heart for pericardial fluid is an integral part of the initial assessment in trauma patients. Furthermore the presence or absence of cardiac findings on this exam decreases time to diagnosis, treatment, and has been shown to improve mortality [13, 14].
In addition cardiac ultrasound commonly used during ACLS as it can be used to differentiate between PEA, asystole, and profound hypotension [15, 16]. Furthermore, FOCUS in conjunction with other ultrasound imaging can be used in identifying a pulmonary embolus, pneumothorax, or tamponade as treatable causes of the arrest. Also, the presence or absence of cardiac activity on this exam decreases time to diagnosis, treatment, and has been shown to improve mortality [13, 14].
Follow-up formal echocardiography is indicated at the treating physician’s discretion. The underlying points of the American Society of Echo’s recommendations are well taken, but more often than not action is required before confirmatory testing can be obtained. In addition cardiologists are trained in echo for a specific application; to evaluate the heart. But many of the applications of echocardiography in the ICU and emergency department employ it as a tool to guide resuscitation. It is more about optimizing end organ perfusion, or determining the cause of shock, than it is about managing heart failure or diagnosing valvular dysfunction. Often it involves imaging other organs, and a knowledge base in resuscitation in addition to an understanding of cardiac physiology. A new form of echo has evolved, and it is possible that cardiologists are not the best trained at interpreting it simply because they initially developed the field. Ideally cardiologists, emergency medicine physicians, intensivists, and surgeons would share resources and work for the common good of the patients, but when that is not the case, patients’ needs and advancing medicine trump territoriality.
Standard Views
There is a spectrum in the complexity of focused cardiac ultrasound, from answering simple binary questions, to some objective flow and volume measurements, to exams that rival formal echo [4, 11, 17]. Regardless, the technical approach to the cardiac exam is essentially unchanged (Fig. 3.7). It is often necessary to look ‘through’ the ribs, and for this reason a phased array or small footprint probe is best. In addition, the best fidelity imaging will be obtained on a cardiac quality machine, with a full service cardiac software package. If this is not available, it is still possible to obtain images and evaluate basic cardiac function, with any low frequency transducer.
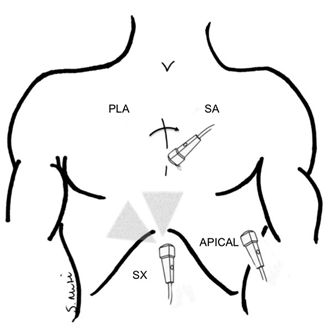

Fig. 3.7
Four views of a TTE. Depicted are the four standard views of a TTE: the posterior long-axis (PLA), posterior short-axis (SA), apical and sub-xiphoid (SX) windows
1.
Parasternal long axis (PLA)
2.
Parasternal short axis (PSA)
3.
Apical 4- or 5-chamber view (AP 4-chamber, AP 5-chamber)
4.
Subxiphoid or subcostal view (SX)
The parasternal long axis (PLA) view is obtained with the patient supine or in a slight left lateral position to improve image acquisition. The transducer is placed on the chest, just left of the sternum at the 3rd or 4th intercostal space. It is oriented towards the right mid-clavicular line, and can be moved up or down with the goal of bisecting the left ventricle on its long axis. The heart is often lower and more medial in intubated patients (Fig. 3.8) With this view, one can see the left ventricle, the mitral and aortic valves in cross section, and some of the right ventricle. It is easy in this view to assess the contractility of the left heart, and to assess for effusions, both pericardial and pleural (Fig. 3.9).
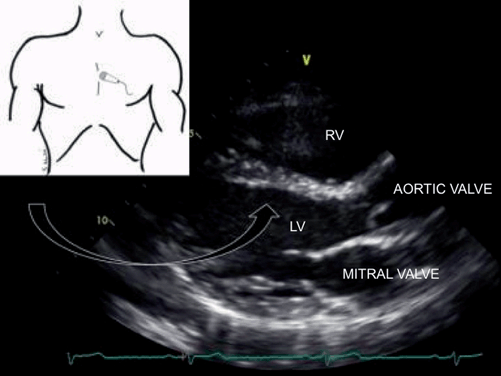
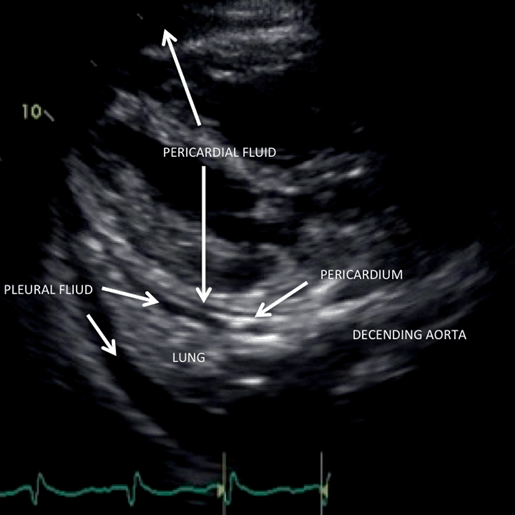

Fig. 3.8
Parasternal long-axis (PLA) view. The PLA view is obtained by placing the transducer to the left of the sternum, with the groove pointed toward the right mid-clavicular line. Because the transducer groove is oriented to the right of the screen, the aortic valve appears on the right. LV, left ventricle; RV, right ventricle

Fig. 3.9
Parasternal long-axis (PLA) view showing pleural and pericardial effusions. In this patient both pericardial and pleural effusions can be seen. The pericardial effusions are around the heart, within the pericardium. The pleural effusions surround the lung below the pericardium. Pericardial effusions are anterior to the descending aorta, whereas pleural effusions are posterior
The short-axis window (SA), is obtained after the PLA, by rotating the probe 90° clockwise to bisect the left mid-clavicular line. The SA provides a cross-sectional view across the left ventricle. The probe can be swept along the heart to obtain views through the aortic valve, mitral valve, papillary muscles, and apex of the heart (Fig. 3.10). The SA is excellent for evaluating ejection fraction (EF), as well as right heart function. With right heart failure, one will see a large right heart, and D-shape of the left heart with diastole (Fig. 3.11). Ejection fraction (EF) can by quantified in both the PLA and SA, but is best assessed after viewing all four windows. Both the PLA and SA can be obtained in greater than 90 % of patients [18], and the EF can be assessed in > 90 % as well [4].
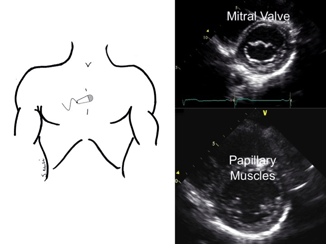
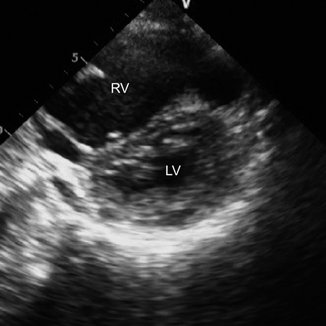

Fig. 3.10
Short-axis (SA) view. The SA view is obtained by rotating the transducer 90° from the PLA so that the groove is now bisecting the left clavicle. The transducer can then be rocked-up to see the aortic valve (not visualized), the mitral valve (seen on the top right) and the papillary muscles

Fig. 3.11
Short-axis (SA) view showing RV dysfunction. In this patient the right ventricle (RV) is pressure volume overloaded, showing classic D-shaped compression of the left ventricle
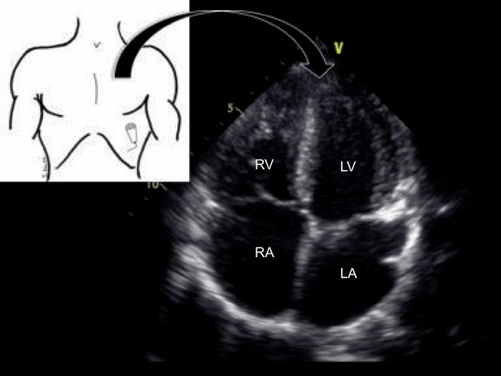
The apical (AP) view is obtained by placing the transducer near the apex of the heart, usually located a few centimeters below the nipple between the left mid-clavicular and anterior axillary lines. The grove is rotating about 45° clockwise from the SA, and aimed towards the bed. Turning the patient with the right side up can sometimes bring the heart closer to the chest wall making it easier to see. The maneuver is not as effective in mechanically ventilated patients, but it can be helpful in extubated patients The AP window gives a view that bisects the heart in an anterior-posterior orientation. The AP 4-chamber is usually the first view allows excellent visualization of the right atrium (RA), RV, left atrium and LV, then by rocking the transducer head anteriorly the 5-chamber view is obtained. The 5-chamber view allows visualization of the left ventricular outflow tract to the aorta (Fig. 3.12). This view is important for assessing for aortic stenosis, in conjunction with the PLA. It is also essential in calculating the stroke volume (SV) and cardiac index (CI) [4]. The apical windows are ideal views for assessment EF, right heart function, and get a global assessment of right heart size. Normally, the RV is 60 % the volume of the LV [18]. If this ratio is higher, or the right heart is larger than the left, and implies right heart overload or failure, although this may be different in mechanically ventilated patients. We have found in the majority of ventilated the RV appears equal to or slightly larger than the LV although the function appears normal. The apical windows are also essential in obtaining the measurements described in below in the hemodynamic echocardiography section below.

