Myocardial Oxygenation: Supply Versus Demand
Under physiologic conditions, myocardial blood flow (MBF), myocardial oxygen consumption (MVO 2 ), and myocardial mechanics are intimately related. Therefore it is not surprising that the key disease processes involving the heart manifest from imbalances between myocardial oxygen supply and demand. Consequently, the noninvasive assessment of imbalances in myocardial oxygen supply and demand, particularly on a regional basis, is of critical importance in both clinical cardiology and for cardiovascular research. The noninvasive quantification of MVO 2 was not possible until it was shown that positron emission tomography (PET), using 11 C-acetate, permits accurate quantification of MVO 2 . Using this approach, numerous studies have demonstrated the salutary effects of restoring nutritive perfusion on MVO 2 and cardiac function and the importance of preserving MVO 2 as a descriptor and probable determinant of myocardial viability in both acute and chronic ischemic disease. However, PET studies are limited by relatively poor spatial resolution, limited availability mainly due to short-life radiotracers, and potentially harmful ionizing radiation, especially when repeated examinations are needed.
Magnetic resonance imaging (MRI) has become an important clinical imaging modality because it is noninvasive, does not require iodinated contrast media or ionizing radiation, and is widely available. MRI can also provide structural and functional information as well as report on several important biomarkers in the same setting. To date, multiple cardiovascular magnetic resonance (CMR) applications have been developed, including anatomic imaging of the heart and great vessels, coronary artery imaging, methods to characterize myocardial infarction with or without gadolinium (Gd) contrast media, methods for characterizing extracellular space, methods for evaluating myocardial wall motion, and first-pass perfusion (FPP) for the identification of perfusion defects in the myocardium. Over the past two decades, efforts have also been made to use CMR to determine regional myocardial blood oxygenation levels. The blood oxygenation state of the myocardium reflects the combined effects of MBF and oxygen extraction (which together reflect MVO 2 ). Thus a change in myocardial blood oxygenation secondary to imbalances in oxygen supply and demand would be useful in evaluating disease processes such as coronary artery disease (CAD) or microvascular disease (MVD), which can lead to impaired myocardial perfusion reserve. Noninvasive assessment of myocardial venous blood oxygenation may permit the measurement of oxygen extraction. When coupled with flow, these data would allow for measurement of MVO 2 . Anatomic, functional, and metabolic information can then be obtained in a single CMR study, thereby providing a comprehensive examination for the diagnosis of ischemic heart disease and the evaluation of therapies for improving the balance between MBF and oxygen demand.
If we assume that the blood oxygen saturation of hemoglobin in the arterial blood is 100% and is Y in the venous pool, then the MVO 2 can be estimated to first order by Fick’s law as
MVO2=F×Hct×(1−Y)
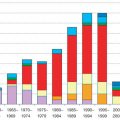
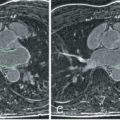
Furthermore knowledge of myocardial venous blood oxygenation can permit noninvasive evaluation of myocardial perfusion reserve, defined as the ratio between the peak myocardial perfusion rate at maximum vasodilation and rest. Under pharmacologic vasodilation, such as that in response to dipyridamole or adenosine, normal coronary blood flow increases several fold, whereas the oxygen consumption remains relatively unaltered, leading to an increase in myocardial venous blood oxygen saturation. However, with progressive coronary lumen narrowing or with microvascular dysfunction, the maximal increase in MBF under vasodilatory stress is blunted proportionately relative to the healthy myocardium. This is illustrated in the case of CAD in Fig. 8.1 . Such perfusion abnormalities lead to regional differences in myocardial venous blood oxygenation, allowing for the assessment of the functional significance of CAD. Extensive clinical support now exists for imaging myocardial perfusion research with CMR using Gd-based contrast agents (GBCAs). However, it is contraindicated in severe chronic kidney disease (CKD, stage 4 or 5). According to the National Institutes of Health (NIH) and the United States Renal Data System (USRDS), the prevalence and the cost of treating new cases of CKD has more than doubled in the past 10 years and this trend is predicted to grow given the increasing prevalence of diabetes and its contribution to the development of CKD. Moreover, recent imaging/autopsy studies from Italy, the United States, and Japan have shown that even in patients with normal kidney function, there are retained Gd deposits in the brain—a finding that is contrary to the widely held belief that Gd is fully cleared from the body within hours of infusion. These observations are central to the growing interest and emphasis on non–Gd-based approaches for studying myocardial perfusion, particularly based on changes in blood oxygenation, in all subjects suspected of having ischemic heart disease.

In this chapter, we provide an overview of the basic biophysical concepts that allow for the assessment of myocardial changes in blood oxygenation. We then summarize the preclinical and clinical literature to date in the assessment of myocardial oxygenation. This is followed by growing literature on image-processing methods that have the capacity to enable accurate visualization and quantification of blood-oxygen-level-dependent (BOLD) signal changes in the myocardium. Finally, we review the emerging methods that show promising evidence into how BOLD CMR can become a reliable tool for examining ischemic heart disease in the clinical arena and conclude with a brief outlook on the future of myocardial BOLD CMR.
Biophysics of Myocardial BOLD Contrast
Blood is a magnetically inhomogeneous medium in which the magnetic susceptibility of red blood cells is strongly dependent on the blood oxygen saturation (%O 2 ), defined as the percentage of hemoglobin that is oxygenated. Because the susceptibility of blood plasma is generally invariant, the cooperative binding of oxygen to the heme molecules within the red blood cells results in a detectable susceptibility difference between plasma and the red blood cells. This susceptibility variation gives rise to local magnetic field inhomogeneities, resulting in local frequency variations that lead changes in T2* and apparent T2 of whole blood. This observation has allowed for the acquisition of oxygen-sensitive images permitting the discrimination between arteries and veins. Its utility for detecting chronic mesenteric ischemia and the identification and quantification of cardiac shunts associated with congenital abnormalities have also been demonstrated.
An extension of this phenomenon into the microcirculation opened the door for assessing myocardial oxygenation changes. In the myocardium, nearly 90% of the blood volume is within the capillaries ; accordingly, our discussions will be limited to capillary beds. A change in blood oxygenation in the capillary bed leads to changes in magnetic field variations between the red blood cells and plasma and between the intravascular and extravascular spaces. Following the excitation of the magnetization onto the transverse plane, these field variations cause the spins to lose coherence, leading to a decay of the magnetic resonance (MR) signal. In particular, the severity of the field variation due to changes in blood oxygen saturation directly determines the rate of loss of the spin coherence (MR signal). This phenomenon, referred to as the BOLD effect, implies that when the capillaries contain deoxygenated blood, with all else remaining the same, the MR signal associated with the deoxygenated state (rest) will be lower than that of the hyperemic state (vasodilation) when the capillary oxygenation is substantially higher (~30% [resting] vs. ~80% [hyperemic]). This allows for detecting regional myocardial oxygen differences as regions of signal loss with imaging sequences sensitive to local field inhomogeneities. In addition, the sensitivity of the MR signal to the BOLD effect is dependent on the blood volume, hematocrit, and choice of pulse sequences used. Both gradient and spin echo sequences as well as balanced steady-state free precession (bSSFP) methods have been used to probe these effects.
BOLD effect was first demonstrated in the brain, before being adopted for cardiac applications. However, there are important biophysical differences between BOLD CMR of the heart and brain. Specifically, the heart has a larger blood volume fraction than the brain (~10% vs. ~4%) and the venous blood oxygen saturation in the heart is approximately 30%, compared with approximately 60% in the brain. This allows for a wider range of signal change with vasodilator-induced flow in the myocardium compared with the brain, which provides greater BOLD sensitivity in the heart. However, in contrast to brain imaging, the challenge for myocardial BOLD CMR has been imaging artifacts from motion (cardiac, respiratory, and pulsatile blood flow), as well as bulk susceptibility shifts between heart and lung interface.
Vasodilators in the Assessment of Myocardial Oxygenation
Common Pharmacologic Vasodilators
Presently, vasodilators appear to be essential for assessing myocardial blood oxygenation, especially in the context of ischemic heart disease. Their importance was first demonstrated in human subjects with multigradient echo methods using two different pharmacologic stress agents: dipyridamole and dobutamine. Both agents induce hyperemia, but with different effects on myocardial venous blood oxygenation. Dipyridamole is a potent coronary vasodilator that typically induces a 3- to 4-fold increase in MBF with minimal effect on MVO 2 . Consequently, myocardial venous blood oxygen saturation increases as oxygen supply (blood flow) exceeds demand (oxygen consumption). In contrast, dobutamine is a potent beta-agonist with a primary pharmacologic effect to increase cardiac work. This results in a concomitant increase in MVO 2 , which triggers an increase in MBF. Thus oxygen supply and demand remain largely balanced, and there is little to no change in myocardial venous blood oxygen saturation.
Vasodilators have also facilitated direct demonstration of the in vivo correlation between BOLD CMR response (via changes in R2* [or 1/T2*]) and venous blood oxygen saturation. In a well-controlled canine model, a wide range of global myocardial venous blood oxygen saturation levels were created. Hyperemic conditions were induced by the intravenous administration of dipyridamole and dobutamine. To induce hypoxemia, the oxygen content of the inspired gas was reduced by ventilating dogs with a mixture of 10% oxygen and 90% nitrogen, which reduced the oxygen saturation in both arteries and veins. To correlate myocardial R2* with global venous blood oxygenation, venous blood oxygen saturation levels were measured directly by coronary sinus sampling. MBF was quantified invasively by the administration of radiolabeled microspheres. Measurements of myocardial R2* were obtained at baseline, during and after infusion of dipyridamole and dobutamine, and when the dogs were ventilated with hypoxic air. Paired arterial and coronary sinus blood samples were withdrawn at the six different stages of the study. Blood oxygen saturation levels were measured by using a blood gas analyzer interfaced with an oximeter. Coronary sinus blood oxygen saturation levels ranged from 9% to 80% with experimental interventions with dipyridamole, dobutamine, or hypoxic air. Administration of dipyridamole and dobutamine and ventilation of hypoxic air all increased MBF significantly, but significant decrease in myocardial R2* was observed only with dipyridamole infusion, which indicates that myocardial R2* is a reflection of MBF only when myocardial oxygenation demand is not significantly altered between rest and hyperemia. The relationship between the changes of myocardial R2* from baseline and the %O 2 in the coronary sinus showed a linear regression ( r = 0.84), indicating a strong correlation between myocardial R2* and %O 2 in the coronary sinus.
These studies also showed that both dipyridamole and hypoxic air increased myocardial blood volume (MBV) fraction in excess of 50%. However, their effects on R2* are manifested differently. With administration of dipyridamole, %O 2 in coronary sinus increases, which leads to a decrease in R2*. However, the blood volume fraction in the myocardium also increases, which increases the hematocrit content of a voxel, which tends to increase myocardial R2*; this is the opposite of the effect of increased oxygen saturation. Because a decrease in myocardial R2* was observed in these studies, increased oxygen saturation clearly has the dominant effect over increased blood volume, but the apparent R2* change as a function of %O 2 is reduced because of the accompanied blood volume effect. In contrast, during hypoxia, both %O 2 in coronary sinus and the blood volume fraction increase, and their effects enhance each other. As a result, the apparent change in R2* as a function of %O 2 is greater than that if blood volume fraction remained the same. These studies showed that by measuring MBV fraction changes using technetium-99m-labeled ( 99m Tc-labeled) red blood cells at each of the interventions and correcting their effects on myocardial R2*, a more linear relationship was found between R2* and the blood oxygen saturation. Thus an accurate assessment of myocardial oxygen saturation using CMR will probably require a correction for blood volume.
Hypercapnia as a New Potent Coronary Vasodilator
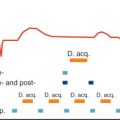
It has long been known that carbon dioxide (CO 2 ) may act as a vasodilator in the heart, but its sensitivity to impart sufficient coronary vasodilation to assess regional changes in MBF has not been clear. Recent studies, enabled by prospective gas control allowing for rapid and independent control of arterial CO 2 and O 2 , have made it possible to directly relate the influence of arterial CO 2 on coronary vasodilation. The use of targeted increases in arterial CO 2 to vasodilate the coronary arteries and invoke changes in myocardial oxygenation and its relation to adenosine in the preclinical models and healthy human subjects has been demonstrated ( Fig. 8.2 ). However, its utility to assess changes in myocardial oxygenation in patients with ischemic/nonischemic heart disease has not been demonstrated.

An alternate approach for modulating PaCO 2 is through breathing maneuvers, where a subject is asked to hyperventilate, typically for 30 seconds, and then suspend breathing during imaging to invoke a hyperemic response. The combined hyperventilation/suspension of breathing is expected to provide a significant change in PaCO 2 to invoke a hyperemic blood flow response in the heart. To date, the value of this approach in modulating the BOLD CMR response has been demonstrated in healthy human subjects. Comparative studies between this approach and prospective gas control methods to probe myocardial oxygenation changes in response to hypercapnia are yet to be conducted.
Myocardial BOLD CMR: Preclinical Studies
T2*- and T2-Prepared Methods
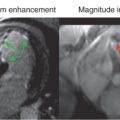
To date, a number of isolated heart and animal studies have demonstrated that vasodilator interventions that alter the blood oxygenation levels result in BOLD signal changes. One of the first studies to demonstrate the feasibility of assessing myocardial oxygenation on the basis of the BOLD effect was performed in a rat model. This study showed significant signal loss in both the left ventricular chamber and the myocardium during apnea. A subsequent study in an isolated rabbit heart model confirmed a substantial correlation between the gradient echo image intensity of the myocardium and deoxyhemoglobin concentration levels. In large animal models, gradient echo myocardial signal enhanced significantly after the infusion of dipyridamole, presumably because of an increase in MBF in the absence of a corresponding increase in oxygen demand, resulting in a decrease in myocardial venous blood oxygen saturation. Several studies have now independently validated these studies in large animal models with T2-prepared methods. Canine studies also suggest that it is possible to derive myocardial oxygen extraction fraction and quantitative perfusion reserve values with BOLD CMR.
Perhaps the greatest expectation of BOLD CMR imaging is in detecting regional differences in myocardial oxygenation caused by focal CAD. Fig. 8.3 shows a schematic of the coronary vessels that supply the different myocardial territories of the mid left ventricle in humans. Luminal narrowing of the coronary vessels can lead to regional perfusion deficits in the associated myocardial territories during pharmacologic stress. Whereas vasodilators are effective at increasing blood flow to the myocardium perfused by healthy coronary vessels, MBF to territories distal to the coronary artery stenosis is limited. The reduction in blood flow to the affected region decreases the oxygen saturation of hemoglobin and aids in delineating regional perfusion differences. Over the past two decades, both clinical and preclinical animal studies have demonstrated BOLD CMR may be an alternative to FPP methods. Some of the earliest studies of the utility of BOLD CMR to understand the perfusion deficits associated with coronary occlusion were performed with gradient echo sequences. These studies showed that the occlusion of the left anterior descending artery (LAD) resulted in signal reduction in corresponding regions of the myocardium perfused by the LAD. These initial studies were followed by T2* mapping of the myocardium, which demonstrated that the myocardial regions with perfusion deficits also show preferential reduction in T2* under vasodilation. T2-prepared gradient echo methods in canine models demonstrated that it may be possible to extend the myocardial BOLD technique to three-dimensional (3D) imaging and acquire multiple slices with BOLD contrast. However, poor image quality and signal-to-noise ratio (SNR), long scan times, and inadequate sensitivity are notable limitations of the gradient echo technique at 1.5 T.

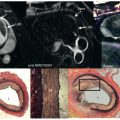
T2-prepared methods have been proposed as an alternative to T2*-based methods. Whereas T2-prepared methods employing spiral readouts showed the capability to capture the BOLD contrast, off-resonance-based blurring was a key limitation. A subsequent T2-preparation method with a bSSFP readout showed significant improvements in SNR, image quality, and scan times over the gradient echo techniques and good sensitivity for evaluating myocardial BOLD signal changes. This technique has been employed in canine models with varying degrees of stenosis of the left circumflex coronary arteries (LCXs) in the presence of systemic adenosine infusion to demonstrate the effect of perfusion abnormalities with BOLD effect. Results showed a visually discernible BOLD signal drop in the inferior and inferolateral walls supplied by the LCXs as well as a close correspondence between flow reductions in the same region as identified by the FPP images and microsphere flow maps ( Fig. 8.4 ).

Prospective, targeted control of arterial partial pressure of CO 2 (PaCO 2 ), as discussed earlier, has been shown to be valuable in modulating coronary blood flow. Recent studies using T2-prepared bSSFP-based BOLD CMR demonstrated the capability of physiologically tolerable hypercapnia to induce myocardial hyperemia, and compared this response with intravenous adenosine. These studies showed that repeat targeting of a desirable hypercapnic stimulus punctuated by return of arterial CO 2 levels to baseline leads to a reproducible BOLD response. These findings provide early evidence into novel means of examining myocardial oxygenation through a benign/repeatable coronary vasodilator.
Most studies to date have employed 2D methods, with the majority of them using T2*- or T2-based (weighted or mapping) methods. These approaches often require suspension of breathing and cannot provide full ventricular coverage over the time period over which adenosine is typically delivered. To overcome these limitations, a fast, free-breathing 3D T2-mapping technique that uses near-perfect imaging efficiency, with insensitivity to heart-rate changes which take place in the presence of vasodilator stress, allowing for full coverage of the whole left ventricle within 5 minutes, has been developed. This approach demonstrated in preclinical studies promises to offer a more refined BOLD CMR method with the 3D free-breathing T2-mapping technique and has the capability to map the hyperemic BOLD response throughout the left ventricle during adenosine administration.
Steady-State BOLD CMR: Cardiac Phase–Resolved Imaging of Myocardial Oxygenation
To date, systematic studies have demonstrated that bSSFP imaging can be used in the assessment of oxygen-sensitive imaging. Controlled in vitro studies with blood samples oxygenated to various levels revealed that when the off-resonance effects are minimized through the appropriate choice of flip angle and phase-cycling scheme, oxygen-sensitive contrast can be realized in whole blood in a repetition time (TR)-dependent manner. The results showed that relatively long TRs (compared with those that are used in conventional bSSFP imaging) are necessary to establish oxygen-sensitive contrast in bSSFP images in blood. This was subsequently used to demonstrate that arteries and veins can be separated, based on %O 2 differences. The advantages of the bSSFP method over other BOLD CMR methods is increased in SNR. In the heart, however, there are other advantages, including cardiac phase– resolved (CP) imaging allowing one to capture potential BOLD effects as well as function in one acquisition. This was first demonstrated in canines with and without coronary stenosis. Two-dimensional (2D) cardiac phase–resolved BOLD (CP-BOLD) bSSFP with a relatively long TR (6.3 ms) was used to demonstrate that occlusion of the LCX leads to regional myocardial oxygen deficit in the coronary territory supplied by LCX. The results were compared with the FPP technique and validated with microsphere-based perfusion analysis. 2D CP-BOLD CMR accurately predicted the regional MBF deficit region identified by the first-pass technique employing an exogenous contrast media. The benefits of CP-BOLD CMR with this approach permits increased confidence for evaluating myocardial BOLD signal changes in the presence of a coronary artery stenosis. Canine studies by Vöhringer et al. have demonstrated that CP-BOLD CMR can identify changes in myocardial oxygenation and flow in the presence of intracoronary infusion of acetylcholine, an endothelium-dependent vasodilator, and adenosine, an endothelium-independent vasodilator. These studies showed that CP-BOLD CMR has the capability to report on oxygenation changes in the setting of CAD or MVD.
Several noncardiac studies have shown that BOLD contrast is directly tied to field strength, and this was demonstrated in the heart as well as through theoretical simulations, and animal studies have also established this in the heart. These studies showed that at 3 T, a 3-fold increase in oxygen sensitivity could be expected in comparison to 1.5 T in theory. Experimental canine studies showed that a 2.5-fold ± 0.2-fold increase in BOLD sensitivity is possible at 3 T relative to 1.5 T ( Fig. 8.5 ). On the basis of the relationship between BOLD signal changes and microsphere perfusion, it was found that the minimum regional perfusion differences that can be detected with CP-BOLD CMR at 1.5 T and 3.0 T were 2.9 and 1.6, respectively. These findings suggest that CP-BOLD CMR at 3 T may have the necessary sensitivity to detect the clinically required minimum flow difference of 2.0 that is achievable with FPP methods.

Vasodilatory stress is the standard paradigm for probing myocardial oxygenation (O 2 ) changes due to coronary artery stenosis on the basis of BOLD MRI. However, because vasodilation is typically achieved with provocative stress, approaches that can identify the presence of stenosis on the basis of microvascular alterations at rest are highly desirable. It is known that MBV varies throughout the cardiac cycle; MBV increases during diastole and decreases during systole. It has also been shown that changes in MBV lead to increased O 2 extraction by cardiomyocytes. Thus MBV and O 2 are expected to vary at different parts of the cardiac cycle. In particular, in diastole, it is expected that MBV and O 2 extraction are maximal, whereas in systole, MBV and O 2 extraction are minimal. In addition, as MBV increases, even at a stable level of O 2 , the number of deoxygenated hemoglobin molecules within a voxel increases, causing a proportionate elevation in the local magnetic field inhomogeneities. Moreover, with increasing grade of stenosis, the MBV in the myocardial territory supplied by a stenotic artery increases in systole. Thus the relative MBV and O 2 changes between systole and diastole are expected to be different between myocardial territories supplied by healthy and stenotic coronary arteries. Moreover, it is also known that T1 of myocardium is dependent on MBV and that the apparent T2 is dependent on blood O 2 . Because bSSFP signals are approximately T2/T1 weighted, it was expected that CP-BOLD signal intensities at systole and diastole may reflect changes in MBV and blood O 2 . In addition, because stenosis leads to an increase in systolic MBV and is accompanied by a reduction in blood O 2 , it was hypothesized that systolic and diastolic CP-BOLD signal intensities may be used to detect the ischemic territories at resting states. These hypotheses were shown to be accurate with simulations and canine experiments with maximal coronary stenosis using a 2D CP-BOLD sequence ( Fig. 8.6 ) designed to mitigate against flow-mediated phase changes, which otherwise would appear as “ghost” artifacts. Although these results are encouraging, further validation of the proposed method is required. Moreover, technical advances in sequence development for 3D CP-BOLD (for minimizing potential signal variations due to through-plane motion), methods to overcome image artifacts in bSSFP images at 3 T, improvements in image processing, along with additional preclinical studies at more modest coronary stenosis may be necessary before clinical translation.

Related posts:
 Use of Navigator Echoes in Cardiovascular Magnetic Resonance and Factors Affecting Their Implementation
 Acute Myocardial Infarction: Cardiovascular Magnetic Resonance Detection and Characterization
 Atherosclerotic Plaque Imaging: Coronaries
 Cardiac Iron Loading and Myocardial T2*
 Pulmonary Vein and Left Atrial Imaging
 Noncardiac Pathology
Stay updated, free articles. Join our Telegram channel

Full access? Get Clinical Tree


