Catheterization-Related Complications


Key Points


  • Familiarity with the range of vascular complications that may be detected by ultrasound, and their respective findings, is critical.


  • Patients may have more than one complication.


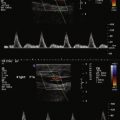
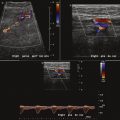
Catheterization-related complications detectable by ultrasound include hematomas ( Figs. 6-1 to 6-3 ), false aneurysms ( Figs. 6-4 to 6-10 ), arteriovenous fistulas ( Figs. 6-11 to 6-17 ), bleeding tracts, thrombosis ( Figs. 6-18 to 6-20 ), dissection, and malpositioned devices ( Figs. 6-21 to 6-23 ). The incidence is variable and depends on the access site attempted/used, the urgency of the procedure, operator experience, degree of patient obesity, size of the catheters, and number of prior catheterizations at that site. Complications that are generally inapparent on duplex examination include embolization of small debris, such as atheroembolism.


Figure 6-1


Hematoma at the site of subclavian catheter insertion. No flow can be demonstrated in the soft tissue collection, which has a marbled appearance. The subclavian vein, revealed by color Doppler flow mapping in the bottom right image, is displaced by the hematoma. The subclavian artery had been inadvertently punctured.


Figure 6-2


A large postcatheterization hematoma. Color Doppler flow mapping failed to detect flow within the mass.


Figure 6-3


A small hematoma in the groin ( top left ). Color Doppler depicts tributaries extending superficially from the nearby femoral artery ( top right ), which might suggest tracks into a pseudoaneurysm, until the spectral Doppler sampling ( bottom ) fails to display the reciprocating flow pattern that would typically be seen within a pseudoaneurysm tract.


Figure 6-4


Small false aneurysm at the right external iliac artery. Left, Color Doppler flow mapping reveals turbulent flow in the body of the false aneurysm adjacent to the artery. Right, Spectral flow display reveals the reciprocating “to-and-fro” flow pattern characteristic of a false aneurysm.


Figure 6-5


Common femoral artery false aneurysm post–coronary angiography. Top left, There is flow within a partially thrombosed lumen of the false aneurysm. Top left, The image depicts the serpiginous tract or neck of the false aneurysm. Bottom left and right, Spectral flow pattern is seen at different points along the tract joining the artery to the false aneurysm. Reciprocating flow is demonstrated.


Figure 6-6


False aneurysm of the common femoral artery evolving over time. Top, These four views reveal partial thrombosis of the body of the false aneurysm. The flow pattern in the remaining body of the false aneurysm is typically turbulent. Bottom left, “To-and-fro” flow is depicted on the spectral display. Bottom right, The image taken 2 weeks later shows complete thrombosis of the body of the false lumen with no detectable flow, even with the reduced pulse repetition frequency selection.


Figure 6-7


Small false aneurysm arising from the common femoral artery. The flow pattern is the typical reciprocating flow.


Figure 6-8


Top left, Partially thrombosed false aneurysm arising of the femoral artery postangiography. Color Doppler flow mapping detects flow in only half of the apparent body of the false aneurysm. Top right, The image taken 10 days later shows completion of thrombosis of the false lumen sac, without flow detected by color Doppler flow mapping or spectral Doppler. Bottom, Nearby branch vessels (as their course includes external to the sac) are detected by color Doppler flow mapping, falsely suggesting residual flow.


Figure 6-9


Postangiography false aneurysm of the common femoral artery. Top four images, The body and reciprocating flow into and out of it (“to and fro”) are depicted. Bottom left and right, Following thrombin injection, the body has thrombosed, but a tail of thrombus that extended out of the body through the neck into the lumen of the femoral artery developed.


Figure 6-10


Brachial artery-to-vein arteriovenous fistula and false aneurysm arising from the vein following coronary angiography. The fact that the brachial vein overlies the brachial artery was likely responsible for this fistula as the needle tract transfixes the vein. Top four images, The tract of the fistula and the body of the false aneurysm are seen on grayscale imaging. Color Doppler flow mapping confirms the arteriovenous flow. Spectral depiction of the flow at the neck of the false aneurysm reveals an atypical pattern likely due to the fact that the false aneurysm arises from a venous structure that has been partially arterialized by the nearby arteriovenous fistula. The arteriovenous fistula and false aneurysm closed spontaneously over 2 months. Bottom left and right, Resolution of a brachial arteriovenous fistula and false aneurysm over 2 months, with normalization of the anatomy and of the flow patterns in the brachial artery and vein(s).


Figure 6-11


Right common femoral artery-to-vein arteriovenous fistula following coronary angiography. Color Doppler flow mapping reveals the tract and spectral flow display reveals the continuous and turbulent flow with increased velocity in the fistula.


Figure 6-12


Common femoral artery-to-vein arteriovenous fistula following coronary angiography. Color Doppler flow mapping reveals the tract and the spectral flow display depicts the continuous-flow pattern typical of an arteriovenous fistula. The recorded velocities are less than usual, probably due to the fact that the sample volume is not cleanly within the tract but is more within the lumen of the femoral artery at the os of the tract.

Only gold members can continue reading. Log In or Register to continue

Stay updated, free articles. Join our Telegram channel

Jun 30, 2019 | Posted by in ULTRASONOGRAPHY | Comments Off on Catheterization-Related Complications

Full access? Get Clinical Tree

Get Clinical Tree app for offline access