Central Nervous System
Michael J. Fulham
Armin Mohamed
Central nervous system (CNS) tumors can be separated into primary brain tumors and cerebral metastases. The main emphasis in this chapter is primary CNS tumors, but for completeness, the role of positron emission tomography (PET) and PET with computed tomography (CT) in the assessment of cerebral metastases is also included.
CNS tumors arise mainly from neuroepithelial, meningeal, hematopoietic, nerve sheath, and germ cells. There is also a miscellaneous group, which includes tumorlike lesions such as epidermoids, dermoids, colloid cysts, Rathke cleft cysts, and others. In adults, more than 90% of the tumors arise from neuroepithelial cells, and they include astrocytomas, oligodendrogliomas, oligoastrocytomas, and ependymomas; they are collectively referred to as gliomas. There are two main peaks in the incidence of gliomas: one in childhood, where CNS tumors are the second leading cause of cancer-related death; and a second in later life, between ages 65 and 79 years. Primary CNS tumors have an incidence of 5 to 10 per 100,000 persons per year, and there is a suggestion that the incidence of malignant gliomas is increasing in the elderly (older than 85 years) (1). The tumor types and their locations also differ in these two age groups. In children, the most common tumor is the primitive neuroectodermal tumor (including medulloblastoma) followed by diffuse infiltrating neuroepithelial tumors, which are much more common in the cerebellum, diencephalon, and brainstem than in the cerebral hemispheres. In adults, neuroepithelial astrocytic tumors are most common and account for over 60% of all primary brain tumors and, of these, glioblastoma multiforme (GBM) accounts for about 60%. These adult neuroepithelial tumors are more likely to occur in the supratentorial compartment in the frontal and temporal lobes, but they can occur in any location in the neuraxis including the brainstem, cerebellum, and spinal cord.
The recent revision of the World Health Organization (WHO) brain tumor classification is used for this chapter (2). The WHO classification uses specific morphological features—nuclear atypia, mitoses, microvascular proliferation, and necrosis—to grade gliomas according to degree of malignancy. Therefore, in order of increasing degree of anaplasia the grades are: grade I pilocytic astrocytoma (PA), grade II diffuse astrocytoma (low grade), grade III anaplastic astrocytoma, and grade IV glioblastoma multiforme. Oligodendrogliomas and ependymomas are classified as WHO grade II, with the anaplastic-equivalent tumors as grade III.
The use of specific morphological criteria has been an important advance in glioma grading, but problems remain in the reliable identification of the different cell types (3,4,5,6,7,8,9). Neuropathological interpretation continues to be subjective and based, to some extent, on experience. There is poor reproducibility within and between observers, which is readily apparent to clinicians who participate in multidisciplinary tumor board meetings (10). Partly, in recognition of the shortcomings of the histopathological gold standard and of the developments in molecular and genetic analysis of gliomas, the latest WHO classification has incorporated some of the recent advances in the molecular characterization of the gliomas (2).
It is beyond the scope of this chapter to provide a comprehensive description of the diverse molecular and genetic alterations found in gliomas, but some relevant references are included in the bibliography (11,12,13,14,15,16). However, it is relevant to briefly note some of the better-characterized alterations in oncogenes and tumor suppressor genes that are found in gliomas. Currently, with the exception of the allelic loss of 1p and 19 q chromosomes in oligodendrogliomas, which identifies a glioma subgroup that has a relatively long natural history and is chemo- and radiosensitive (17,18,19,20), molecular analyses of gliomas are not routinely available and tend to be confined to the research setting (21,22). In low-grade
gliomas the earliest changes include overexpression of platelet-derived growth factor (PDGF) ligands/receptors and inactivation of the TP53 gene. The PDGF receptor leads to changes in signal transduction pathways that induce cellular proliferation and perhaps the migration and dissemination of glioma cells, while inactivation of TP53 promotes cell division and may facilitate anaplastic transformation.
gliomas the earliest changes include overexpression of platelet-derived growth factor (PDGF) ligands/receptors and inactivation of the TP53 gene. The PDGF receptor leads to changes in signal transduction pathways that induce cellular proliferation and perhaps the migration and dissemination of glioma cells, while inactivation of TP53 promotes cell division and may facilitate anaplastic transformation.
There are two distinct types of GBMs: one arises de novo in elderly patients and the other results from the malignant transformation of a low-grade glioma. De novo GBMs have amplification and overexpression of epidermal growth factor (EGF) in about 40% to 50% of cases and TP53 mutations are rare. The EGF ligands and transforming growth factor TGF-α induce cellular proliferation and invasiveness. Meanwhile, TP53 mutations can be found in the secondary GBM as well as other genetic alterations, including those found in the retinoblastoma-mediated cell-cycle pathway. Other genetic alterations are found in these high-grade gliomas, and there is loss of heterozygosity on chromosome 10q in 80% to 90% of GBMs. Much attention has focused on the PTEN/MMAC (phosphatase and tensin homology or mutated in multiple advanced cancer) gene, as a candidate gene in this location because it is mutated in 20% to 30% of primary and secondary GBMs (2,3,15). It is likely that delineation of the molecular characteristics and genetic alterations will become part of the routine evaluation of gliomas in the future.
The common presentations of patients with primary and secondary brain tumors include, in decreasing frequency, focal or generalized seizures, unaccustomed headache, personality and cognitive changes, and focal neurologic signs (23,24). Individual clinical features depend on the location of the tumor, its histologic type, and its rate of growth. De novo GBMs typically have a short history, which can be measured in weeks. Unaccustomed headache is usually related to raised intracranial pressure and cerebral edema, and it is often worse in the morning and may be associated with nausea and vomiting; occasionally it is due to acute hemorrhage into the tumor. For low-grade gliomas it is generally impossible to know when these lesions first developed; they have been detected incidentally in asymptomatic subjects without neurological signs when neuroimaging has been done for some other reason. It is not uncommon for a patient with a low-grade glioma to mention having had migraine headaches without aura for many years prior to the diagnosis; the migraine may have been symptomatic of the underlying tumor, but then again migraine is common in the general population.
Low-grade gliomas tend to be detected when imaging is done after a seizure. The high-grade gliomas—GBMs and anaplastic astrocytomas—have a poor prognosis with median survival of 1 year for GBMs and 2 to 3 years for anaplastic astrocytomas. Mean age of onset for GBMs is 53 years when compared to 40 years for anaplastic astrocytomas; men are more commonly affected than women (3 to 2). Low-grade gliomas have a better prognosis, and survival ranges from 12 to 128 months. In the authors’ opinion, low-grade gliomas are rarely if ever cured because they tend to infiltrate surrounding brain beyond the macroscopic abnormality that is evident on imaging and at operation. They occur in a younger age group, and the mean age of onset is 35 years for astrocytomas and 45 years for oligodendrogliomas (25,26,27).
In a patient with a suspected primary brain tumor, the initial step in the evaluation, after a history and neurologic examination, is to perform some form of neuroimaging. This is usually anatomic imaging with CT or magnetic resonance (MR) imaging. Both techniques provide exquisite anatomical detail and can assess the integrity of the blood–brain barrier (BBB) via intravenous contrast. MR imaging can also provide an assessment of tumoral metabolites with MR spectroscopy (MRS), function via echoplanar techniques, vascularity through MR angiography, and diffusion. Ideally, neuroimaging would provide detailed information not only about the site and extent of the lesion, but its grade, cell type, and proliferative capacity. A tissue sample would then be obtained in all cases of suspected primary brain tumors, and this sample would reflect the biological behavior of the tumor and management would then be tailored appropriately. However, in clinical medicine this is not generally the case.
Anatomic imaging has shortcomings, in particular, in relation to tumor characterization. Contrast enhancement is a nonspecific indication of disruption of the BBB and, while the neovascularization of high-grade gliomas leaks contrast because the tumor endothelial cells lack tight junctions and normal endothelium is affected by tumoral humoral agents, not all high-grade tumors enhance and enhancement is also seen after treatment (28,29,30,31,32).
Gliomas are heterogeneous (33) and biopsies are subject to sampling error, notwithstanding the difficulty in morphological assessment mentioned previously. Some gliomas are also inaccessible. Management decisions are based on the grade of the suspected or proven tumor, its size and location, the patient’s age, clinical symptoms, performance status (24,34,35), but also, importantly, on the experience and expertise of the managing team. A lesion located in the dominant temporal lobe (eloquent cortex) in a patient who is neurologically intact, with a presumed low-grade glioma, poses different challenges when compared to the aphasic patient who has papilledema and has a similarly placed lesion, which enhances avidly with contrast.
Although [1H]-MRS (proton-MRS), as one of the functional counterparts of MR imaging that allows the depiction of brain metabolites (N-acetylaspartate [NAA], choline, creatine, lactate) (30), has been used in the evaluation of brain tumors for over a decade, it has not gained widespread use. PET and PET/CT provide the opportunity to complement and improve the neuroimaging assessment in this patient group (29). In the authors’ opinion, MR imaging and PET/CT, together with conventional CT in particular circumstances, provide the highest quality assessment of brain tumors and should not be regarded as mutually exclusive or competitive. Whereas in other areas of oncology PET/CT could be regarded as a replacement technology for CT, for example, staging and restaging of the lymphomas and recurrent ovarian cancer, in CNS tumors it is a fundamental and complementary component of best-practice management of brain tumors.
The main PET ligand that has been used in this assessment and the most widely used ligand in clinical use today is fluorine-18-fluorodeoxyglucose ([18F]-FDG), an analogue of glucose (30). But whereas in the previous edition of this book the focus of this chapter was imaging with PET-only devices and the examples that were used were from patients who were scanned on a whole-body PET scanner with bismuth germanate detectors, the arrival of clinical PET/CT in 2001 fundamentally changed the neuroimaging landscape for clinicians and PET practitioners. The role of PET/CT and the PET ligands that are used in clinical practice will be covered in the ensuing paragraphs with emphasis on the practical use of the technology to answer the main clinical questions, which are asked
by clinicians who care for patients with brain tumor. These questions can be summarized as follows:
by clinicians who care for patients with brain tumor. These questions can be summarized as follows:
Is the lesion a high-grade or low-grade tumor? An ancillary question relates to identifying the underlying cell type.
What part of the lesion, if only a partial resection is done or if only a biopsy is performed, should be targeted to determine the biological behavior of the tumor?
Has this low-grade glioma undergone malignant degeneration?
Is there residual tumor after treatment?
Is the patient’s clinical deterioration due to recurrent tumor or the effects of treatment? Or is the change on the patient’s imaging studies due to recurrent tumor or the effects of treatment?
How far does the tumor extend into the surrounding tissue?
PET Ligands for Imaging Brain Tumors
The largest clinical PET experience in brain tumors is with [18F]-FDG and then carbon-11-methionine ([11C]-MET). More recently there has been interest in [18F]-fluorothymidine ([18F]-FLT) as a tracer to image cellular proliferation. However, over the past two decades a variety of PET ligands have been used to examine aspects of brain tumor biology, and so before expanding on the role of [18F]-FDG, [11C]-MET, and [18F]-FLT it is instructive to review the fate of some of these previous brain tumor PET ligands.
Tumoral glucose and oxygen metabolism, blood flow, pH, BBB, amino acid uptake, hypoxia, receptor binding, and drug delivery/ distribution/pharmacokinetics have all been investigated with PET. However, although valuable insights into tumoral biology were obtained, many of the PET ligands that were used have not made the transition into clinical application. Rhodes et al. (36) studied glioma oxygen metabolism and showed that gliomas extract a lower fraction of oxygen than normal brain, suggesting that gliomas are adequately oxygenated. Rottenberg et al. (37) found surprisingly, using [11C]-dimethyl-2,4-oxazolidinedione and later confirmed with phosphorus-31 MRS (38), that brain tumors had an alkaline pH level relative to normal brain. Putrescine serves as a precursor to the polyamines and increased polyamine metabolism is associated with malignancy, so [11C]-putrescine was proposed as a tracer for tumoral DNA synthesis (39); but subsequent studies showed that [11C]-putrescine merely depicted disruption of the BBB (40,41).
Experimental data suggest that benzodiazepines may regulate glial cell proliferation via the peripheral benzodiazepine receptors (PBRs) (42), and it was hoped that PBR ligands might be used as markers of glioma cell density (43,44). PET studies with two PBR ligands, Ro-5-4864 and PK-11195, found that there was no specific binding to astrocytomas with [11C]-Ro-5-4864; and although [11C]-PK-11195 did bind to human gliomas, it did not provide any meaningful data on tumor grading and it also bound to ischemic and inflammatory lesions, thus suggesting it would have limited value in separating recurrent tumor from radiation necrosis, which is essentially a vascular injury (45,46,47). Interest in altering the tumoral milieu with chemical radiosensitizers and bioreductive agents prior to radiotherapy to eliminate tumor hypoxia and make gliomas more radiosensitive (48,49,50,51) resulted in the introduction of [18F]-fluoromisonidazole ([18F]-FMISO) as a hypoxic imaging agent (52). However, since the initial report if Valk et al. (53), where three patients were studied with FMISO, there have been few further data to indicate that it has an impact on patient management (54,55).
Carbon-11-methionine and Amino Acid Transport
The initial hope was that [11C]-MET uptake would reflect incorporation of methionine into tumoral protein and thus provide an index of tumor activity and proliferation. However, several studies have shown that [11C]-MET uptake relates to a saturable carrier-mediated process via an L-type amino acid transporter (56,57,58,59). Since the initial reports by the Uppsala group (60,61) of the potential role of [11C]-MET in the evaluation of gliomas, there have been a large number of reports in the literature (62,63,64,65,66,67,68,69,70,71,72,73,74). The studies are difficult to compare: some have small patient numbers across the spectrum of gliomas (low- and high-grade astrocytoma, oligodendroglioma, and GBM), the certainty of histopathological diagnosis is unclear for others, scanning and analytical techniques differed, [11C]-MET has been compared to various imaging modalities including [18F]-FDG, thallium-SPECT, and anatomical imaging, and some of the findings have been conflicting. In early work (60,61,70), [11C]-MET was compared with CT and MR, but without gadolinium contrast, and appeared to better delineate the local extension of the tumor into surrounding brain in low-grade gliomas.
Ogawa et al. (71) reported, in 50 patients (32 high- and 18 low-grade gliomas), that although there was a significant difference in [11C]-MET uptake between high-grade and low-grade tumors, in an individual case it was difficult to evaluate the degree of malignancy from [11C]-MET accumulation alone. Kaschten et al. (67) found that although [11C]-methionine uptake was increased in GBMs, it could not separate low-grade from anaplastic astrocytomas. Further, [11C]-MET uptake was increased in oligodendrogliomas but was decreased in anaplastic oligodendrogliomas.
In a larger series of 196 patients where 121 were untreated and there was histopathology in 99, Herholz et al. (66) reported that [11C]-MET uptake could distinguish between different grades of glioma; but high tracer uptake was seen in pituitary adenomas, meningiomas, and ependymomas where there was contrast enhancement and disruption of the BBB. In addition, they reported that steroids reduced [11C]-MET uptake, and intriguingly there was greater [11C]-MET uptake in residual and recurrent tumors when compared to primary tumors. Although these investigators concluded that [11C]-MET uptake was independent of contrast enhancement, some of the conflicting data could be explained if [11C]-MET uptake paralleled disruption of the BBB, which is to be expected in patients with suspected recurrent tumor after initial treatment and which, of course, is influenced by corticosteroids. Indirect support comes from increased [11C]-MET uptake in acute infarction and its inability to separate recurrent tumor from radiation necrosis (75,76).
However, careful work by Derlon et al. (63,65) in two studies has provided some of the answers to the differences in the literature. In 22 untreated patients with low-grade tumors, they found that low-grade astrocytomas had decreased, normal or only moderately increased [11C]-MET uptake, whereas all oligodendrogliomas had high [11C]-MET uptake (63). These findings in low-grade astrocytomas indicate that it would not be possible to identify the extension of tumor into the surrounding brain with [11C]-MET and suggest that investigators in the earlier reports may have studied oligodendrogliomas (60,61,70,71). Then in 47 patients—27 with low-grade oligodendrogliomas and 20 anaplastic oligodendrogliomas—the same investigators showed that these two tumor grades could be separated by degree of [11C]-MET uptake (65).
In recent work where [11C]-MET uptake was compared to microvessel density, measured by immunostaining of excised tissue with factor VIII antibody, there was a direct correlation, and the
highest [11C]-MET uptake values and vessel densities were seen in an anaplastic oligodendroglioma (69). The investigators suggested that such data could be used to identify patients who could potentially respond to antiangiogenic therapies. Recently, vascular endothelial growth factor (VEGF), a protein that plays a critical role in tumor angiogenesis, has been targeted by bevacizumab, a recombinant humanized antibody that binds to and inhibits VEGF in clinical trials in brain tumor patients (77).
highest [11C]-MET uptake values and vessel densities were seen in an anaplastic oligodendroglioma (69). The investigators suggested that such data could be used to identify patients who could potentially respond to antiangiogenic therapies. Recently, vascular endothelial growth factor (VEGF), a protein that plays a critical role in tumor angiogenesis, has been targeted by bevacizumab, a recombinant humanized antibody that binds to and inhibits VEGF in clinical trials in brain tumor patients (77).
A number of other PET ligands that use amino acid transporters and have similar characteristics to [11C]-MET have been synthesized and used in similar clinical settings, albeit in small series. These include [18F]-fluorotyrosine, [18F]-fluoroethyltyrosine, [18F]-fluorophenylalanine, [11C]-aminocyclopentane carboxylic acid, and [11C]-methyl-α-aminoisobutyric acid (78,79). Apart from the advantage of an [18F] label over [11C], these ligands have not provided additional major insights into the biology of gliomas or had an impact in the clinical setting; but this may reflect limited opportunities to use these ligands in clinical practice.
Carbon-11-thymidine and Fluorine-18- fluorothymidine: Cellular Proliferation
Although there has been intense interest recently in using PET to measure tumor cell growth and hence response to therapy (80), the first attempts at imaging cellular proliferation date back to the Brookhaven group in the 1970s using [11C]-labeled thymidine ([11C]-Tdr) (81,82). Thymidine is a pyrimidine nucleoside that is rapidly taken up by cells and incorporated into DNA, and not RNA, through thymidine kinase (TK). Animal studies identified that there was a correlation between PET-Tdr uptake and DNA synthesis, and the first human studies were carried out in patients with non-Hodgkin’s lymphoma by Martiat et al. (83) in 1988.
In an early brain tumor study, Vander Borght et al. (84) performed dynamic [11C]-Tdr scans in 20 patients with a mixture of untreated low- and high-grade gliomas, recurrent gliomas, and non-gliomas, including meningiomas, lymphomas, and a metastasis. Although the number of patients was small, they reported [11C]-Tdr uptake in gliomas, regardless of grade, but also in benign meningiomas and noted uptake into the choroid plexus; importantly, these investigators did not examine the degree of contrast enhancement on anatomical imaging in their patients. However, [11C]-Tdr is a problematic ligand with its short half-life, rapid degradation in vivo to labeled metabolites and the requirement for dynamic scanning, arterial blood sampling, plasma metabolite analysis, and mathematical modeling to accurately assess uptake, which explains the lack of large patient series. However, the development of a fluorinated analogue of thymidine, 3′-deoxy-3′-[18F]-fluorothymidine ([18F]-FLT), which is more practical for clinical studies, rekindled interest in this area (80).
The analogue [18F]-FLT has a high specificity for thymidine kinase 1 in the cytosol and is phosphorylated but then essentially trapped in the cell and not incorporated into DNA because it lacks 3′-hydroxyl (85). Thus, [18F]-FLT labels the intracellular nucleotide pool but is dephosphorylated and ultimately conjugated with glucuronide in the liver before being excreted by the kidneys. Early reports by a number of investigators have suggested that [18F]-FLT shows promise as marker of proliferation in high-grade gliomas (86,87,88,89,90,91). However, two of these studies also included patients with nontumorous lesions and found that there was increased [18F]-FLT uptake in regions of infarction, demyelination, granuloma, and also in low-grade tumors such as gangliogliomas, germinomas, and dysembryoplastic neuroepithelial tumors (DNETs) (87,90). In addition, Muzi et al. (92) also showed that without contrast enhancement (disruption of the BBB) there was no [18F]-FLT uptake, and that dynamic scanning, with arterial blood sampling and modeling analysis, was needed to separate [18F]-FLT transport (K1) across the BBB from [18F]-FLT incorporation into cells. Although the work of Muzi et al. will need to be replicated, their work suggests that [18F]-FLT may have a limited role in the evaluation of treatment response in gliomas.
Fluorine-18-fluorodeoxyglucose
FDG is an analogue of glucose and is taken up by cells and phosphorylated by hexokinase to fluorodeoxyglucose-6-phosphate (FDG-6-P). However, because it is FDG-6-P it cannot participate in other steps of the glycolytic cycle and so is effectively “trapped” in the cell. The phosphorylation of FDG to FDG-6-P reflects cellular glucose utilization. Glucose enters the cell via a number of different glucose transporter proteins (GLUTs), which are expressed in neurons, glia, and also vascular endothelium in the CNS (93,94,95).
There is avid FDG uptake into the normal brain as glucose is the only fuel that the brain uses for energy metabolism. The predominant site of energy utilization in mammalian nervous tissue is at synaptic terminals, for excitatory and inhibitory neurotransmission, rather than in the cell body (96). This feature and knowledge of the various synaptic connections in the CNS has important implications for the accurate interpretation of neurologic PET/CT scans (see the section “Diaschisis” below). Thus, a neurologic [18F]-FDG PET image reflects synaptic activity but with two exceptions: (a) high-grade tumors and (b) a seizure focus during the ictus, where somal glucose metabolism predominates.
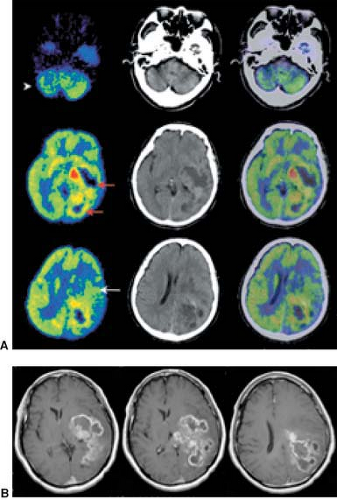
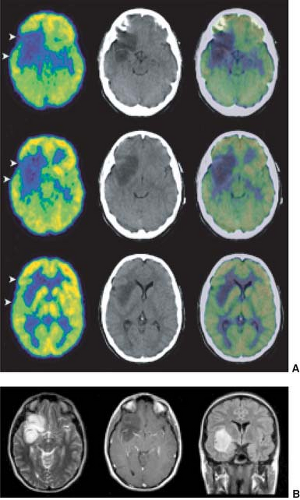
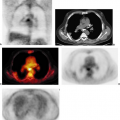
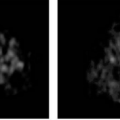
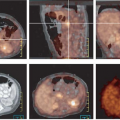
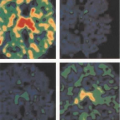
An underlying principle of [18F]-FDG PET in the assessment of CNS tumors is that the higher the grade of malignancy, the greater the glucose metabolism, which is due in part to greater “anaerobic glycolysis” with increasing grade of malignancy and overexpression of specific glucose transporters (29,97,98). Di Chiro et al. (99) showed in 1982 that increased FDG uptake, relative to white matter, was seen in high-grade tumors (anaplastic astrocytoma, GBM), whereas in low-grade tumors, glucose metabolism was less than, equal to, or only slightly greater than that in normal white matter. Examples, studied with PET/CT, are shown in Figs. 8.6.1 and 8.6.2.
Many other investigators (100,101,102,103) subsequently replicated these findings. There have been a few exceptions (104,105) where investigators did not find a correlation between glucose metabolism and tumor grade in small series of patients. However, these investigators compared average, rather than maximum, tumoral FDG uptake to FDG uptake in the contralateral brain (gray and white matter) with early generation PET scanners. The surprisingly low metabolic values for high-grade tumors in their series could be at least partly explained by partial volume error and region of interest placement that included areas of necrosis.
In a large number of patients, Fulham et al. (106) reported that the average value for the ratio of tumor to white matter glucose metabolism is 1.3 for low-grade tumors, 4.2 for anaplastic astrocytomas, and 6.5 for GBM. Independently, Delbeke et al. (102) suggested a “cutoff” ratio of 1.5 tumor/white matter ratio to separate low-grade from high-grade gliomas.
Unfortunately, the Tyler et al. (105) and Oriuchi et al. (104) citations mentioned above and the normal avid FDG uptake into the normal brain continue to be cited in the literature and are used by investigators to identify the limitations of [18F]-FDG in the
evaluation of gliomas (66,72,86,87,88,89,107,108,109). In the authors’ opinion this repetition reflects a fundamental lack of understanding of brain tumor pathophysiology and the interpretation of [18F]-FDG PET and PET/CT scans.
evaluation of gliomas (66,72,86,87,88,89,107,108,109). In the authors’ opinion this repetition reflects a fundamental lack of understanding of brain tumor pathophysiology and the interpretation of [18F]-FDG PET and PET/CT scans.
Gliomas arise from glia and may have extensive connections with surrounding glial cells, but they do not have synaptic terminals. Although glia can be found in the gray matter (cortex), they are mainly located in the white matter with the axons of neurons; there is very little energy utilization in axons, less than the cell soma. Thus, white matter [18F]-FDG uptake is a reflection of normal glial glucose metabolism.
To determine if a glial tumor has increased metabolism it is appropriate to compare it to normal white matter; it is illogical to compare metabolism in a glial tumor to cortical glucose metabolism. The authors’ practice is to use the white matter of the centrum semiovale of the contralateral cerebral hemisphere; the availability of PET/CT means that there is little problem in identifying contralateral white matter and avoiding the lateral ventricle and the moderate [18F]-FDG uptake in the body of the caudate nucleus (106,110). When there is malignant degeneration of a low-grade glioma, the initial clue is increased metabolism in the white matter, or in cortex, that was previously hypometabolic.
The limitations of the PET device should be considered when interpreting scans. It is not surprising that a PET device with a 5 to 7 mm in-plane and z-axis resolution will have difficulty detecting a 1 to 2 mm thin rim of tumor because of partial volume effects.
Low-grade gliomas characteristically infiltrate the surrounding brain, spreading between axons and normal glia in the white and gray matter. They spread beyond the abnormality identified on T2-weighted MR images and also the macroscopic abnormality that is identified at surgery. In part, this explains why a patient can have a very large low-grade glioma with no neurological findings (Fig. 8.6.2). As the volume of tumor increases there is disturbance of normal synaptic activity, and if afferent axons to the cortex are compressed the overlying cortex may become relatively hypometabolic when compared to the adjacent cortex. When a patient is imaged for the first time, it can be difficult to determine if islands of retained metabolism that are seen in the cortex within an extensive area of glucose hypometabolism are focal areas of anaplastic change or normal cortex, which is infiltrated and compressed by low-grade glioma cells. In such instances serial scans and comparison to MR imaging will resolve the matter; on [18F]-FDG the cortex becomes more and more hypometabolic over time.
Diaschisis
As mentioned earlier, a neurologic [18F]-FDG PET scan depicts synaptic activity in vivo. It is not uncommon to see reduced glucose metabolism in the cerebellar hemisphere contralateral to a supratentorial glioma, so-called crossed cerebellar diaschisis (CCD) (Fig. 8.6.1). The term CCD was introduced by Baron et al. (111) to describe the reduction of blood flow in the cerebellar hemisphere contralateral (“crossed”) to a supratentorial cerebral infarct. Similar findings were confirmed with [18F]-FDG in brain tumor patients (112). “Diaschisis” was first introduced by Von Monakow in 1910 to describe a “state of reduced or abolished function… after a brain injury and acting on a neural region remote from the lesion” (113). However, despite the marked reduction in cerebellar glucose metabolism, with CCD there is not a clinical manifestation that can be detected with standard bedside tests of cerebellar function. CCD can accompany any supratentorial process including tumor, extensive unilateral cerebral edema, infarction, gliosis, trauma, and demyelination.
The mechanism for CCD is an interruption to the corticopontocerebellar (CPC) pathway from the cerebral hemispheres to the contralateral cerebellar cortex. The CPC pathway arises from all lobes of the cerebral hemispheres, but the main inputs come from prefrontal, sensorimotor, and occipital cortices (114). The first CPC synapse is in the ipsilateral pons and second-order neurons cross the midline, via the middle cerebellar peduncle, to terminate in the cerebellar cortex. Fulham et al. (115) showed that there is ipsilateral pontine glucose hypometabolism consistent with this hypothesis together with relative preservation of glucose metabolism in the dentate nucleus of the hypometabolic cerebellar hemisphere. Regions of ipsilateral glucose hypometabolism can be found in the frontal or parietal cortices due to the interruption of ipsilateral cortical association fibers and due to loss of afferent input from a lesion in the thalamus. In both these situations the glucose hypometabolism, due to deafferentation, is visually obvious.
Effects of Medication
Corticosteroids are commonly administered to patients with brain tumor for the symptomatic relief of cerebral edema. Common side effects of prolonged steroid therapy include centripetal obesity, cushingoid facies, abdominal striae, disordered sleep patterns, and neuropsychiatric disturbances, which can range from a mild behavioral change to psychosis (116). Steroids can also reduce cerebral glucose metabolism, and studies typically appear “noisy” with poor delineation of the usual functional landmarks.
Fulham et al. (117) reported a marked reduction in cerebral glucose metabolism in 45 patients with unilateral cerebral gliomas when compared to normal subjects and patients with brain tumor who were not taking steroids. A progressive decline in metabolism was noted in patients as the steroid dose was increased, and cessation of steroids resulted in restoration of metabolism. This effect was independent of radiotherapy, concurrent anticonvulsant medication, transhemispheric functional disconnection (transhemispheric diaschisis), and blood sugar level.
Technical Aspects of Brain PET/CT
In this chapter in the previous edition the clinical examples that were used were taken from a bismuth germanate whole-body PET scanner (ECAT 951, Siemens, Hoffman Estates, Illinois). The z-axis field of view was essentially 10 cm, and two data acquisitions were required to cover the entire brain. Hooper et al. (122) used a postinjection transmission method for attenuation correction, and the typical study duration for a two data acquisitions study was approximately 1 hour. There was emphasis on alignment of [18F]-FDG-PET data to CT and MR because of the poor visualization of functional anatomy with PET (123,124). PET/CT has now rendered much of these previous data obsolete. The authors installed our first PET/CT scanner (LSO Biograph Duo; Siemens, Hoffman Estates, Illinois) in 2003 and in December 2006 our second PET/CT, the 64-slice Truepoint Biograph (Siemens, Hoffman Estates, Illinois) with
LSO detectors, was installed. The physics of PET/CT are covered elsewhere in this book (see Chapter 3) and will not be expanded upon here.
LSO detectors, was installed. The physics of PET/CT are covered elsewhere in this book (see Chapter 3) and will not be expanded upon here.
This section outlines the practical aspects of performing routine clinical [18F]-FDG PET/CT studies:
Adult patients are studied after a 6-hour fast; In women of reproductive age the possibility of pregnancy is discussed at the time of interview and if there is doubt, the study is delayed while a pregnancy test is performed;
In the authors’ center, two peripheral venous cannulas are placed prior to the injection of isotope in heated upper limbs; one is used for isotope injection and the other for venous blood sampling for the quantitative measurement of glucose metabolism; the authors use a simplified “arterialized venous” method with three blood samples (125) because the authors believe that it helps study interpretation; many centers only obtain a single sample to assess blood glucose levels;
A standard amount of [18F]-FDG (350 MBq) is injected into each subject;
The uptake period is 45 minutes during which the patient rests quietly, the eyes are patched and the ears are plugged from just before the injection of isotope toward the end of the uptake period;
Sedation is not given as a routine; if patients require sedation the authors’ preference is for the patients to be given a short general anesthetic under controlled circumstances at the end of the uptake period and planned to last for the duration of the PET acquisition; with this timing the sedative medication has the least effect on glucose metabolism; occasionally a short acting benzodiazepine is given after the patient is positioned on the scanning bed, but this is not the authors’ preferred option;
Video electroencephalogram (EEG) monitoring is done in all patients; a washable, removable cap with surface electrodes is used; EEG data are acquired prior to the injection of isotope and throughout the uptake period;
At the end of the uptake period the patient is placed on the scanning bed; at completion of the scan patients are provided with a drink and a sandwich and encouraged to drink fluid over the next 6 hours;
Scan parameters for:
PET/CT Duo: 130 kV; effective mAs—190; slice width—5 mm; collimation 2.5 mm; feed/rotation 7.3 mm; PET data three-dimensional acquisition—7 minutes;
PET/CT Truepoint: 120 kV, effective mAs—350; slice width—2 mm; collimation—1.2 mm; feed/rotation—23 mm; PET three-dimensional list mode acquisition—7 minutes;
Data reconstruction for:
PET/CT Duo: reconstructed slice thickness is 3.4 mm for both PET and CT; attenuation correction—CT-based: FORE three-dimensional to two-dimensional rebinning; discrete inverse Fourier transform reconstruction algorithm with zoom 2.7X, 512 × 512 matrix; postreconstruction filter—2 mm FWHM Gaussian;
PET/CT Truepoint: reconstructed slice thickness is 2 mm for both PET and CT; attenuation correction—CT based: FORE three-dimensional to two-dimentional rebinning; filtered back projection with zoom 2.7X, 256 × 256 matrix; postreconstruction filter—2.5 mm FWHM Gaussian;
Radiation exposure for:
PET/CT Duo: CT 1.5 mSv and PET 7 mSv;
PET/CT Truepoint: CT 2.0 mSv and PET 7 mSv;
When necessary PET/CT are registered to CT and MR data using an algorithm developed locally (123).
“Noisy” Studies
There are a number of situations where “noisy,” poor-quality images are encountered:
In patients with hyperglycemia the tracer dose of [18F]-FDG competes with serum glucose for the cerebral GLUTs and hexokinase. The result is reduced cerebral [18F]-FDG uptake and “noisy,” poor-quality images. Increasing the time for data acquisition will improve the counting statistics in this situation.
Corticosteroids have a similar effect on image quality, which is independent of the blood sugar level, although steroids can also raise blood glucose levels worsening image quality (see above).
Head motion during the acquisition period also degrades image quality. Prior to the advent of PET/CT the extent of the problem was probably underrecognized. It was certainly appreciated by experienced PET practitioners because some type of head fixation (e.g., thermoplastic face masks) were widely used for PET scanners. However, unless there was marked movement, many experienced PET physicians were reassured, perhaps falsely, that motion was not a major problem. In addition, some centers had developed algorithms to correct for motion (126,127), but accurate identification of motion was not trivial and required a motion-tracking device before the motion could be corrected (128).
Stay updated, free articles. Join our Telegram channel

Full access? Get Clinical Tree


