chapter 15 Central Nervous System Tumors
INTRODUCTION
The use of PET imaging in grading and estimating prognosis, localizing the optimum site for biopsy, defining target volumes for radiotherapy, assessing response to therapy, and distinguishing recurrent disease from radiation-induced necrosis will be discussed. Other potential labeled metabolites that have the potential for defining different areas or be more specific and/or sensitive in gliomas will then be discussed and compared to 18F-fluoro-deoxy-D-glucose (FDG)-PET in the areas of diagnosis, assessment of response, definition of different targets than FDG-PET, and possible use of these markers for targeting.
Energy Metabolism as Measured by 18F-fluoro-deoxy-D-glucose (FDG)
Glucose is the primary source of energy in brain tumors.1 Glucose metabolism begins with transport from the serum into cells and continues by being phosphorylated by the enzyme hexokinase (HK) (Figure 15-1). The product of this reaction, glucose-6-phosphate (G6P), is the starting compound for glycogen synthesis and for glycolysis, which is further metabolized via the Krebs’ cycle or pentose shunt pathway.
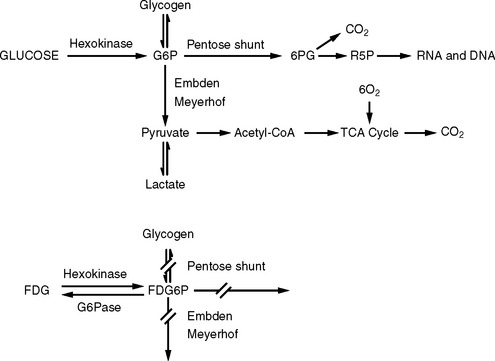
FDG-PET imaging is predicated on the similar transportation of FDG and glucose across the blood-brain barrier (BBB) and cell membranes. FDG is phosphorylated by HK to FDG-6-phosphate (FDG6P) once in the cell, and accumulates in tissues at a rate proportional to the rate of glucose utilization by that particular tissue. No further metabolism of FDG6P occurs within the cell as with glucose; however, the compound is slowly dephosphorylated. FDG and glucose differ in their rates of transport and phosphorylation and respective volumes of distribution in brain or tumor tissue. As a result, FDG metabolism is thought to be proportional to but not quantitatively equal to glucose metabolism in brain tumors.2
FDG-PET for Grading and Prognosis of CNS Tumors
The application of FDG-PET for use in gliomas was pioneered by Di Chiro and colleagues in the mid 1980s.3–5 They reported that high-grade gliomas contained regions of high FDG uptake while lower-grade gliomas lacked such areas. They also observed that patients having grade III or IV astrocytic gliomas whose ratios of tumor to contralateral normal brain utilization were > 1.4 to 1 had a median survival of 5 months compared to patients with lower ratios whose median survival was 19 months.6 In a similar study, De Witte and colleagues reported that tumor FDG uptake greater than that of the cortex was associated with a median survival of 10 months.7 More recently, Padma and colleagues described the use of a tumor vs. reference region ratio and correlated that ratio with tumor grade in 331 patients. The tumor vs. reference regions were separated into four categories: category 0 (no uptake), category 1 (≤ normal white matter), category 2 (normal white matter < lesion < normal cortex), and category 3, (≥ normal cortex). For categories 0 and 1, 86% of the tumors were histologic grade I or II with a median survival of 2.3 years. For categories 2 and 3, 94% were histologic grade III or IV, with a median survival of 11 months. Figure 15-2 demonstrates FDG uptake reported as a standard uptake value (SUV) as well as ratios of tumor/white matter (T/WM) and tumor/cortex (T/C). (SUV is calculated as tissue concentration of tracer/dose of injected tracer, usually normalized by body weight).
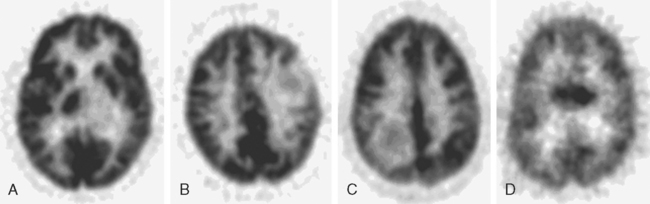
The optimal cutoff levels for distinguishing low-grade from high-grade gliomas remains somewhat controversial and may be dependent on the particular scanner, the timing of measurements, and the radiolabel that is used. Delbeke and colleagues8 reported a T/C ration of 0.6 and a T/WM ratio of 1.5 to be the cutoff levels in their study. The sensitivity and specificity were 94% and 77%, respectively (Figure 15-2). The tumor/reference region activity ratios estimated as SUVs, however, steadily increase with the time following injection,9 and thus these cutoff ratios apply only to those imaging times used in this study (Figure 15-3).
FDG-PET imaging may also be useful in distinguishing the grade of tumors that lack contrast enhancement on either CT or MRI imaging. Approximately 30% of gliomas that do not have contrast enhancement on either CT or MRI are malignant histologically when surgically sampled.10–13 De Witte and colleagues have shown the use of FDG-PET for predicting progression and death in low-grade gliomas.14 They showed that when FDG uptake was greater in tumor than in white matter in biopsy-proven low-grade gliomas, there was a higher risk of progression and death than if FDG uptake was equal to or less than in white matter.
FDG-PET Imaging for Localization of an Optimal Biopsy Site
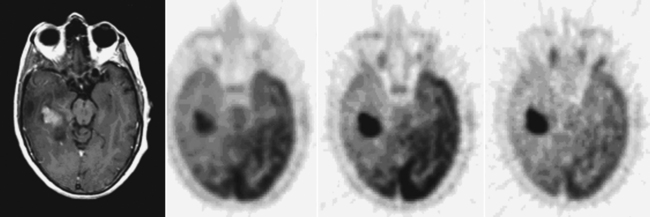
When surgical resection of a glioma is not feasible, biopsy alone may be performed in order to determine the optimal treatment. Sampling error is always a concern when only a small portion of the tumor volume is sampled. FDG-PET imaging has been shown to be useful in selecting the most malignant area of a tumor where the FDG uptake is maximal (Figure 15-4),15–18 thus maximizing the chance of proper histologic grading and subsequent appropriate therapies.
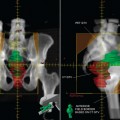
FDG-PET Imaging for Delineation of Radiotherapy Targeting
The role of radiotherapy for the treatment of high-grade gliomas (grade III and IV) was first defined in a series of studies performed by the several cooperative groups in the United States (Brain Tumor Cooperative Group [BTCG], the Radiation Therapy Oncology Group [RTOG], the North American Brain Tumor consortium [NABTC], Eastern Cooperative Oncology Group [ECOG], and Brain Tumor Study Group [BTSG]) in the 1970s. One of the earliest randomized trials to establish the utility of irradiation was the BTSG 69-01 trial, which was a four-arm randomized study comparing supportive care alone vs. Bischloroethlylnitrosourea (BCNU) vs. whole brain radiotherapy (WBRT) vs. BCNU plus radiotherapy for patients having high-grade gliomas.19 The two arms containing radiotherapy had significantly improved survival rates. A subsequent trial by the BTSG (72-01) confirmed these findings.19 A randomized comparison of WBRT vs. tumor plus margin in the BTCG 80-01 trial as reported by Shapiro and colleagues revealed no advantage in survival with the use of whole brain fields. Patients were treated with several drug regimens and were also randomized to receive WBRT to 60 Gy or 43 Gy WBRT plus a 17-Gy reduced field boost. A similar trial by the RTOG confirmed these findings.20 From the results of these studies the BTCG adopted the irradiated volume to be defined as the target volume determined by CT (early studies) or the MRI gadolinium-enhanced volume plus a 3-cm margin while the RTOG adopted a margin defined as CT (early)/MRI gadolinium enhancement plus associated edema (T2 sequence) plus a 2-cm margin. The volume was treated to 46 Gy and then a boost of 17 Gy was delivered to the MRI gadoliniumenhancing area plus a 2.5-cm margin. Despite the use of either whole brain or more focal irradiation techniques, the majority of failures continue to be local in-field failures.
As MRI became the standard for imaging the CNS, studies correlating MRI signal abnormalities (with and without contrast; T2, fluid-attenuated inversion recovery [FLAIR], etc.) clearly demonstrated that tumor cells were found not only in areas of gadolinium enhancement but also in areas of T2 and FLAIR signal abnormalities.21 These results clarified the diffuse nature of high-grade gliomas and showed the superiority of MRI over CT for tumor-volume targeting. However, the area of gadolinium contrast enhancement by MRI often does not define the exact extension of viable tumor with infiltration into edematous areas of the brain as well as non-enhancing (by any signal) areas of the brain further complicating tumor targeting. In addition, because contrast enhancement is a non-specific sign of BBB penetrance, it cannot accurately differentiate persistent tumor from post-operative effects in the postoperative period or post-treatment period.
FDG-PET imaging offers the potential of performing a functional analysis of normal brain and of brain tumors and more accurately defining tumor extent. FDG is transported across the BBB by the same carrier systems as glucose and thus disruption of the BBB is not necessary for FDG accumulation in tumor cells. FDG-PET has been shown to be of prognostic value in both low-grade and high-grade gliomas.7,14 Its use for the targeting of high-grade gliomas has been evaluated by several studies. Tralins and colleagues analyzed patients with Glioblastoma multiforme using FDG-PET with CT scan image correlation after they had received 45 to 50 Gy of conventional irradiation using T2 MRI imaging for target delineation.22 That study concluded that the FDG-PET volume was more predictive of active tumor than an MRI obtained at the same time. In a subsequent publication by Douglas and colleagues reporting the outcome of patients who were boosted to the area of FDG-PET accumulation after 45 to 50 Gy, no difference was observed between patients boosted to 79 Gy vs. historical controls.23 Interestingly, however, the survival of patients who were FDG-PET negative at the time of the PET imaging, and therefore were not boosted above 59.4 Gy, was identical to those patients who were PET positive and who received 20 additional Gy. One explanation for this observation is that patients who were FDG-PET negative midway through treatment had only microscopic disease and therefore might have benefited more from a dose escalation than those patients who still had gross disease by PET imaging. Solberg and associates reported the feasibility of using FDG-PET targeting for a simultaneous boost using an intensity-modulated radiotherapy technique (IMRT).24 MRI T2 margins were used to define the larger field while FDG-PET defined biologically active sites within the T2-defined tumor volume that were treated with a higher daily dose than the entire volume. No treatment outcomes were reported for this study. In contrast to these studies, Gross and colleagues compared MRI post-gadolinium volumes with FDG-PET positive areas in high-grade gliomas (grades III and IV) to determine whether FDG-PET provided any additional information that was not visible on MRI.25 They concluded that only in a minority of patients did the FDG-PET provide additional information useful for radiotherapy treatment planning.
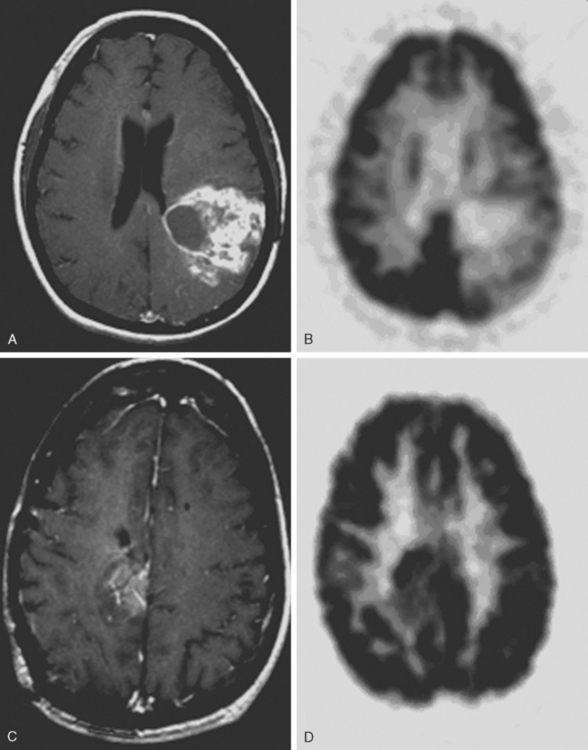
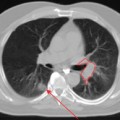
FDG-PET for Determination of Recurrent Disease vs. Radionecrosis
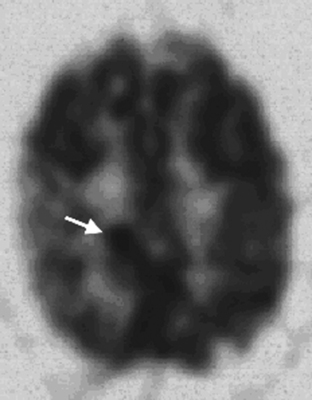
The sensitivity of FDG-PET for distinguishing recurrence of glioma from radionecrosis is typically 81% to 86%, although some reports are up to 100%.26–32 Specificity is problematic in that estimates range from 22% to 100%. In the instructive report by Ricci and colleagues there were 31 patients suspected of harboring a recurrence; pathology was positive in 22 and negative in 9.33 With the cutoff of FDG uptake greater than white matter, the sensitivity was 86% but the specificity only 22%. With the cutoff greater than cortex the sensitivity was 73% and specificity 56% (Figure 15-5). The challenge of distinguishing recurrence from radionecrosis at the outset is beset with the problem that gliomas are ineradicable by all treatments that spare neurologic function. Even though a high percentage of a given glioma after treatment may be necrotic as viewed by the pathologist or PET imager, the tumor may harbor viable cells that later lead to recurrence, which may not be detectable by PET imaging. Moreover, treated malignant gliomas wherein FDG-PET scans are hypometabolic consistent with radionecrosis may show in biopsy or resection specimens intact tumor cells that may or may not be capable of proliferation, energy metabolism, or substrate transport.34
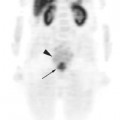
Assessing Response to Therapy Using FDG-PET
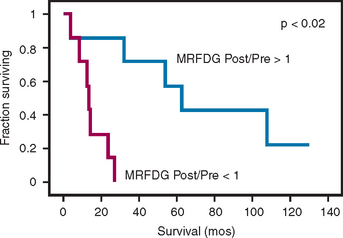
An important question in clinical practice is whether changes in glucose metabolism are a reliable predictor of the response of malignant gliomas to therapeutic interventions. Changes on various MRI sequences are the norm (particularly T2 or FLAIR) and are difficult if not impossible to interpret as a reliable predictor of response or progression. Successful radiotherapy of a glioma would be expected to kill tumor cells and cause a reduction of metabolism measured with FDG (MRFDG) as reported for chemo-hormono-therapy of breast cancer.35 As a hypothesis, tumors that respond to treatment would be expected to show unchanged or reduced metabolism and conversely, tumors that do not respond show increased metabolism. This has been tested in patients scanned quantitatively with FDG within 2 weeks before (pre-radiotherapy) and/or 1 to 3 weeks after RT (post-radiotherapy).36 The results unexpectedly showed that an increase in MRFDG from the beginning of radiotherapy to the end correlated with longer survival while a decrease was associated with shorter survival (Figure 15-6). An explanation of these findings could be that therapy might lead to increased metabolism and relatively better outcome due to increased transport, infiltration of dead and dying tumor regions with metabolically active inflammatory elements, energy consumption for apoptosis, and/or an uncrowding effect as tumor cells die allowing more active metabolism in surviving normal elements.
Stay updated, free articles. Join our Telegram channel

Full access? Get Clinical Tree


