chapter 2 Principles of PET-CT Scanning
Positron Decay
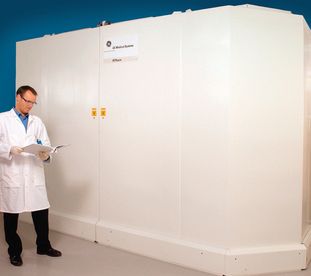
The detection and localization of positron decay within the body is the means by which positron emission tomography (PET) images are created. Positron decay is a form of radioactive decay, which is the means by which unstable atoms spontaneously convert to a more stable form with a lower overall energy. These unstable atoms (radionuclides) are created via various nuclear reactions, occurring in generators, reactors, or cyclotrons. The majority of positron emitting isotopes are produced in a cyclotron. Previously, cyclotrons were located only in research institutions and academic centers, due to the high cost and resources needed to operate and maintain a cyclotron. However, in recent years, cyclotrons have been purchased by commercial companies to produce medically useful isotopes, specifically, positron emitting isotopes. Also, cyclotron size has become significantly more convenient than in the past (Figure 2-1). In particular, the radiotracer fluoro-2-deoxyD-glucose (FDG) has led the way in PET imaging in routine clinical oncology.1
In the process of radioactive decay, energy is released, usually in the form of a particle (positron and beta decay) or a photon (gamma decay). Photons form the basis for single photon emission computed tomography (SPECT), while positron emission forms the basis for PET. Emitted from an unstable nucleus, positrons are particles with a mass of an electron, but a positive charge, rather than a negative charge. Beta decay consists of an electron emission and does not produce medically useful images. Positron emitting radionuclides will be discussed here. These radionuclides are incorporated into various compounds, called radiopharmaceuticals or radiotracers. These compounds are physiologically active molecules and attempt to model a physiologic process (e.g., glucose metabolism or fatty acid metabolism). All PET radiotracers undergo positron decay with varying half-lives (Table 2-1).2 The half-lives determine the rate at which decay occurs, resulting in a photon flux, which generates images: the higher the photon flux, typically the better the images. Hence, a general rule is that a shorter-lived radiotracer typically produces better images than a longer-lived radiotracer, assuming they are given in equal amounts.
TABLE 2-1 Half-Lives of Common Radionuclides
| Radionuclide | Half Life (minutes) |
|---|---|
| Carbon-11 | 20.3 |
| Nitrogen-13 | 10 |
| Oxygen-15 | 2.07 |
| Flourine-18 | 110 |
| Rubidium-82 | 1.25 |
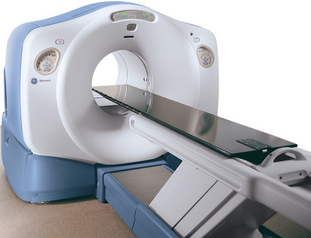
Detection of photons by scintillation crystals occurs by photoelectron generation within the crystal. The light output varies depending on the crystal composition.2 Different manufacturers use different crystals and the advantages/disadvantages of each design is beyond the scope of this book. This light output is amplified by a photomultiplier tube and is subsequently localized via positioning circuits and electronics. Coincidence events are photons detected 180 degrees apart within a certain time span, typically on the order of nanoseconds, to ensure true events are recorded rather than random events or scattered events. Random events are the result of two positron decays occurring simultaneously, resulting in an errant LOR. These are, as their name suggests, random in occurrence and are difficult to correct. Scattered events are events due to Compton scatter, altering the path of one photon, also resulting in an errant LOR. Compton scatter often occurs when the path of a photon crosses two materials of differing density, such as soft tissue and bone, or bone and air. A typical PET image will be acquired and processed in a 128 pixel by 128 pixel image matrix, consisting of a total of 16,384 pixels per image. A typical CT scan is acquired in a 512 × 512 matrix, consisting of 262,144 pi-xels image, leading to significantly higher spatial resolution from a CT image when compared to a PET image, assuming an identical FOV for each scanner. A typical PET-CT scanner has an axial FOV of 60 cm, leading to inherent resolutions of 0.47 cm for the PET scanner and 0.12 cm for the CT scanner. Combination PET-CT scanners provide the anatomical detail of CT scanning with the functionality of PET imaging in one machine (Figure 2-2). These scanners are larger than a conventional PET-only machine, but are still of a clinically feasible size. The popularity of these combined scanners has markedly increased since the advent of PET scanners, and PET-CT units comprise roughly 90% of the current market share of scanner sales in the United States.
PET Imaging
As with all images generated in nuclear medicine, PET attempts to map a biological process related to the tracer injected. Often the image represents functional metabolic activity, most often for oncologic indications.1,3 For example, imaging with the radiotracer FDG attempts to map the glucose utilization pattern of the bodily tissues. Other substrates may be incorporated into radiotracers, for example, fatty acids, amino acids, and charged particles.4 The development of new radiotracers is an exciting part of nuclear medicine that will drive future application of PET imaging and image-guided therapy. Current research is being done to examine hypoxia-marking agents in the use of radiation therapy and the use of different substrates to correctly predict tumor biology and potential response to different therapies.5 Advances in the field of radiochemistry have made tracer development an exciting topic, which will become more apparent in the near future.
PET images are essentially a map of positron decay occurring within the body from the distribution of radiotracer in the body after administration, whether injected, administered orally, or inhaled. Although PET images are typically displayed in tomographic slices, they may be acquired as two-dimensional (2D) axial slices of a finite thickness or as a three-dimensional volume (3D). The advantages and disadvantages of the two methods are beyond the scope of this book, but the various scanner manufacturers utilize different protocols in the hope of acquiring the optimal image. Some manufacturers offer 2D or 3D imaging in the same machine, utilizing retractable septa (Figure 2-3). This allows for greater flexibility in acquiring PET data and the ability to tailor image acquisition to specific clinical needs. Once acquired, raw PET data is stored as sinogram data and then reconstructed into tomographic slices, which are displayed and interpreted.
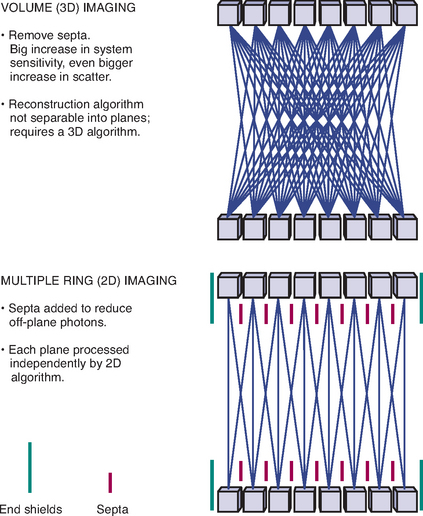
Figure 2-3 Concept of 2D vs. 3D image acquisition and retractable septa.
(Image courtesy of GE Medical Systems.)
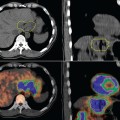
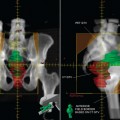
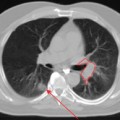
Originally, filtered back projection (FBP) was used for image reconstruction, but has since been replaced by iterative methods. Advantages of iterative methods are better attenuation correction (which will be explained later) and better scatter correction, leading to significantly better image quality.6,7 Images are typically reconstructed in axial, sagittal, and coronal projections and are displayed with and without attenuation correction. Attenuation correction is the process by which a computer algorithm corrects for the inherent decrease in photon flux from structures located deep within the body. Deeper structures are subject to attenuation, which is the physical process of loss of photon energy, proportional to the density and the thickness of the material being traversed by the photon. Attenuation correction attempts to correct for the non-uniformities seen on non-corrected images in the deeper structures of the body. However, there is a tradeoff: attenuation correction images are subject to numerous artifacts, which arise from the correction process itself.8 Typically these artifacts arise at boundaries between high-density structures and low-density structures. Most commonly, these artifacts are seen at the interface between liver and lung.9 Additionally, metallic streak artifacts can lead to decreased image quality on PET-CT images, since the CT images are used for attenuation mapping.10–12 If a high-energy rod or pin source is used in the attenuation correction process, the artifacts are much less noticeable. Attenuation correction via a high-energy rod or pin source creates a transmission scan, which has the look of a very crude CT scan. It assigns attenuation coefficients of air and soft tissue only to bodily structures. In principle, attenuation correction via CT scanning (as is done with PET-CT systems) leads to more accurateattenuation correction since individual structures are assigned specific attenuation coefficients (Hounsfield units), which vary from air to metal. Situations in which there is more falsely elevated density than expected (e.g., intravenous contrast or metallic prostheses) can lead to additional artifacts; however, these artifacts are relatively easy to identify. In routine practice, both systems lead toaccurate attenuation correction. The advantage of PET-CT is direct anatomic correlation and image registration between PET and CT images, which make anatomic localization of abnormalities considerably easier, an obvious advantage in radiation therapy planning.
Current radiotracers used for clinical PET imaging are numerous, but only one is used in routine clinical practice at this time, fluorine-18-fluoro-2-deoxy-D-glucose (F-18-FDG). This tracer is simply a glucose molecule with one oxygen substituted with radioactive F-18, which is a positron-emitting radioisotope produced in a cyclotron. The end product of the cyclotron is usually hydrofluoric acid, which is further incorporated into glucose via a synthesizer unit. Once synthesized, sterility and purity tests are performed prior to patient administration to ensure patient safety. Recently, commercial availability of FDG has increased such that more imaging facilities have ready access to FDG on a routine basis. Previously, the short half-life of F-18 (110 minutes) obviated the need for a cyclotron in-house or in very close proximity to the imaging center. Currently, access to PET imaging is mostly limited by scanner cost, which has decreased in recent years, but still continues to be a major issue, especially given the lower throughput of PET scanning when compared to CT or magnetic resonance imaging (MRI).
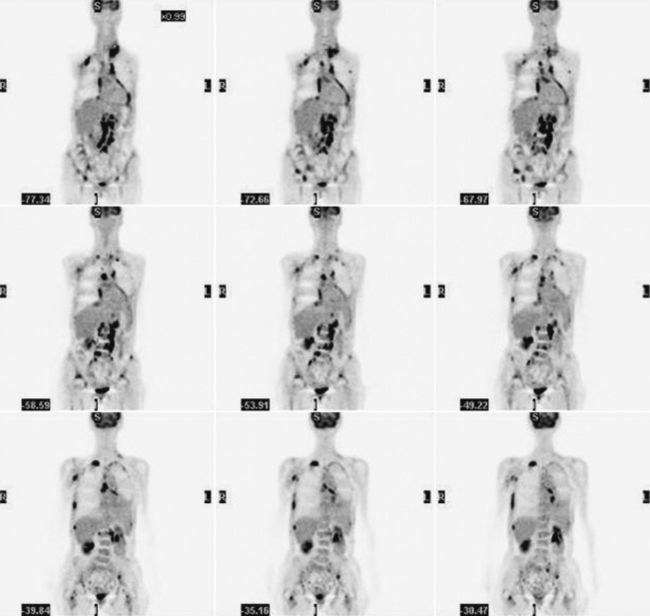
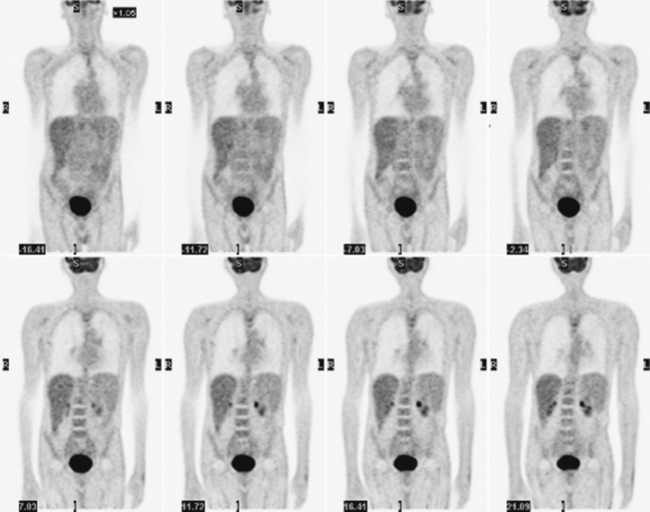
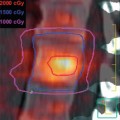
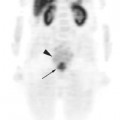
Glucose is a substrate for nearly every cell in the human body, especially the brain, heart, and skeletal muscle. These organs provide part of the background activity on PET scans. Normal tissue undergoing physiologic metabolism also accounts for the remaining background activity on PET scans. FDG has been shown to accumulate avidly in inflammatory cells as well as neoplastic cells.13 The mechanism of uptake in both inflammatory and neoplastic cells has been well studied.14 Once activated, inflammatory cells demonstrate markedly increased metabolism, leading to increased glucose utilization and subsequent increased acti-vity on a PET scan. Malignant cells have increased activity on a PET scan for two reasons: first, they are hypermetabolic when compared to other cells of the same lineage, and second, they are biochemically unable to metabolize fluorinated glucose once phosphorylated, typically via hexokinase. This leads to intracellular trapping of FDG within malignant cells, resulting in increased activity on a PET scan (Figure 2-4). A normal PET scan (Figure 2-5) and a scan depicting treated neoplasm (Figure 2-6) are shown for comparison.
Stay updated, free articles. Join our Telegram channel

Full access? Get Clinical Tree


