Chest CT Pathology
Segments of the Lung
It is especially important to be able to identify the segments of the lungs in CT images if bronchioscopy is planned for biopsy or to remove a foreign body. The right lung has 10 segments. In the left lung, the apical and posterior upper lobe segments have a common bronchus and there is no 7th segment (paracardiac [medial basal] segment of the lower lobe).

Upper lobe | 1 apical 2 posterior 3 anterior |
Middle lobe | 4 lateral (superior lingula) 5 medial (inferior lingula) |
Lower lobe | 6 superior/apical 7 paracardiac/medial basal 8 anterior basal 9 lateral basal 10 posterior basal |
The parenchyma next to the interlobular fissures () appears avascular.
The borders of the segments (– – –) are usually not visible in sections of normal thickness and can only be identified by the branches of the pulmonary veins (96) which pass along these borders.


High-Resolution Technique
HRCT stands for high-resolution computed tomography using thin sections and a high spatial resolution reconstruction algorithm. Even conventional CT scanners can acquire images of narrower slice thickness than the standard 5-8 mm. The image acquisition parameters can be adjusted on the console to a thickness of 1-2 mm if necessary.
In the SCT technique, thinner sections can also be computed at a pitch factor of 1:1 after acquisition (see also p. 8). However, it is not always worth reconstructing slices of less than 1 mm thickness because the low signal-to-noise ratio reduces image quality.
HRCT is therefore not the method of choice for routine chest examination because radiation dosage is much higher if more sections are acquired. Longer examination times and higher hard-copy film cost (“slice pollution”) are also arguments against using HRCT. Only structures with naturally high levels of contrast such as areas surrounding bone will be well demonstrated.
High-Resolution Effects on Image Quality
Figure 86.1 shows a conventional scan of a pulmonary lesion (7) surrounded by a zone of edema or an infiltrate (185). At a dS setting of 10 mm this zone closely resem-bles the poorly ventilated area at the back of the posterior lobe (178).
HRCT distinguishes these areas of increased density more clearly ( Fig. 86.2 ) because voxel averaging does not have any appreciable effect (see also p. 14).
The DD includes bronchial carcinoma, metastasis of breast cancer resulting in lymphangitis carcinomatosa, and atypical pneumonia.


These images show a rare complication after catheterization of the right heart. The catheter was positioned too peripherally and caused hemorrhage (173) into adjacent parts of the lung. Follow-up 3 weeks later showed complete recovery.


Indications
One of the many advantages of the HRCT technique is that older scar tissue can be distinguished from acute inflammation, for example in immune-suppressed patients or bone marrow recipients. Older scar tissue (186) is always well defined ( Fig. 87.1 ), whereas fresh infiltrates are surrounded by a zone of edematous tissue (185) as in Figure 87.2 . HRCT is often the only method with which to determine whether chemotherapy should be continued in a lymphoma patient who is in the aplastic phase on therapy or whether chemotherapy must be discontinued because of fungal pneumonia. Fresh infiltrates (178) can sometimes be seen next to older scar tissue (186) ( Fig. 87.3 ).
Because the slices are extremely thin, the horizontal interlobular fissure (*) may appear as a bizarre ring or crescentic ( Figs. 87.1 and 87.2 ).


Minor areas of collapse, which are usually found close to the pleura posteriorly in the lung, must be differentiated from flat sections of fissures (178 in Fig. 87.1 ). In doubtful cases, it may be helpful to repeat a scan in the prone position. Areas of collapse and poor ventilation may then disappear or be seen anteriorly. Pulmonary abnormalities due to an infiltrate or to a pneumoconiosis would be unchanged.
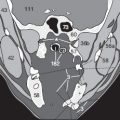
Among the many anatomic variations of the thorax, an atypical course of the azygos vein (140) is relatively common. It can pass from the posterior mediastinum through the right apical lobe to the superior vena cava (92). It is located within a fold of the pleura and therefore separates the azygos lobe from the remainder of the right upper lobe. This variation is usually discovered incidentally on a conventional chest X-ray ( in Fig. 88.1 ) and has no clinical significance. Figures 88.2 to 88.4 show the anomalous path of the vessel as it appears in CT images.
Atypical positions or branching of the aortic arch (89) vessels are rarer. An example is the right subclavian artery, known as the “lusorian artery”, which can resemble a lesion in the upper mediastinum.
Note that normal breast tissue, surrounded by fat (2), may have very irregular contours (72 in Fig. 88.4 ). When using lung windows, you should not only look for solid round lesions and inflammatory infiltrates, but also recognize any thinning or even absence of lung vessels.


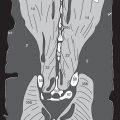
However, attenuation of vessels is not always a sign of emphysema. Asymmetry in the bronchovascular pattern develops after a part of the lung has been resected. In the patient imaged in Figure 88.5 , the left upper lobe had been removed and the remaining lung tissue has compensated and filled the entire left thoracic cavity (right half of the image). There are fewer lung vessels per unit volume and an ipsilateral shift of the mediastinum. These changes are accompanied by a slight elevation of the diaphragm. At the time of this follow-up CT, the patient was healthy and had neither emphysema nor recurrent tumor.

Chest Pathology: Chest Wall
According to the sequence in the checklist on page 74, one should now turn to soft-tissue windows in order to examine the soft tissues of the chest wall. Most abnormalities will be located in the axillae and in the female breast.
Alterations in Lymph Nodes
Normal axillary LNs (6) are usually oval and less than 1 cm in dimension. They often have a hypodense center or are horse-shoe-shaped as in Figure 89.1 , a feature known as the “hilum fat sign”. The architecture of a normal LN is characterized by vessels entering the hilum, which contains hypodense fat. Many abnormal LNs have lost their normal contours and are rounder or irregular. Such LNs all appear solid and lack the hilum fat sign, as seen in those in the left axilla in Figure 89.2 . For direct comparison, two lymph nodes on the other side in the same image are normal.


Larger metastatic LNs (7) are usually poorly defined and difficult to differentiate from surrounding fat (2). They often have central areas of necrosis (181), so that the differential diagnosis of an abscess with central liquefaction must be considered ( Fig. 89.3 ). If axillary lymph node metastases have been treated operatively or with radiotherapy, the date and treatment should be noted on the referral sheet for follow-up CT. Postoperative healing processes and scarring (186) change the morphology of LNs ( Fig. 89.4 ), so they resemble abnormal nodes (see above). Again the lack of clinical information makes diagnosis unnecessarily difficult for the radiologist.


Breast
The normal parenchyma (72) of the female breast has very irregular contours and slender, finger-like extensions into the surrounding fat (2) (cf. Fig. 88.4 ). Bizarre shapes can often be seen ( Fig. 90.1 ). Advanced stages of breast cancer (7) have a solid, irregular appearance ( Fig. 90.1 ). The malignant tissue crosses the fascial planes or infiltrates the thoracic wall, depending on size. Baseline CT after mastect my ( Fig. 90.2 ) should help in the early identification of recurrent tumor. The diagnosis of recurrent tumor is made more difficult by fibrosis after radiation, postoperative scar tissue, and the absence of surrounding fat. Special attention must therefore be paid to the regional LNs (cf. pp. 74, 89) and th bones, so that metastases (7) in the vertebrae (50) ( Fig. 90.2 ) are not overlooked. The bone window must be examined in such cases.


Related posts:


Stay updated, free articles. Join our Telegram channel

Full access? Get Clinical Tree


