Anatomy, embryology, pathophysiology
- ◼
The liver is located in the right upper quadrant of the abdomen below the diaphragm. It is mostly covered by ribs but the lower portion of the liver is palpable below the right costal margin. The liver is divided into four anatomic lobes: right, left, quadrate and caudate.
- ◼
At the anterior surface of the liver, the falciform ligament separates the left and right lobes. The falciform ligament binds the liver to the anterior abdominal wall. At the visceral surface, the ligamentum teres separates the left and right lobes.
- ◼
The quadrate and caudate lobes are adjoint with the right lobe. The quadrate lobe is demarcated by the gallbladder, porta hepatis and ligamentum teres. The caudate lobe is demarcated by the inferior vena cava, porta hepatis and ligamentum venosum.
- ◼
The Couinaud classification divides liver tissue into eight segments. On a frontal view, segments 6 and 7 are not visible, as these are located posteriorly. The right border is formed by segments 5 and 8.
- ◼
At embryologic day 22, the liver tissue starts developing from an endodermal thickening called the hepatic plate, which is located on the ventral side of the duodenum. Cells in the hepatic plate proliferate and develop into the hepatic diverticulum. The hepatic diverticulum gives rise to hepatoblasts, and from hepatoblasts to hepatocytes and bile canaliculi. At an embryological stage, the liver serves as a hematopoietic organ.
- ◼
Patients with hepatitis C, hepatitis B, alcoholism, nonalcoholic fatty liver disease, and autoimmune hepatitis may develop chronic liver disease (CLD). Depending on the primary etiology, these patients may present a liver profile with fibrosis, fat and/or iron accumulation.
Techniques
Magnetic resonance imaging
- ◼
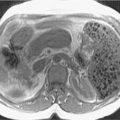
Fibrosis. For fibrosis assessment in CLD patients, several magnetic resonance imaging (MRI) techniques can be used, including conventional contrast enhanced MRI, double contrast enhanced MRI, diffusion weighted imaging, MR elastography, and MR perfusion imaging ( Fig. 15.1 ). In double contrast enhanced imaging, superparamagnetic iron oxide administration (SPIO) and gadolinium are used as contrast materials. In MR elastography, an external paddle produces a mechanical stimulus on the liver in a frequency between 40 to 120 Hz. Shear waves generated by the paddle are monitored, and the shear wave velocity is calculated. Diffusion weighted imaging (DWI) monitors the diffusion of protons and signal loss during this process. Interpretation of DWI is based on calculation of apparent diffusion coefficient (ADC) values. ADC is calculated by measuring the signal loss between two b values (b value = strength of the diffusion weighting). In MRI perfusion imaging, hemodynamic changes in a fibrotic liver can be evaluated after bolus injection of contrast using kinetic models of dynamic image data.

Fig. 15.1
Parenchymal nodularity with bridging bands of fibrosis. The axial, moderately T2-weighted, fat-suppressed images at baseline (A) and follow-up (B) portray advanced cirrhosis reflected by diffuse nodularity with intervening reticular hyperintensity, corresponding to fibrosis with worsening ascites. Comparing the out of-phase (C) with the in-phase (D) images reveals susceptibility artifact arising from the parenchymal (siderotic) nodules because of their iron content.
(From Roth C, Deshmukh S. Fundamentals of Body MRI , ed 2. Philadelphia: Elsevier; 2016.)
- ◼
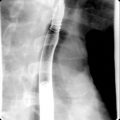
Iron. Gradient echo images are more sensitive to signal loss than that of spin echo images. Mild iron accumulation may only appear on gradient echo images. Severe iron accumulation may appear on both techniques. Calculation of T2 or T2* relaxation time constants using multiple echo times and calculation of a signal intensity ratio between the liver and an internal reference (e.g., paraspinal muscles) can be useful to quantify liver iron ( Fig. 15.2 ).

Fig. 15.2
A T2* map was generated by acquiring 12 colocalized fat-saturated spoiled gradient recalled echo magnetic resonance images. Echo times ranged from 1.6 to 13.6 ms. Of the series of 12 images, five are presented for illustrative purposes with echo times as shown. The T2* value was calculated assuming monoexponential signal decay from the 12 echoes. The estimated T2* relaxation value, 9 ms, suggests moderate iron overload.
(From Sahani DV, Samir AE. Abdominal Imaging , ed 2. Philadelphia: Elsevier; 2017.)
- ◼
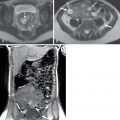
Steatosis. MR spectroscopy measures proton composition in a specified volume. Frequency-selective imaging applies a radiofrequency pulse to the fat or water frequency range to selectively suppress fat or water signals. Phase-interference imaging focuses on echo-time dependent phase-interference effect between fat and water gradient signals. Proton density fat fraction measures the ratio of fat proton signals to the sum of fat and water proton signals ( Fig. 15.3 ).

Fig. 15.3
Moderate phase cancellation signal loss is evident in the in- and out-of-phase images, (A) and (B) respectively. The proton density fat fraction image (C) assigns pixel signal intensity proportional to fat content, as reflected in the ROI measurements of the subcutaneous fat with the mean intensity of approximately 95% and the liver with a mean intensity of approximately 20% corresponding to the fat content.
(From Roth C, Deshmukh S. Fundamentals of Body MRI , ed 2. Philadelphia: Elsevier; 2016.)
Computed tomography
- ◼
Fibrosis. Although computed tomography (CT) is accurate and preferable in cirrhosis detection, there is limited information about performance in fibrosis quantification and precirrhotic liver evaluation. Caudate-to-right lobe ratio and decrease in diameter of liver veins have been proposed to detect liver fibrosis.
Ultrasound
- ◼
Fibrosis. Ultrasound (US) based shear wave elastography is highly sensitive and specific for cirrhosis detection. An acoustic pulse based stimulus generates a shear wave in localized liver tissue. The speed of these waves is positively correlated with stiffness of the liver. Two types of shear wave elastography techniques are used for this purpose: (1) two-dimensional shear wave elastography and (2) point shear wave elastography. High stiffness values are observed in higher stages of liver fibrosis.
- ◼
Iron. US cannot detect iron accumulation in the liver. However, it is useful to monitor iron related secondary complications like cirrhosis.
- ◼
Steatosis. Conventional B mode ultrasound can be used to detect steatosis. Semiquantitative methods exist, such as the hepatorenal index calculation (brightness of liver/brightness of renal cortex at the same image depth). Quantitative methods are not understood well in clinical settings, but Fibroscan based controlled attenuation parameter (CAP) is an accurate technique to quantify fat. Experimental methods like attenuation coefficient, backscatter coefficient, speed of sound measurement and shear wave dispersion may be useful in the future.
Specific disease processes
Magnetic resonance imaging
- ◼
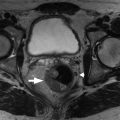
Fibrosis. Early stages of fibrosis and early cirrhosis are not easily identified on noncontrast MRI. However, on gadolinium enhanced MRI, a fibrotic liver may show T1 shortening and signal increase on T1-weighted images. The signal enhancement peaks at the late venous and equilibrium phases. Gadolinium enhanced T1-weighted, fat-suppressed three-dimensional gradient echo MRI may be useful in liver fibrosis imaging. For double contrast enhanced MRI imaging, a normal liver SPIO would result in T2* shortening and signal reduction. However, in a liver with fibrosis, less SPIO will accumulate because of loss of Kupffer cells. This phenomenon will result in high signal intensity in the fibrotic liver. SPIO contrast (infusion over 30 minutes) reduces the signal of background liver parenchyma. Gadolinium (bolus injection) increases the signal of water in fibrotic tissue. Therefore combined use of SPIO and gadolinium significantly improves the detection of fibrosis in the liver. MR elastography is highly accurate to detect moderate-to-high stage liver fibrosis and cirrhosis. However, at early stages of liver fibrosis (<F2), it is not sensitive enough to detect individual stages of fibrosis ( Fig. 15.4 ).

Fig. 15.4
Magnetic resonance elastography (GE 1.5T) wave and elastogram images. Single, large ROI should be located on right hepatic lobe.Related posts:

Stay updated, free articles. Join our Telegram channel

Full access? Get Clinical Tree