Clinical Applications of ASL Brain Perfusion Imaging
Ervin L. Lowther, MD
Christopher T. Whitlow, MD, PhD,
Joseph A. Maldjian, MD
▪ Introduction
Arterial spin labeling (ASL) is an established, noninvasive perfusion imaging technique that allows quantitative assessment of blood flow without the use of ionizing radiation or contrast material. This increasingly available and powerful tool has a myriad of clinical applications in cerebral perfusion imaging, including cerebrovascular disease, epilepsy, and neuro-oncology.
▪ Background
Cerebral perfusion or cerebral blood flow (CBF) refers to the amount of blood supplied to the capillaries and interstitial spaces of the brain. Cerebral perfusion is closely linked to brain function via autoregulation by local tissue metabolites to maintain a constant supply of oxygen and nutrients to the brain.1 CBF was first measured by Kety and Schmidt in 1945 using inhaled nitrous oxide (N2O) as an exogenous tracer since it freely diffuses between the vascular compartment and the tissue.2 By measuring the cerebrovascular arteriovenous gradient and quantifying the fraction of N2O extracted by the tissue, CBF was derived using the Fick principle and expressed in units of mL/100 g of tissue/minute.2,3
Since that time, less invasive techniques to determine CBF have been developed, which include single photon emission computed tomography (SPECT), dynamic susceptibility contrast-enhanced MRI (DSC-MRI), and dynamic contrast-enhanced MRI (DCE-MRI). Though differing in their methodologies, each technique relies on an exogenously administered tracer to determine CBF.
CT and nuclear medicine-based perfusion techniques expose the patient to ionizing radiation, limiting their use in certain patient populations and utility for serial examinations. Currently employed CT perfusion techniques are qualitative, and the common hemodynamic parameters measured in clinical practice are relative cerebral blood volume (CBV), mean transit time (MTT), and relative CBF. Nuclear medicine-based perfusion techniques can provide both quantitative and qualitative information on cerebral perfusion, but the PET tracers currently employed for perfusion imaging have a very short half-life, on the order of seconds to minutes, and require an on-site cyclotron or generator.4
Bolus contrast CT and MRI perfusion techniques are typically qualitative and rely on bolus tracking after administration of an exogenous endovascular tracer, iodine- and gadolinium-based contrast materials, respectively, to estimate CBF. The reliance of these techniques on administered contrast limits their use in certain patient populations, particularly patients with acute or chronic renal failure. It is well recognized that the use of gadolinium-based contrast material in patients with renal failure can cause nephrogenic systemic fibrosis, a devastating, progressive multisystem disease that has limited treatment options and no known cure.5,6 The ability of ASL to use magnetically labeled water protons as an endogenous tracer obviates these concerns and allows the acquisition of cerebral perfusion data even in the setting of dialysis-dependent renal failure.
ASL perfusion imaging can be performed with clinical imaging times less than 5 minutes and without the use of ionizing radiation or contrast material, making it ideal for use in routine clinical practice as a supplement to standard anatomic imaging. The relatively short acquisition time allows it to be added to an MR stroke protocol without significantly delaying treatment. If noncontrast MR angiography is also performed, a comprehensive evaluation of the cerebral vasculature can be achieved in a single setting without the need for the administration of contrast material.
The quantitative nature of ASL allows recognition of global hypoperfusion and hyperperfusion states that are not readily apparent with relative perfusion techniques. Moreover, the ability of ASL to reliably measure absolute perfusion permits serial imaging before and after an intervention such as endarterectomy and thrombolysis.7 Vessel selective ASL perfusion techniques allow mapping of the individual vascular territories in the brain, quantification of overall perfusion to each territory, and measurement of the contribution of each feeding artery to the territory.8,9
▪ Principles of ASL Perfusion Imaging
Most ASL cerebral perfusion imaging techniques utilize radiofrequency (RF) pulses to magnetically label (tag) water protons in blood vessels outside of the brain. After allowing a period of time for the labeled blood to reach the microscopic vasculature and interstitial spaces of the brain known as the postlabeling delay (PLD), the signal from the labeled blood in the brain is measured and used to determine CBF (Fig. 14.1). The parenchyma is imaged in both the labeled and control (i.e., unlabeled) states, and the labeled images are subtracted from the control images to remove
the static background tissue signal and isolate the signal that came from the labeled inflowing blood. The measured signal is influenced by the intrinsic T1 properties of the blood and tissue, flow rate, transit time for blood from the tagging to the imaging region, tagging efficiency, magnetic field strength, and tissue magnetization interactions known as magnetization transfer (MT) effects.7,10,11 Variations in transit time are one of the largest potential sources of error in quantification of CBF, and sensitivity to transit time variation is a major consideration and recurring theme in clinical ASL imaging.7,12 Transit time prolongation is a nonspecific finding that results from any process that increases the amount of time it takes for the tag to reach the tissues. The formula utilized to calculate CBF is complex, and a number of assumptions and corrections must be taken into consideration.10 Detailed examination of the calculation of CBF is beyond the scope of this chapter.
the static background tissue signal and isolate the signal that came from the labeled inflowing blood. The measured signal is influenced by the intrinsic T1 properties of the blood and tissue, flow rate, transit time for blood from the tagging to the imaging region, tagging efficiency, magnetic field strength, and tissue magnetization interactions known as magnetization transfer (MT) effects.7,10,11 Variations in transit time are one of the largest potential sources of error in quantification of CBF, and sensitivity to transit time variation is a major consideration and recurring theme in clinical ASL imaging.7,12 Transit time prolongation is a nonspecific finding that results from any process that increases the amount of time it takes for the tag to reach the tissues. The formula utilized to calculate CBF is complex, and a number of assumptions and corrections must be taken into consideration.10 Detailed examination of the calculation of CBF is beyond the scope of this chapter.
 Figure 14-1. Normal ASL cerebral blood flow (CBF) maps. Sequential CBF maps through the cerebellum and cerebrum in a healthy 21-year-old female. The scale to the right of the images is set to mL/100 g/min. |
The signal-to-noise ratio (SNR) of ASL perfusion imaging is inherently low. The magnetic tag decays with the longitudinal relaxation of T1, usually on the order of 1 to 2 seconds for water in blood or tissue, and there is a finite time required for the transit of labeled blood from the tagging to the imaging region. As a result, only small amounts of labeled water accumulate in the tissue, and the signal from the inflowing blood is only a small fraction (1% to 2%) of the overall tissue signal at the time of imaging. To overcome this limitation, multiple acquisitions are averaged to generate the CBF maps. Background suppression with a series of appropriately timed inversion pulses can markedly increase the ASL effect and the sensitivity of ASL for detecting dynamic changes in CBF.7
Increased SNR can also be achieved with the use of higher magnetic field strengths.10 Additionally, higher magnetic field strengths have the added benefit of lengthening T1 relaxation times and allowing more tag signal to accumulate in the tissues, but this comes at the cost of increased energy deposition in the tissues and susceptibility to artifacts.13
ASL images are acquired in two distinct and independent phases, a preparation component and an acquisition component. The independent nature of the components allows optimization of each to best suit the specific imaging application. The various preparation methods primarily differ in the way that inflowing blood is magnetically labeled. Currently employed methods include continuous ASL (CASL), pulsed ASL (PASL), pseudocontinuous ASL (PCASL), and velocity-selective ASL (VS-ASL).14
CASL was the first implementation of ASL, and it uses long and continuous RF pulses (1 to 2 seconds) to continuously invert the spins of inflowing blood as it passes through the tagging plane. The high labeling efficiency and SNR that results from the continuous tagging is offset by the need for continuous RF transmitting hardware that is not commonly available on commercial clinical scanners and the deposition of large amounts of RF energy into the
patient. The Food and Drug Administration (FDA) sets guidelines for the amount of RF power that can be deposited in tissues during an MRI examination, also known as specific absorption rate (SAR). These FDA limits can be exceeded with CASL techniques, especially if performed at high field strengths. The widespread implementation of CASL in clinical imaging has been limited by the requirement of specific hardware and high SAR.
patient. The Food and Drug Administration (FDA) sets guidelines for the amount of RF power that can be deposited in tissues during an MRI examination, also known as specific absorption rate (SAR). These FDA limits can be exceeded with CASL techniques, especially if performed at high field strengths. The widespread implementation of CASL in clinical imaging has been limited by the requirement of specific hardware and high SAR.
PASL uses relatively short RF pulses (2 to 5 milliseconds) to invert the spins in a defined slab of tissue outside of the imaging plane. The short RF pulses result in significantly decreased SAR and obviate the need for specialized hardware.15 PCASL was developed to match the high labeling efficiency of CASL to the reduced hardware requirements and lower SAR of PASL.
PCASL uses a combination of RF pulses and gradient fields to mimic the CASL inversion method without the need for additional hardware. This technique reduces RF power deposition and MT effects and provides a good balance between SNR and tagging efficiency.16
CASL, PASL, and PCASL techniques label inflowing blood at a specific location and acquire images in the tissue of interest after a period of time known as the PLD. VS-ASL labels blood based solely on flow velocity and not location, eliminating the effect of the transit time delay in quantifying CBF. To do so, a velocity-selective RF pulse is used to label blood in the imaging plane traveling above a cutoff velocity (Vc). Data are only acquired from spins that decelerate through the Vc during the PLD. As a result, VS-ASL is inherently insensitive to transit time delays but suffers from lower SNR and difficulty in choosing appropriate velocity cutoff values.
 Figure 14-2. Vascular territory imaging. Sequential vessel-selective ASL perfusion maps through the cerebrum and cerebellum with colors corresponding to the source artery (blue, right internal carotid artery; red, left internal carotid artery; yellow, left vertebral artery; light green, right vertebral artery). Note that the left internal carotid supplies the anterior cerebral artery territory bilaterally due to a hypoplastic right A1 segment and that the left vertebral artery supplies nearly the entire posterior circulation due to a diminutive right vertebral artery that primarily terminates as a posterior inferior cerebellar artery branch. (Image courtesy of Youngkyoo Jung, PhD) |
Most ASL acquisition methods rely on fast MRI sequences, such as spiral or echo-planar imaging (EPI), that have a high SNR.12 Single-shot and three-dimensional (3-D) volumetric sequences have been employed with success in ASL perfusion imaging.17 In addition to providing improved SNR, the 3-D volumetric sequences allow the acquisition of data from the whole brain as a single slab of tissue. Single-shot techniques have been developed that use background suppression to mask the signal obtained from static signal, thereby eliminating the need for a control image.18 However, these improvements come at the cost of more complex signal quantification during postprocessing.7,19
Vessel-selective ASL perfusion techniques have been developed that allow labeling of the individual arteries supplying the brain, quantitative assessment of the contribution of each individual vessel to cerebral perfusion, and accurate delineation of individual vascular territories20,21 (Fig. 14.2).
One of the most important factors in the appearance of the perfusion image obtained is the presence or absence of bipolar “crusher”
gradients during the acquisition component. Ideally, imaging would be performed once the entire volume of tagged signal has reached the interstitial spaces of the brain. In practice, some of the tagged signal remains in the blood vessels at the time of imaging. Crusher gradients are used to remove residual tagged signal in the large vessels before imaging that would otherwise elevate perfusion values in CBF quantification. However, removal of any signal from the relatively small amount of signal obtained with ASL can lower the quality of the perfusion image.15,16 When using crusher gradients, the chosen length of the PLD has a significant effect on the appearance of the CBF perfusion map and can be a source of error when calculating CBF. Although choosing a shorter PLD permits a shorter acquisition time, it can underestimate the CBF because there is less time for the tracer to reach the tissues, especially in regions with slow flow, and more signal remains in the large vessels. When the intravascular signal is crushed, the resulting image overestimates perfusion defects and shows watershed territories as having decreased perfusion (Fig. 14.3). Choosing a longer PLD allows more time for the tag to reach the tissues, resulting in a more accurate global assessment of CBF and homogeneous perfusion image. However, a longer PLD increases acquisition time and lowers the SNR of the images due to decay of the tag with the longitudinal relaxation of T1.
gradients during the acquisition component. Ideally, imaging would be performed once the entire volume of tagged signal has reached the interstitial spaces of the brain. In practice, some of the tagged signal remains in the blood vessels at the time of imaging. Crusher gradients are used to remove residual tagged signal in the large vessels before imaging that would otherwise elevate perfusion values in CBF quantification. However, removal of any signal from the relatively small amount of signal obtained with ASL can lower the quality of the perfusion image.15,16 When using crusher gradients, the chosen length of the PLD has a significant effect on the appearance of the CBF perfusion map and can be a source of error when calculating CBF. Although choosing a shorter PLD permits a shorter acquisition time, it can underestimate the CBF because there is less time for the tracer to reach the tissues, especially in regions with slow flow, and more signal remains in the large vessels. When the intravascular signal is crushed, the resulting image overestimates perfusion defects and shows watershed territories as having decreased perfusion (Fig. 14.3). Choosing a longer PLD allows more time for the tag to reach the tissues, resulting in a more accurate global assessment of CBF and homogeneous perfusion image. However, a longer PLD increases acquisition time and lowers the SNR of the images due to decay of the tag with the longitudinal relaxation of T1.
 Figure 14-3. ASL CBF maps in an 82-year-old patient demonstrate apparent hypoperfusion of the anterior and posterior watershed territories due to relatively slow (prolonged) transit times and the use of crusher gradients. Mean CBF was 38.50 mL/100 g/min. |
▪ Artifacts
Familiarity with the commonly encountered artifacts is of paramount importance when interpreting ASL images. As with any MR imaging method, patient motion is the most common source of artifacts encountered in clinical practice. Patient movement between acquisition of the control and labeled images results in a characteristic ring artifact of peripheral high signal intensity on the perfusion map. Filters have been developed to automatically detect and discard the compromised subtraction pairs that result from patient motion.22
As a consequence of the use of EPI and similar fast acquisition techniques, ASL perfusion imaging is vulnerable to inhomogeneities in the local magnetic field that result from calcifications, hemorrhage, metal hardware, and air-soft tissue interfaces. The susceptibility artifacts manifest as an artificially dark area on perfusion images that can mimic decreased or absent perfusion (Fig. 14.4). This is of particular importance when ASL perfusion imaging is employed in the postoperative evaluation of tumors. The presence of blood products in or along the margins of the resection cavity can produce artifacts that potentially mask a small focus of increased perfusion. ASL perfusion imaging is,
however, less vulnerable to susceptibility artifact than are DSCMRI perfusion techniques that rely on T2★ effects to generate perfusion maps.23
however, less vulnerable to susceptibility artifact than are DSCMRI perfusion techniques that rely on T2★ effects to generate perfusion maps.23
 Figure 14-4. Perfusion defect on ASL due to susceptibility artifact. PASL CBF map (A) demonstrates a large area of apparent hypoperfusion that correlates with susceptibility artifact due to orthodontic hardware on the baseline magnetization echo-planar image (B). |
Gadolinium-based contrast materials result in shortening of T1 relaxation times in both labeled and control tissues.24,25 ASL images are already signal poor, and this T1 shortening further decreases the measureable signal difference between both the labeled and control states. The result is almost no usable signal to generate the perfusion image. Therefore, it is mandatory to perform ASL imaging before gadolinium administration.13
▪ Clinical Applications
Normal Findings
Marked age-dependent variability in cerebral perfusion is the norm in ASL perfusion imaging.26,27 CBF begins at a low level in the perinatal period and plateaus in preadolescence (ages 4 to 11 years) with an average cortical CBF of approximately 100 mL/100 g/min. After the preadolescent peak, CBF values gradually decline to adult levels of approximately 75 mL/100 g/min. After age 30, there is a slow decline in CBF toward a minimum of 50 mL/100 g/min. Of note, the use of crusher gradients in elderly patients can cause the watershed territories to appear hypoperfused because of the relatively prolonged transit times in these regions (Fig. 14.3). Lengthening of the PLD can compensate for the relative transit time delay observed in these regions.28,29 Routine ASL perfusion images show little perfusion to the cerebral white matter due to the relatively poor perfusion of the white matter with respect to the gray matter.30 It is possible to determine CBF of the white matter, but this requires special protocols with up to 150 image pair acquisitions and averages to acquire enough signal to generate the perfusion maps of the white matter.31 Occasionally, increased signal intensity may be seen in the occipital lobes that corresponds with physiologic hyperperfusion due to activation of the visual cortex during the examination16 (Fig. 14.5). A similar pattern has been described in the frontal lobes in young and middle-aged patients.
Acute and Chronic Ischemia
Perfusion imaging is frequently utilized in the evaluation of cerebrovascular disease.16,32 Whether ischemia is caused by atheromatous thrombosis, embolic disease, vasospasm, or vasculitis, the underlying cause of the ischemic infarction is decreased cerebral perfusion. As such, ASL MR perfusion imaging is well suited for the evaluation of cerebral ischemia. Identification of tissue with decreased cerebral perfusion is critical, as it is a predictor of future ischemia.33
The goals of imaging in acute stroke are twofold. First, establish the presence, size, and location of an infarct. Second, document the existence and quantify the extent of penumbra surrounding the infarct. Penumbra, or tissue at risk for infarction, is the ischemic tissue surrounding an infarct that remains viable due to blood flow from collateral pathways34,35 (Fig. 14.6). Salvaging penumbra before it can go on to infarction is the primary goal of acute ischemic stroke care.
The perfusion-diffusion mismatch concept is widely used in imaging of acute stroke.33,36 Diffusion and ASL perfusion maps are compared for mismatch, and the region of hypoperfusion in excess of the area of restricted diffusion is considered to be penumbra (Figs. 14.6 and 14.7). Qualitative visual interpretation is usually sufficient to diagnose penumbra, but cutoff values for the diagnosis of penumbra have been published.35 It would be convenient if the distinction between infarct and penumbra could be made with ASL perfusion imaging alone, and it has been established that cerebral infarction rapidly occurs with cortical perfusion below 10 mL/100 g/min.34,37,38 and 39 However, the diminution of ASL signal encountered with low flow states makes it difficult to accurately resolve small differences in perfusion, especially when CBF drops below 15 to 20 mL/100 g/min. This limit in resolution is near the threshold for distinguishing infarct from penumbra.16 Therefore, the diagnosis of acute ischemia is best made with diffusion imaging. Recall that the ASL signal is dependent on transit times, so hypoperfusion may be a reflection of delayed transit to the tissue, such as can be seen with high-grade arterial stenosis or carotid occlusion, rather than true reduced CBF. In this setting, the ASL maps are more akin to MTT maps7,40 (Fig. 14.7).
 Figure 14-5. Physiologic regional hyperperfusion. A: ASL CBF maps show increased perfusion to the occipital lobes bilaterally without corresponding abnormality on the axial T2/FLAIR image (B). |
Studies have shown that the ASL and DSC-MRI perfusion techniques yield highly comparable perfusion values in normal cerebral tissue.41 MRI bolus gadolinium contrast perfusion techniques, such as DSC-MRI, can be used to generate relative perfusion maps, and MTT, CBV, and CBF are the common parameters utilized in clinical practice. A completed infarct demonstrates prolonged MTT, decreased CBV, and decreased CBF; whereas penumbra demonstrates prolonged MTT and normal to increased CBV. Currently, routine ASL perfusion imaging measures CBF. It is possible to measure CBV and MTT with ASL imaging, but these parameters are difficult to quantify.42,43
 Figure 14-6. Left middle cerebral artery territory hypoperfusion in an elderly patient with reported left internal carotid artery stenosis undergoing evaluation for a transient ischemic attack. ASL CBF maps demonstrate hypoperfusion of the left middle cerebral artery (MCA) territory. The patient was asymptomatic at the time of the examination. Note the relative hypoperfusion of the right anterior and posterior watershed territories. |
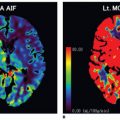
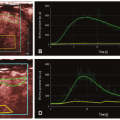
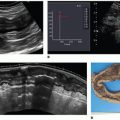
 Figure 14-7. Left MCA occlusion with penumbra but no evidence of infarct. A: Volume-rendered oblique CT angiography (CTA) shows cutoff of the distal M1 segment of the left middle cerebral artery (MCA). B: Diffusion-weighted image (DWI) obtained shortly after the CTA demonstrates no evidence of hyperintense signal to suggest an infarct. The ASL CBF map (C) and DSC-MRI negative enhancement integral map (D) show decreased perfusion and prolonged transit time throughout the left MCA territory, respectively. The lack of infarct by DWI and decreased left MCA territory perfusion is consistent with territory at risk for ischemia (penumbra). Note the similar extent and distribution of prolonged transit time on DSC-MRI and hypoperfusion on ASL. In the setting of transit time delays encountered in vascular stenosis or occlusion, ASL images most closely resemble MTT, rather than CBF. |
Cerebral perfusion patterns encountered in cerebral infarction primarily differ based on whether crusher gradients are used to suppress the intravascular signal and highlight the need to understand institution-specific spin labeling protocols before interpreting clinical images.44 Slow intravascular flow in the region of infarction causes a delay in transit time of tagged blood to the tissues. As a result, a large amount of the tagged blood remains in the large vessels at the time the crusher gradients are applied. Suppression of the intravascular signal by the crusher gradients before it can reach the tissue results in an apparent perfusion defect in the region of transit time delay that correlates closely with the MTT map that would be obtained with qualitative perfusion methods16 (Fig. 14.8). A second pattern would emerge if the same patient were to be imaged without the use of crusher gradients to suppress the intravascular signal.
The slow moving blood in the region of the infarct would manifest as serpiginous high signal intensity along the course of the blood vessels.45
The slow moving blood in the region of the infarct would manifest as serpiginous high signal intensity along the course of the blood vessels.45
 Figure 14-8. Multifocal embolic infarcts with luxury perfusion and susceptibility artifact from hemorrhagic conversion of an infarct. A: The diffusion-weighted image demonstrates hyperintense diffusion signal representing acute infarcts in the occipital lobes bilaterally and slightly hyperintense signal representing a subacute infarct in the right temporal and parietal lobes. B: The gradient image shows susceptibility artifact in the right parietal lobe due to hemorrhagic conversion of the infarct. C: The ASL CBF map demonstrates hyperperfusion of the subacute infarct in the right parietal and temporal lobes representing luxury perfusion. C, D: Demonstrate apparent hypoperfusion corresponding to the areas of hemorrhage due to susceptibility artifact. Note the hypoperfusion of the acute infarct in the left occipital lobe. |
Counterintuitive though it may be, the third pattern seen in cerebral ischemia is hyperperfusion. Restoration of blood flow by autolysis of thrombus, administration of thrombolytic drugs, or mechanical thrombolysis/embolectomy can cause localized vasodilation due to dysfunction in the autoregulation of cerebral vascular resistance.46 Conventional MRI imaging obtained in this setting demonstrates the familiar pattern of intravascular contrast enhancement.47 ASL perfusion imaging demonstrates hyperperfusion to the area of infarction, a phenomenon known as luxury perfusion46,48 (Fig. 14.8). Global hyperperfusion seen in the setting of hypoxic-ischemic encephalopathy represents an extreme form of this hyperperfusion49 (Fig. 14.9).
Related posts:
 Vascular Anatomy and Microanatomy
 CT and MR Contrast-Enhanced Tissue Perfusion Imaging: Basic Methodology, Postprocessing, Reliability Testing
 Myocardial Perfusion Imaging: MR Techniques
 Myocardial Perfusion Imaging with PET/SPECT: Techniques and Clinical Applications
 Ultrasound Perfusion Imaging: Techniques and Analytical Methods
 Contrast-Enhanced Ultrasound: Clinical Applications
Stay updated, free articles. Join our Telegram channel

Full access? Get Clinical Tree


