Comparative Anatomy


This chapter illustrates basic cardiovascular anatomy using multiple imaging modalities for correlation. Examples of normal anatomy in standard planes are given, as well as a few examples of abnormal cardiac anatomy with corresponding appearances on various imaging techniques. The goal of this chapter is to help the reader, who may be familiar with one or two cardiac imaging modalities, recognize the orientation and identify the anatomy in other imaging techniques.


First, this chapter reviews the cardiovascular borders on standard posteroanterior (PA) and lateral views of the chest and correlates these borders with coronal and sagittal reconstruction of computed tomography (CT) of the chest ( Figs. 16-1 and 16-2 ). The figures show matching colored dotted lines on both CT and chest radiography that outline the respective border-forming structures that result in differential attenuation in chest radiography.


Figure 16-1


A, Posteroanterior (PA) view of the chest in a 27-year-old woman with a history of pulmonic stenosis. In this patient, the cardiovascular silhouette on the PA view of the chest is composed of the inferior vena cava (dark red dotted line), right atrium (orange dotted line), ascending aorta (purple dotted line), aortic arch (green dotted line), left pulmonary artery (yellow dotted line), left atrial appendage (red dotted line), and left ventricle (blue dotted line). The left pulmonary artery is abnormally enlarged secondary to pulmonic stenosis. In the setting of pulmonic stenosis, the direction of flow results in asymmetric poststenotic dilatation of the left pulmonary artery. Coronal (B) and axial oblique (C) CT volume-rendered images of the chest in the same patient demonstrate thickening of the pulmonic valve leaflets (arrows) and preferential dilatation of the left pulmonary artery.


Figure 16-2


A, Lateral view of the chest in a 85-year-old woman with critical aortic stenosis. The cardiovascular silhouette on the lateral view consists of the right ventricle and right ventricular outflow tract (blue dotted line), ascending aorta (purple dotted line), right pulmonary artery (yellow dotted oval), left atrium (red dotted line), and left ventricle (white dotted line). The left and main pulmonary arteries are not well depicted in this view. Abnormal calcifications are noted on the lateral view of the chest in the expected location of the aortic valve (arrows). B, Corresponding coronal reconstruction of a nongated computed tomography image with contrast in the same patient confirms the presence of aortic valve calcifications (arrows) in this patient with known severe aortic stenosis.


From there, the chapter reviews and depicts the basic standard echocardiographic projections. Several figures illustrate the orientation of the echocardiographic planes and the probe orientation on CT volume-rendered three-dimensional (3-D) reconstruction of the chest (see Figs. 16-13 to 16-16 ). Illustration of the basic standard echocardiographic projections and their corresponding CT and magnetic resonance imaging (MRI) images is also performed ( Figs. 16-3 to 16-12 ).


Figure 16-3


Transthoracic echocardiographic left parasternal long-axis view (A) and corresponding computed tomography (B) and magnetic resonance imaging (C) images in the same plane. This projection allows visualization of the left ventricle (LV; anteroseptal and inferolateral walls), right ventricle/right ventricular outflow tract (RVOT), left atrium (LA), mitral and aortic valves, LV outflow tract, aortic root, and coronary sinus. It is a good projection to assess mitral and aortic disease when using color Doppler imaging. The left parasternal long-axis view is one of the standard views to assess left ventricular function, chamber size and LV wall thickness. Its limitations include poor visualization of the apex (echocardiography only). Ao, Aorta; RVOT, right ventricular outflow tract.


Figure 16-4


Transthoracic echocardiographic parasternal right ventricular inflow view (A) and corresponding computed tomography (B) and magnetic resonance imaging (C) images in similar planes. This projection allows visualization of the right ventricle (RV), right atrium (RA), tricuspid valve (arrows), and coronary sinus drainage into the RA. It is a good projection to assess the severity of tricuspid regurgitation with color Doppler imaging.


Figure 16-5


Transthoracic echocardiographic parasternal short-axis views at the base, middle (MID), and apical levels (A) and corresponding computed tomography (B) and magnetic resonance imaging (C) images in the same planes. These projections allow assessment of left and right ventricular segmental wall motion. It is also a good additional projection to assess the mitral valve leaflets and apparatus. The apical region is commonly difficult to assess because of interposition of the lung. LV, Left ventricle; RV, right ventricle.


Figure 16-6


Transthoracic echocardiographic parasternal short-axis view of the aortic valve (A) and corresponding computed tomography (B) and magnetic resonance imaging (C) images in the same plane. This projection allows visualization of the aortic valve, right atrium (RA), left atrium (LA), interatrial septum, right ventricular outflow tract (RVOT), and proximal pulmonary artery. The origins of the coronary arteries can occasionally be visualized. Ao, Aorta.


Figure 16-7


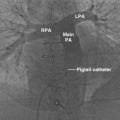
Transthoracic echocardiographic parasternal right ventricular outflow view (A) and corresponding computed tomography (B) and magnetic resonance imaging (C) images in the same plane. This projection allows assessment of the proximal pulmonary artery (PA) and the PA bifurcation. It is an important view to evaluate PA enlargement in patients with pulmonary hypertension and to assess for patent ductus arteriosus. Ao, Aorta; LPA, left pulmonary artery; MPA, main pulmonary artery; RPA, right pulmonary artery; RVOT, right ventricular outflow tract.


Figure 16-8


Transthoracic echocardiographic apical four-chamber view (A) and corresponding computed tomography (B) and magnetic resonance imaging (C) images in the same plane. This projection allows visualization of all four chambers of the heart and the interatrial septum. It is an essential projection for the determination of left ventricular volumes and left ventricular ejection fraction (biplane Simpson method). It also allows physiologic evaluation of mitral valve function, particularly mitral stenosis, because of optimal (parallel) alignment of the blood flow and the Doppler beam. The apical four-chamber view also allows assessment of LV apical function. LA, Left atrium; LV, left ventricle; RA, right atrium; RV, right ventricle.


Figure 16-9


Transthoracic echocardiographic apical five-chamber view (A) and corresponding computed tomography (B) and magnetic resonance imaging (C) images in the same plane. A five-chamber view is a modified four-chamber view that includes the aortic outflow tract and portions of the aortic root. It allows evaluation of aortic regurgitation and stenosis using Doppler imaging. Appropriate alignment of aortic stenosis jets is needed for optimal assessment. This is the ideal view to assess left ventricular outflow tract (LVOT) obstruction disorders, such as hypertrophic obstructive cardiomyopathy and subaortic membrane. Ao, Aorta; LA, left atrium; LV, left ventricle; RA, right atrium; RV, right ventricle.

Only gold members can continue reading. Log In or Register to continue

Stay updated, free articles. Join our Telegram channel

Aug 7, 2019 | Posted by in CARDIOVASCULAR IMAGING | Comments Off on Comparative Anatomy

Full access? Get Clinical Tree
Get Clinical Tree app for offline access