, Valery Kornienko2 and Igor Pronin2
(1)
N.N. Blockhin Russian Cancer Research Center, Moscow, Russia
(2)
N.N. Burdenko National Scientific and Practical Center for Neurosurgery, Moscow, Russia
X-ray computed tomography (CT) has replaced X-ray projection techniques. CT provides images of brain cross sections in “digital” quality. In CT, an X-ray tube and detectors mounted on the opposite side in relation to the object move in a circle, with the object under study being in the center. During the movement of the tube, detectors sequentially record a plurality of projection data—ray sums—from different directions. Each ray sum includes the result of X-ray attenuation from each element of the object—a voxel—through which an X-ray beam passes from the tube to the detector.
The first layered sections of the object (phantom) were built based on repeated measurements of the total X-ray attenuation by Cormak in 1963, using an algorithm developed by him, which is now used in CT scanners. This is an algorithm to restore an object from its projections (filtered back projection).
The first device for X-ray examinations of the head was presented by Ambrose and Hounsfield (1973) at the annual congress of the British Institute of Radiology. The first CT scanner—an “EMI scanner” that produced a digital image of the head cross section—was built in England in 1972. Using it, Hounsfield and Ambrose clinically tested a new method. In 1973, Hounsfield published a detailed description of his “computer cross-scan system (axial scan),” as he called this method, as opposed to the so-called longitudinal scanning.
The first CT scanner used an algebraic method to calculate the X-ray attenuation coefficients μ (x, y) to find the X-ray attenuation in each cell layer—a voxel. Hounsfield proposed to display on the screen attenuation coefficients μ Т (х, у) in each volumetric pixel (voxel) of a layer in the form of so-called CT densities or X-ray attenuation values in the tissue, taken with respect to μ water for water:
(8.1)
Units of measurement of CT density, or a CT number, are called Hounsfield units (HU) in honor of the creator of the CT method. The CT density of water and any tissue with high water content, whose μ Т ≈ μ water on the Hounsfield scale, corresponds to the value zero. The air has a negative CT density. The CT density of water and air in Hounsfield units is not dependent on the X-ray energy and takes specific, fixed values, 0 HU for water and 1000 HU for air, which are established when calibrating a CT scanner. Lung tissue and fat, due to their lower density relative to water and smaller attenuation (μ lung tissue < μ water), also have a negative CT density. Most tissues in the human body have a positive CT density. An element with the highest atomic number largest in the composition of bones and calcifications is calcium (CT density of 2000–3000 HU). The values of CT density of bone structures depend on the mineral composition of the bones.
Modern CT scanners use a range of CT densities from 1024 to 3071 HU. The greatest and the lowest values of μ on an image correspond to white and black areas, respectively, while intermediate values correspond to shades of gray. Images of transverse (axial) cross sections of an object are composed of individual elements—pixels—whose brightness in Hounsfield units is calculated by a computer based on the value of projection ray sums recorded when scanning an object.
Cormak and Hounsfield received the Nobel Prize in 1979 in Physiology or Medicine for the development of the method of computer tomography and creation of a CT scanner. CT has made breakthrough changes in neuroradiology, making possible the resolution between normal and abnormal tissues of the brain parenchyma with similar density (density resolution). This technique became known as the most important invention since the discovery of X-rays by Roentgen.
Currently neuro-oncology widely utilizes the so-called multislice scanners (MSCT) that use a multilayered matrix system of detectors and produce the data registration simultaneously for several spiral trajectories. The transition from a scanner with a single row of detectors and the period of tube rotation of 1 s to a scanner with a four-row detector system and the period of tube rotation of 0.5 s resulted in a potential eightfold increase in the efficiency of the X-ray use in scanning. The effectiveness of scanning of a 16-slice helical scanner increases 38 times. Currently, the number of detectors in scanners may be 256, 320, or more, i.e., scanners have become multidetector systems. Since during the scanning, a multislice scanner records the data for a certain area (volume) of the patient’s body, these devices are sometimes referred to as three-dimensional CT scanners. The main advantage of multislice CT is high resolution (thin slices) and high speed of scanning. An important point is a reduced irradiation dose for the patient, which is achieved by decreasing the force of the anode current of the tube, reducing the exposure time, as well as using specialized image reconstruction algorithms to effectively reduce noise when recording the signals.
With a native (without contrast enhancement) CT study, metastases often look like isodense lesions or lesions with a low density relative to the density of the normal brain matter. In most cases, it is extremely difficult to determine a clear boundary between the tumor edge and gray matter, as the tumor “merges” with the deformed cortical brain substance. The boundaries between an edema and a tumor are better visible on CT slices, since the latter has a higher CT density relative to the edema area.
Today, the use of intravenous contrast enhancement is an integral part of CT examination protocols for patients with a suspected tumor in the brain. The current generation of diagnostic CT contrast agents consists of nonionic X-ray contrast agents containing 240–370 mg of iodine per 1 ml. The use of contrast enhancement significantly improves the sensitivity and specificity of CT examinations (Kornienko and Pronin 2006). According to Evert (2005), CT without contrast enhancement achieved positive results in only 3 of 38 patients with brain metastases and only due to the detection of perifocal edema in the brain substance.
Previously, it was thought that the use of CT with contrast enhancement allows detection of lesions in the brain in almost 100% of cases (Potts and Abbott 1980). However, as real practice shows, this is not the case; exceptions are lesions of less than 5 mm in diameter and lesions located convexitally (Fig. 8.1). According to our data, a large part of metastatic lesions almost always accumulates a contrast agent (~100%). However, even if a metastasis has a relatively large (up to 2 cm) size, especially if it is located in the convexital brain regions and with a minimum edema of the brain matter, it can be difficult to determine the tumor without contrast enhancement (Fig. 8.2).
Fig. 8.1
A single breast cancer metastasis in the brain. Brain CT in the axial view before (a, b) and after (c, d) administration of the contrast agent. Along with an expressed perifocal edema (a), there is a large space-occupying lesion in the right parietal region. Prior to the introduction of the contrast agent, the lesion borders merge with the gray matter and are visualized only after an intravenous injection of the contrast agent
Fig. 8.2
A breast cancer metastasis in the brain. Brain CT before (a) and after (b) the administration of the contrast agent. In the projection of the left occipital region, there is a hypodense area (edema); a tumor lesion has a CT density similar to the CT density of the brain substance. After administration of the contrast agent, a parasagittal tumor lesion (arrows) is clearly visualized
Determination of the contrast enhancement border in cystic tumors (a thin solid component) is also difficult with small (less than 1 cm) sizes of metastases and in case of their proximity to the bone structures, in particular, with basal locations (Fig. 8.3).
Fig. 8.3
A squamous cell lung cancer metastasis in the brain. Brain CT before (a) and after (b) the administration of the contrast agent. In the projection of the basal parts of the left temporal region, there is a hypodense lesion, while the tumor is not visualized. After administration of the contrast agent, the metastasis has a clear rounded shape and signs of central necrosis, which, on the background of an edema, gives a picture of ring enhancement (arrows)
With intravenous contrast enhancement, ring enhancement—a pathognomonic sign for most metastatic tumors—can be observed, which manifests as an increased density of the boundaries of a solid part of the tumor relative to the central necrotic areas on the background of the hypodense edematous brain substance. This sign is often not related to the size of metastatic lesions (Fig. 8.4).
Fig. 8.4
A kidney cancer metastasis in the brain. In brain CT, the metastasis in the brain matter is well visualized both before (a) and after (b) intravenous administration of the contrast agent. The metastatic lesion has hyperdense characteristics before administration of the contrast agent (a). After contrast enhancement (b), there is a pronounced inhomogeneous accumulation of the contrast agent in the tumor
In multiple brain metastases, lesions with central necrosis and hemorrhages (a high-density area on CT) can be observed along with homogeneous solid lesions (usually small). The cause of a hemorrhage is likely to be the damage to the blood vessel walls located in the tumor tissue (Fig. 8.5).
Fig. 8.5
Multiple lung cancer metastases in the brain. High-density areas can be seen on a CT scan before contrast enhancement (a) (due to hemorrhages in the tumor tissue). (b) After intravenous contrast enhancement, a large number of tumor lesions of various sizes can be observed
A perifocal edema of the brain substance in metastatic lesions can manifest in different ways, regardless of the structure and size of lesions, which may be associated with differences in the time of lesion occurrence, specifics of their blood supply, their proximity to the venous structures, and specifics of their own angiogenesis. The analysis of 958 CT observations showed that there was a severe, moderate, and insignificant (mild) perifocal edema, significantly larger than the tumor area in 76% of cases, with an equal size or smaller than the size of the metastasis in 23%, respectively, and only in 1% of cases, the edema was completely missing (Dolgushin 2012) (Table 8.1).
Table 8.1
Severity of perifocal edema on CT in patients with metastatic brain lesions (n = 958)
Perifocal edema (%) | Total (n) | |||
|---|---|---|---|---|
Severe | Moderate | Mild | Absence | |
728 (76) | 172 (18) | 46 (4.8) | 12 (1.2) | 958 |
According to our data, in case of multiple metastases, a perifocal brain edema is not detected around some lesions and detected around other ones, even in the same patient (Fig. 8.6).
Fig. 8.6
Lung cancer metastases in the brain. Brain CT in the axial view before and after administration of the contrast agent. In the projections of the frontal areas, multiple metastatic tumors are observed in the right hemisphere of the brain with a pronounced perifocal edema, while there is no edema in the left one, in spite of the larger size of the lesion (a, b). Furthermore, contrast enhancement allows to identify micrometastases (a) (arrows)
An interesting but inexplicable fact is that a perifocal edema can sometimes be absent altogether, despite the large size of a metastasis: most often, this is typical of a tumor located in the posterior fossa (Fig. 8.7).

Fig. 8.7
Multiple breast cancer metastases in the brain. CT with contrast enhancement (a–c). In the projection of the basal parts of both cerebellar hemispheres, there are tumor lesions with necrosis in the center and a contrast-enhanced thin peripheral part. There is almost no perifocal edema
Routine CT is not the method of choice for the diagnosis of metastatic brain lesions in general, since even studies with contrast enhancement do not fully visualize the true picture of the disease spread. Selection of CT imaging for primary diagnosis is a single option only in clinics where there is no MRI scanner. It should be remembered that the objectives of CT studies are not only to suggest (confirm, exclude) the secondary nature of brain lesions but also to search for a possible primary source of the tumor lesions in other organs and tissues. The assumption of the metastatic character of brain lesions requires an expansion of a CT imaging area, including studies of the chest, since, according to some authors, the lungs are a sort of a “transfer post” for metastases before they spread into the brain (Nersesyants et al. 1951, 1955).
In recent years, the method of brain CT has been significantly enriched by additional protocols and techniques that include 3D visualization, angiography, and perfusion studies.
8.1 3D Imaging Technology
3D imaging technology for constructing images improved the quality of neurosurgical diagnostics in general (Turkin and Belov 2000; Kornienko and Pronin 2009a, b, c, d, 2012). An important advantage of this technique is the possibility to assess bone changes (Fig. 8.8). CT allows to clearly visualize the extent of bone involvement and destruction of bone tissue. Three-dimensional processing allows to obtain additional information to clarify the location of an abnormal lesion in relation to the surrounding tissues and helps surgeons plan the extent of a surgical intervention and the subsequent bone reconstruction.
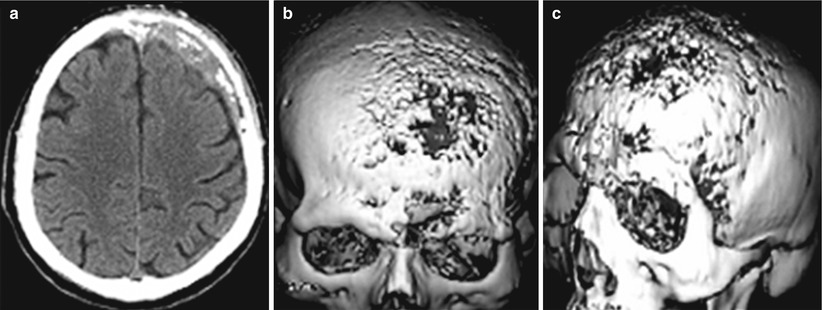
Fig. 8.8
A breast cancer metastasis in the cranial bones in a male patient. Brain CT in the axial projection (a) and a 3D reconstruction of the skull (b, c). There are significant destructive changes in the squama of the frontal bone, mostly on the left. 3D images well determine the lesion size and the involvement of the frontal, parietal and temporal bones. No changes in the brain substance (a) are identified
Most often, breast cancer (47–85%), prostate cancer (54–85%), and thyroid cancer (28–60%) metastasize to the cranial bones, followed by kidney cancer (33–40%) , lung cancer (32–40%) , melanoma (12%) , ovarian cancer (9%), esophageal cancer (5–7%), and colorectal cancer (8–13%) (Dolgushin 2012). The cranial bones are affected in 20% of all cases of bone metastases . Hematogenous metastasizing into the vertebral bodies and cranial bones can occur not only through the systemic blood flow but also through the vertebral venous plexus, via a valveless system of venous anastomoses running along the spine from the brain to the lesser pelvis. Tumor cells are brought by bloodstream into the bone marrow. They secrete a variety of factors that start to affect osteoclasts, increasing their activity and accelerating the process of bone destruction (osteolytic metastases). Hence, bone thinning and vertebral fractures occur even at low physical activity. In some tumors (e.g., in prostate cancer), osteoblasts are activated, which leads to excessive growth of bone tissue (osteoplastic metastases). The type of a metastasis, osteolytic or osteoblastic, depends on the osteoclast to osteoblast activity ratio.
Multiplanar reconstructions based on SCT, along with 3D images, increase the informative value of diagnostic data on the relationship between a metastatic tumor with brain structures, vault bones, and bone structures of the skull base, the posterior cranial fossa.
8.2 SCT Angiography (CTA)
SCT angiography (CTA) is successfully competing with subtraction angiography in the detection of vascular abnormalities. Unlike direct cerebral angiography, in head and neck vascular CTA, a contrast agent flows through the venous system. High-density and spatial resolution of spiral CT allows to construct volumetric (3D) models of the vascular system. Modern helical CT scanners have a high spatial resolution of anatomical details (512 × 512 image matrix) and high temporal resolution—the duration of one data acquisition cycle takes less than 0.5 s. Administration of 60–80 ml of a contrast agent in CTA is performed using an automatic injector at 4–5 ml/s rate. Dynamic 4D SCT allows to simultaneously receive data for both angiography (arterial blood flow) and perfusion CT (capillary blood flow). The scanning in SCT angiography is carried out with a minimum slice thickness (0.5–1.25 mm). Isolation of sections corresponding to arterial or venous phases from a dynamic series allows to construct cerebral arterio- and venograms in different projections, independent of each other. CTA, similar to cerebral AG, provides information on the sources of tumor blood supply and their relationship with the major cerebral arteries, which allows to plan a surgical access and an extent of tumor resection.
A dynamic series of sections for the capillary phase of the contrast agent transit allows to evaluate the pathophysiological specifics of perfusion in metastatic lesions, obtaining quantitative estimates of hemodynamic perfusion parameters (cerebral blood flow (CBF), cerebral blood volume (CBV), mean transit time (MTT) of blood through the vascular network, and microvascular permeability PS), as well as to monitor the effectiveness of the cancer treatment and to carry out postoperative monitoring. A quantitative evaluation as part of diagnostic studies in brain tumors is relevant for modern neuroradiology and especially neuro-oncology.
8.3 Perfusion CT (PCT)
A new trend in using the possibilities of computed tomography is a quantitative assessment of changes in density characteristics of the tissue following intravenous bolus administration of a contrast agent—CT perfusion. An important factor in this regard is the possibility of obtaining multilateral quantitative characteristics related to the hemodynamics in the brain tissue, its tumors, and their adjacent areas. Perfusion methods estimate and quantify blood flow feeding the brain tissue through the capillary system. A theoretical rationale for evaluating the basic parameters of cerebral blood flow, such as velocity (CBF) and volume (CBV) of the latter using intravascular bolus administration of a contrast agent (CA), was developed in the 1950s of the twentieth century (Meier and Zierler 1954; Kety and Schmidt 1948). With the advent of CT, Axel (1983) proposed a method for measuring cerebral perfusion via dynamic scanning: registration of CT slice images i = of the same location as the contrast agent bolus passes through the vasculature.
Related posts:

Stay updated, free articles. Join our Telegram channel

Full access? Get Clinical Tree


