- Introduction of how a CT scanner works
- The dramatic increase in the use of CT
- MDCT provides rapid and accurate diagnosis
- Ionising radiation, doses and the ALARA principle
- Dangers of ionising radiation in children and pregnant women
There have been huge technological advances in the past decade, not least in diagnostic radiology, with the advent of multidetector CT (MDCT), US, MRI, digital radiography and picture archiving and communication systems (PACS). The role of the radiologist in trauma and emergency medicine has also dramatically changed, not least with almost an exponential increase in the use of CT. In 2007, there were over 60 million CT scans performed in the USA and it is estimated that over 100 million scans will be performed this year in the USA alone.
The new generation of MDCT scanners have over 256 detectors, rotation times of less than 0.3 s, 0.4 mm resolution and they can do whole body scans in less than 10 s and acquiring isotropic voxels. The continuingly evolving software packages process the continuously changing cross sections as the table (gantry) moves through the X-ray circle producing multiplanar reconstructions to allow viewing in any plane with similar resolution and 3D images at the touch of a button (almost real time).
The images are ‘windowed’ in order to be able to demonstrate the information based on the ability of the body structures to block (attenuate) the X-ray beam.
Typical windows are shown in Table 14.1.
Table 14.1 Typical window levels and widths.
| Window level | Window width | |
| Abdomen | 60 | 360 |
| Liver | 100 | 200 |
| Lungs | 600 | 1600 |
| Bone | 800 | 2000 |
| Supratentorial | 40 | 80 |
| Infratentorial | 35 | 150 |
| Acute haemorrhage | 100 | 200 |
| Mediastium | 35 | 350 |
| Colon | 0 | 2000 |
| Cardiac | 90 | 750 |
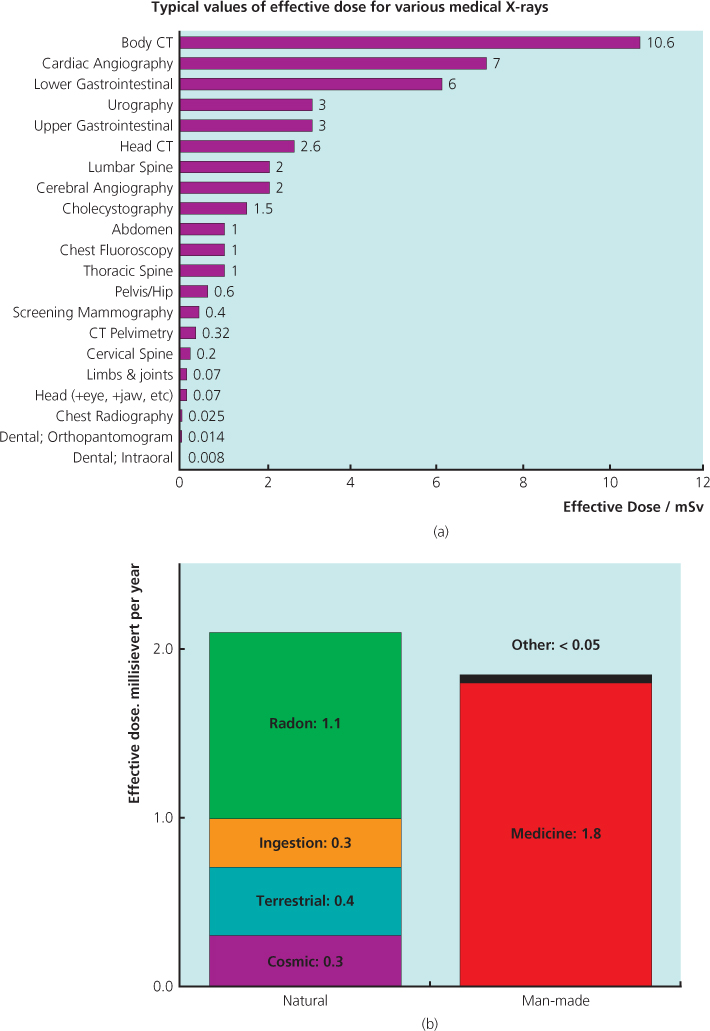
As the number of applications for CT expand with these newer generation MDCT scanners, so the radiologist’s role becomes central in the management of patients, not least in ER. Radiologists are involved not only in interpretation, but also in developing and implementing new protocols that take advantage of the new advances in CT technology. The increase in use has led to an increase in exposure to ionising radiation and although CT only represents about 20% of the general workload in radiology, it is responsible for over 90% of the radiation. Recent advances in dose reduction mean that whole body CT scans can now be done with a dose of under 5 mSv (Figure 14.1a,b). Despite this, it is essential that everyone adopts the ALARA (as low as reasonably achievable) principle when using CT and restricts the use in children and pregnant women. This chapter will concentrate on the general principles of CT and the role of CT in the acute abdomen.
Figure 14.1 (a) Graph illustrating the rapid increase in the number of CT scans per year in the USA. (b) Note the average number of CT scans per person per year is now more than 1 in 5.
Definition of the acute abdomen
A clinical syndrome of sudden onset of severe abdominal pain requiring emergency medical or surgical treatment.
Imaging of the acute abdomen has been revolutionised by multi-detector computed tomography (MDCT) and every emergency department should now have access to one. Previously a supine AXR and an erect CXR were the first line of investigations, but the AXR is now almost obsolete. Kellow et al. (2008) stated ‘when imaging is needed, the emergency physician should be encouraged to immediately request more definitive imaging modalities’ (e.g. MDCT and ultrasound (US)).
There has been a dramatic increase in the use of MDCT in the past decade, in particular in the ER.
Indications for acute abdominal CT
MDCT is accurate and cost effective for the evaluation of acute abdominal pain, and provides an earlier diagnosis. When surgical intervention may be required, CT provides additional information to facilitate and limit it to the minimum necessary, reducing patient hospital stay and peri-operative morbidity.
US and CT complement each other as US has greater accuracy than CT for some conditions and involves no ionising radiation dose. This is the major limiting factor with CT, particularly with multiple phases or repeated examinations. The average dose of an adult abdominal and pelvic MDCT is 8.4 mSv; equivalent to 3.4 years of UK background radiation or 400 chest radiographs. Young patients are more sensitive to radiation-induced carcinogenesis, so the dose from CT should be considered when requesting imaging. Magnetic resonance imaging (MRI) also has no radiation dose but does not have an important role in the initial management of the acute abdomen. Your radiologist will advise on the most appropriate investigation given the relevant clinical information.
This chapter will present a systematic approach to the findings on MDCT of the most common causes of acute abdominal conditions.
Relevant abdominal anatomy
Normal positions of the upper abdominal organs are shown in Figures 14.2 and 14.3.
Figure 14.2 (a) Level of the hepatic hilum; (b) level of the pancreas (© Commonwealth of Australia 2012, as represented by the Australian Radiation Protection and Nuclear Safety Agency (ARPANSA)).
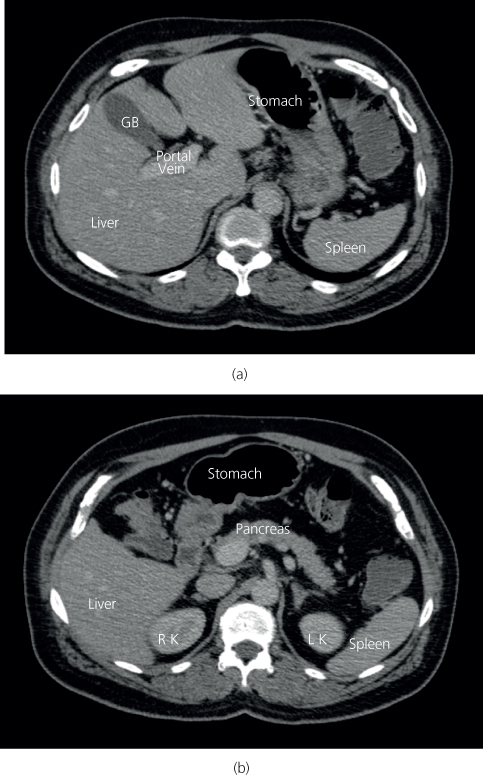
Figure 14.3 Level of the renal hilum (Informationskreis KernEnergie, Berlin).
Causes of acute abdominal pain by quadrant
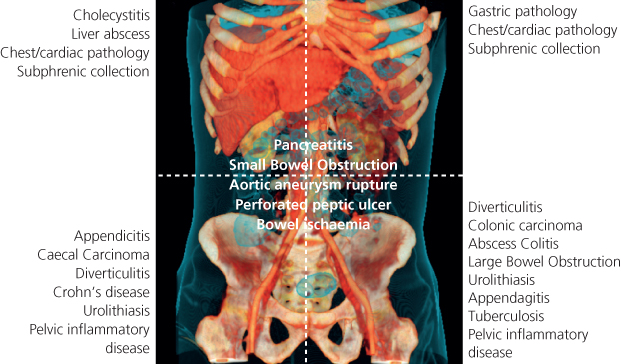
Causes of acute abdominal pain are shown in Figure 14.4 .
Figure 14.4 Causes of acute abdominal pain by quadrant.
Abdominal CT protocols
The MDCT examination will vary according to the clinical question.
Most patients with suspected acute abdominal inflammation or infection require only a single phase intravenous iodinated contrast-enhanced CT (CECT) from the diaphragm to the pubic symphysis. The portal venous phase (60–70 s delay after injection) provides optimal organ enhancement and is considered the standard protocol.
Certain indications will require non-enhanced (NECT), arterial phase imaging (30–40 s delay), or delayed imaging after several minutes, either alone or with a portal venous phase, and these will be discussed.
A CT KUB (kidneys, ureters and bladder) is a non-enhanced examination that is extremely sensitive and specific for the presence of urolithiasis (renal tract stones). The radiation dose of a CT KUB approaches that of a plain AXR, but it provides far more information. Although some extra-renal diagnoses can be made with NECT, a CT KUB should only be requested when the diagnosis of ureteric colic is suspected.
In most acute abdominal settings, there is no requirement or time to give oral contrast (drinking takes up to one hour). However, oral contrast is sometimes administered (either as water or diluted water-soluble iodinated contrast), in specific clinical scenarios.
If NECT is performed because of renal impairment or allergy, the images can be difficult to interpret; particularly in slender patients without intra-abdominal fat, as the organs and bowel are poorly defined. In such cases we recommend the use of oral positive contrast or consider using US instead.
Interpretation of abdominal CT
A systematic review is required because of the number of structures and pathologies that may be encountered.
An ABC approach is recommended (Table 14.2).
Table 14.2 ABCs approach to abdominal CT—A3B3C2DEFGHS2.
| A—All the organs | Each organ must be examined in turn |
| A—Air | Search for extra-luminal air (on lung CT window) |
| A—Appendicitis | If the appendix is not seen, it is normal or not present |
| B—Bowel | Trace bowel lumen carefully |
| Bowel dilatation, wall thickening and masses | |
| B—Bleeding | Haematoma (previous haemorrhage) |
| Contrast extravasation (on-going haemorrhage) | |
| B—Bases of lungs | Lung or pleural pathology can cause abdominal pain |
| C—Calcification | Urological tract (obstructing calculus) |
| Vascular (aneurysm and ischaemia) | |
| C—Circulation | Vessel opacification and calibre |
| D—Dirty fat | Examine the organ-fat interface carefully, especially around appendix, colon, gallbladder and pancreas |
| E—Enhancement | Increased vascularity and enhancement with inflammation |
| Decreased perfusion and enhancement with tissue oedema, ischaemia or necrosis | |
| F—Fluid | Free fluid and collections |
| Location may point to the site of pathology | |
| Infected or not? | |
| Take care to distinguish collections from bowel | |
| G—Gynaecological | Pelvic inflammatory disease, ovarian torsion and ectopic pregnancy |
| H—Hernias | Examine hernial orifices and abdominal wall |
| S—Skeleton | Examine skeleton (on bone CT window, and in sagittal/coronal planes) |
| S—Summary | Check PACS for previous imaging and reports; often helpful information is available |
CT features of conditions causing acute abdominal pain
Signs of inflammation (non-specific)
- Normal fat looks ‘clean’—dark grey/black on abdominal CT window
- ‘Dirty’ oedematous and inflamed fat is misty/streaky and lighter grey—a clue to local pathology
- Low density tissue oedema
- Mural thickening
- Inflammatory soft tissue density, enhancing mass (phlegmon, an abscess in the making)
- Free or localised fluid (Table 14.3; Figure 14.5)
- Poor or increased contrast enhancement
- Localised dilated loops of bowel (ileus)
Table 14.3 Fluid collections—CT characteristics.
| Simple | Homogeneous fluid of lower density than soft tissue |
| No wall | |
| No surrounding fat stranding | |
| Infected | Usually homogeneous or mixed low to medium density fluid |
| Thin enhancing wall | |
| Surrounding fat stranding | |
| Abscess | Heterogeneous variable density fluid |
| Less dense centrally, sometimes with gas locules | |
| Thick irregular, enhancing wall | |
| Marked surrounding fat stranding | |
| Fistula tracts | |
| Haematoma | Initially higher density than soft tissues on NECT |
| Over time, less dense from the periphery inwards | |
| May have enhancing wall in absence of infection | |
| Variable fat stranding depending on amount of blood, age and presence of infection | |
| Faeculant | Heterogeneous solid material with mixed fat, fluid or soft tissue density with tiny specks of gas |
| Usually with associated signs of infection |
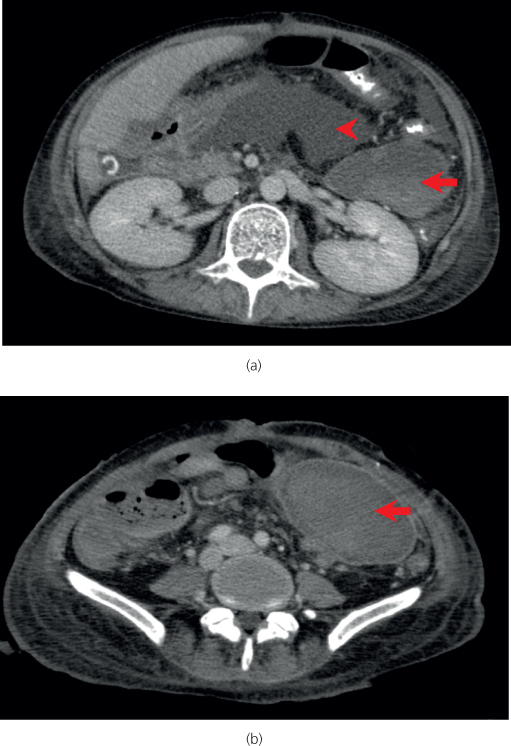
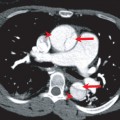
Figure 14.5 (a) Central fluid collection (arrowhead) and (b) adjacent haematoma with evidence of layering (arrow).
Signs of gastrointestinal tract perforation
Free intraperitoneal or retroperitoneal gas implies perforation (most commonly from a peptic ulcer). Pneumoperitoneum can also be caused by diverticulitis and can be present after a recent laparotomy. MDCT has a very high sensitivity and specificity for even small amounts (<2 ml) of free gas (Figures 14.6 and 14.7).
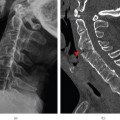
Figure 14.6 Pneumoperitoneum (arrow). On soft tissue windows (a) this localised sigmoid colon perforation may be missed, whereas on lung windows (b) it is clearly seen to be extraluminal.
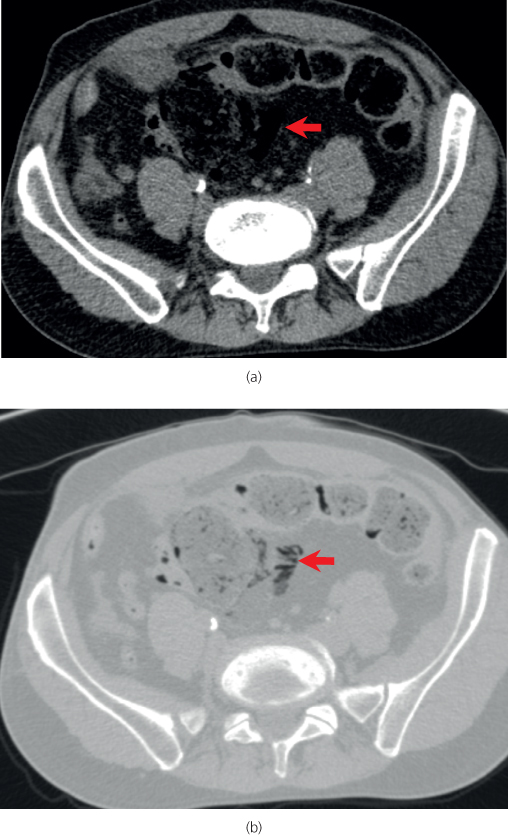
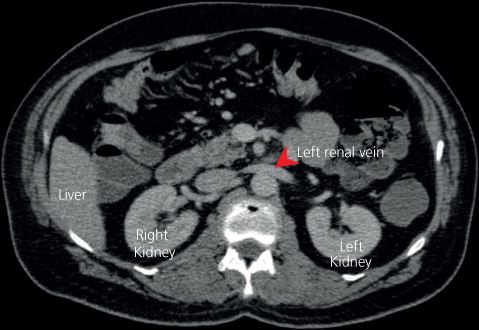
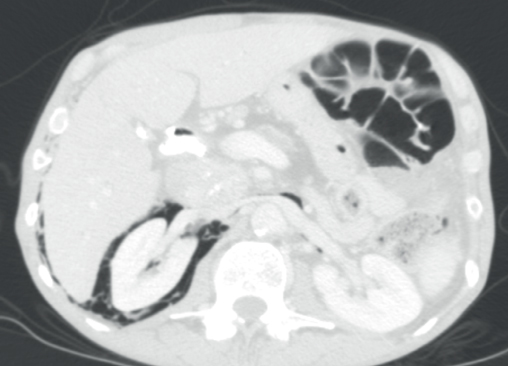
Figure 14.7 Retroperitoneal gas from a perforated duodenal ulcer surrounds the right kidney and left renal vein.
Extraluminal gas may also form in a walled off collection anywhere in the abdominal cavity, forming a gas-fluid level (as in the diverticular abscess described later) or as small bubbles of gas trapped in solid material or sited in anti-dependent locations when the patient is supine for the CT examination (as in the example of necrotising pancreatitis seen later).
Tips
- Carefully look under the anterior abdominal wall and around the liver for tiny locules of gas that may be the only sign of a perforation.
- Lung windows should always be used to search for free gas.
Acute appendicitis
Role of CT
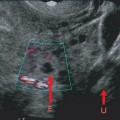
Ultrasound is the investigation of choice but CECT has a role if US is non-diagnostic or inconclusive; if the history is atypical (in 25–33%), or if complications or other pathologies are suspected such as caecal carcinoma in elderly patients. CT has increased the positive laparotomy rate, and reduced the surgical misdiagnosis rate to 5–10%.
CT features
The normal appendix appears as a tubular serpiginous structure arising from the caecal pole. It is thin walled, <6 mm in diameter, and fluid or gas filled. Box 14.1 shows the signs of acute appendicitis.
- Circumferential symmetric mural thickening
- Appendiceal enlargement
- Dilatation >7 mm with fluid
- Homogenous enhancement
- Peri-appendiceal fat haziness and stranding, or fluid (Figure 14.8)
- Calcified appendicolith (Figure 14.9)
- Mild caecal or terminal ileal thickening
- Right iliac fossa lymph node enlargement
Related posts:
Stay updated, free articles. Join our Telegram channel

Full access? Get Clinical Tree


