Fig. 1
Biocontinuum of radiation induced acute, subacute, chronic, and late effects of the CNS (with permission from Rubin and Casarett 1968)
2 Anatomy and Histology
2.1 Anatomy
The spinal cord is considered to be an extension of the central nervous system house and protected by the vertebral bodies (Fig. 2a). The spinal nerves constitute the peripheral nervous system (PNS) and will be presented sequentially after the spinal cord to provide continuity in discussing the nervous topical headings in this chapter outline.
Fig. 2
a Spinal nerves are formed from the motor and sensory fibers coming from the spinal cord. b The vascular supply of the spinal cord is shown. c Axial image of the spinal cord with different functions linked to different regions is shown. From Nelson et al. with permission. d Dermatomes are shown on the right-hand side of figure e, f. Schematic diagram of the autonomic nervous system and its chief divisions. g Cross-section of peripheral nerve (reproduced with permission from Netter)
The spinal cord consists of bundles of motor and sensory tracts, surrounded by the thecal sac, which is, in turn, encased by the spinal canal (Goetz 2003). The spine canal consists of 7 cervical, 12 thoracic, 5 lumbar, and 5 sacro-coccygeal bony vertebrae. Together the spinal canal and cord comprise the spine. While the spinal cord proper extends from the base of skull through the top of the lumbar spine—typically, the level of the first or second lumbar vertebrae in adults versus the second or third lumbar vertebrae in neonates—individual nerves continue down the spinal canal to the level of the pelvis. The conus medullaris is the cone-shaped termination of the caudal cord located in the upper lumber spinal canal. The cord is tethered to the coccyx caudally by the filum terminale, a continuation of the pia mater. The cauda equina (L. horse tail) consists of lumbar and sacral spinal nerve roots traveling inferiorly from the cord prior to emerging from the spine through the intervertebral foramina.
2.1.1 Spinal Nerves
The spinal cord is composed of 31 pairs of spinal nerves: 8 cervical (C), 12 thoracic (T), 5 lumbar (L), 5 sacral (S), and 1 coccygeal (Co). The spinal nerves consist of motor and sensory nerve roots, which exit and enter, respectively, the spinal cord at each vertebral level (Fig. 2a). The spinal nerves are named and numbered based on the level at which they emerge from the vertebral canal. C1–7 nerves emerge above their respective vertebrae, C8 emerges between the seventh cervical and first thoracic vertebrae, and the lower thoracic nerves emerge below their respective vertebrae.
2.1.2 Vascular Anatomy
Vascular anatomy of the spinal cord consists of two arcades of arterioles supplied by the anterior and posterior spinal arteries. Radiation injury to these fine arterioles is often suggested as the mechanism for radiation-induced myelopathy rather than a direct effect on the spinal cord parenchymal cells (Fig. 2b).
2.1.3 Functional Anatomy
The functional anatomy of the spinal tract of the spinal cord is depicted spatially relating spinal tract function to specific zones in Fig. 2c. Typically, the transaction of the spinal cord is characterized by the “butterfly” appearance of the longitudinal directed spinal axial tracts.
The axial image of the spinal cord reveals central gray matter containing motor neurons, surrounded by white matter made up of well-defined neuronal tracts. Broadly, these are classified as descending motor tracts, carrying either voluntary or involuntary motor signals from the cortex or brain stem to target muscle groups, and ascending sensory tracts, transmitting signals from peripheral sensory nerves to the brain. There are two principal voluntary motor fiber tracts. The lateral corticospinal tract, located in the posterolateral portion of the white matter, carries 85–90 % of all voluntary motor activity from the contralateral cerebral motor cortex. The anterior corticospinal tract carries the remaining signals, but in an ipsilateral fashion, crossing to control contralateral target muscle groups at the level of action.
The cell body of the ventral (motor) roots is in the anterior horn within the cord parenchyma. The cell bodies of the sensory nerves are located in the dorsal root ganglia. Each dorsal root carries the input from all the structures within the distribution of its corresponding body segment. Figure 2d is a dermatomal diagram showing typical sensory distributions. Note that these dermatomes overlap somewhat, dipping as they travel from the spine around the flanks to the chest and abdomen.
The autonomic system is subdivided into the sympathetic, parasympathetic, and enteric systems. In contrast to the somatic nervous systems, signals from the autonomic nervous system to target organs are largely involuntary. These target organs include the hollow viscera, exocrine glands, heart and blood vessels. The sympathetic and parasympathetic divisions provide opposing actions, with the former presiding over emergency responses (the so-called “flight-or-fight” response) and the latter mediating restoration of the body. Though many target organs of the autonomic nervous system are dually innervated, the sympathetic response is generalized, i.e., a variety of organ systems are affected simultaneously, while the actions of the parasympathetic system tend to be more discrete. Figure 2e, f illustrates the target organs for the sympathetic and parasympathetic divisions. Figure 2g is a cross section of a peripheral nerve.
The anatomy of these two divisions is also different. In the sympathetic system, the ganglia are located along paired chains on both sides of the vertebral column (the sympathetic trunk), as well as in three major collateral ganglia overlying the celiac, superior, and inferior mesenteric arteries. In contrast, the parasympathetic ganglia are located close to or within the target organ. Both systems are under complex control of the central nervous and hormonal systems, particularly the hypothalamus.
The enteric division of the autonomic system controls the functions of the gastrointestinal system along its entire length, including motility, secretion, and absorption. Though its actions are influenced by the sympathetic and parasympathetic divisions and hormonal systems, it essentially functions independently of the central nervous system and the rest of the ANS. The nerves in the enteric system are organized in two major plexuses—the mesenteric and the submucous plexus—which are distributed circumferentially around gastrointestinal viscera.
2.2 Histology
2.2.1 Spinal Cord Segment
The spinal cord segment is characterized by the “butterfly contour” which consists of an anterior median fissure and the posterior median sulcus (divide the spinal cord into half). The pia mater, a very thin layer of loose connective tissue, attaches to the surface of the spinal cord. The blood vessels at the entry of the anterior median fissure are branches of the anterior spinal artery and vein, which supply the spinal cord. In the gray matter, the neurons are present in groups, and nerve fibers enter and leave, forming a dense network. The dorsal root fibers enter the posterior horn of the spinal cord through the posterolateral sulcus, and ventral root fibers leave the spinal cord through the anterolateral sulcus (Fig. 3a).
Fig. 3
Histology: a spinal cord segments, b spinal horn neurons (with permissions from Zhang 1999), c, d spinal ganglion
2.2.2 Spinal Horn Neurons
Spinal cord horns consist of motor neurons that are multipolar cells with a large nucleus and prominent nucleolus. Nissl bodies are present in the cell body and dendrites, but not in the axons. Bundles of dendrites extend from the gray matter to the white matter, where the myelinated nerve fibers are seen in cross section. The small nuclei in both gray and white matter belong to the various glial cells, which cannot be classified in H.E.-stained preparations. In addition, blood vessels travel to gray matter, forming the blood–brain barrier with the perivascular feet of astrocytes, which are not visible in this drawing. Figure 3b shows an enlargement of the boxed area in Fig. 3a, showing details of part of the anterior horn and the white matter.
2.2.3 Spinal Ganglion
The spinal ganglion is located on the posterior nerve roots of the spinal cord. It contains the cell bodies of the pseudounipolar primary sensory neurons. The ganglion is enclosed by a dense connective tissue capsule, which divides into trabeculae to provide a framework for the neuronal cells. The neurons of the spinal ganglion are large cells with a large nucleus. Their cell bodies appear round in section and display intense cytoplasmic basophilia. Each ganglion cell body is surrounded by a layer of flat satellite cells, which provide structural and metabolic support to the neurons. Within the ganglion, fascicle of myelinated nerve fibers in both cross and longitudinal sections can be observed. In addition, blood vessels occur throughout the ganglion (Fig. 3c). Peripheral nerve is also shown (Fig. 3d).
3 Physiology and Biology
3.1 Physiology
The major neurolinks between the brain and the body is via the spinal cord through the peripheral nervous system via spinal nerves that branch out to somatic peripheral nerves or the autonomic neurons to vital viscera.
Corticospinal or pyramidal tracts provide the innervation for skeletal muscles, especially the hand. The upper motor neuron connects the brain to the spinal cord (and nerve horns), and the lower motor neurons extend from anterior horn cells via peripheral nerves to muscles.
Somesthetic system provides sensation of pain, temperature, and pressure conveyed from primary somatosensory cortex by the anterolateral spinothalamic and spinoreticular tracts. The spinal lemniscal tracts provide proprioception, vibratory, tactile sensations.
Cerebellar afferent pathways provide an important role for coordinating movement: posture, movement of head and eyes. Cerebeller efferent pathways coordinate fine, smooth coordinating movement to the proximal and distal portions of limbs.
Autonomic nervous system instructs visceral, smooth muscle, cardiac muscle, the lung, gastronal tract, the urinary system as well as salivary, lacrimal, sweat glands, the reproductive and sexual activities in addition to the peripheral vascular system. In essence, the vital viscera are regulated via the sympathetic and parasympathetic systems.
3.2 Biology: Small Animal Models
A large number of small-animal studies have been conducted to explore spinal cord tolerance to de novo radiation and re-irradiation, including time-dependent repair of such damage. A number of reports suggest regional differences in radiosensitivity across the spinal cord (Corderre et al. 2006; Phillipens et al. 2007). The clinical endpoint in most of these studies is paralysis, with the spinal cord exhibiting non-specific white matter necrosis pathologically. The principal pathogenesis of injury is generally believed to be due to vascular endothelial damage, glial cell injury, or both (Schultheiss et al. 1995; Corderre et al. 2006). Utilizing precisely focused proton irradiation of the rat spinal cord, Bijl et al. (2002, 2005) demonstrated large regional differences in cord radiosensitivity. There was a rightward shift in the dose response curve from 20.6 Gy (ED50) with full thickness irradiation, compared to 28.9 and 33.4 Gy for lateral cord treatment (wide and narrow geometry, respectively), and 71.9 Gy when only the central portion of the cord was treated. White matter necrosis was observed in all paralyzed rats, with none seen in non-responders. No damage was observed in central gray matter for doses up to 80 Gy. The differences in central versus peripheral response were attributed to vascular density differences in these regions, with a potential role for differential oligodendrocyte progenitor cell distribution. However, an alternative explanation may be the functional differences in the cord white matter regions irradiated (Nelson et al. 2009), especially given the clinical endpoint of paralysis, which would not be expected if sensory tracts were preferentially irradiated. No similar reports are available in higher order species, making application of these findings to SBRT difficult.
Various small-animal studies support a time-dependent model of repair for radiation damage to the spinal cord (Ang et al. 1983, 1993, 2001; Knowles et al. 1983; Ruifrok et al. 1994; Wong and Hao 1997). For example, Ang et al. (1993) treated the thoracic and cervical spines of 56 Rhesus monkeys to 44 Gy, and then re-irradiated these animals with an additional 57.2 Gy at 1 or 2 years (n = 36), or 66 Gy at 2 or 3 years (n = 18), yielding total final doses of 101.2 and 110 Gy, respectively. The primary endpoints of this study were lower extremity weakness or balance disturbances at 2.5 years after re-irradiation. Of 45 animals evaluated at the completion of the observation period, four developed endpoint symptoms. A re-irradiation tolerance model developed by combining this data with that of a prior study of single dose tolerance in the same animal model resulted in an estimated recovery of 33.6 Gy (76 %), 37.6 Gy (85 %), and 44.6 Gy (101 %) at 1, 2 and 3 years, respectively (Ang et al. 2001). Using conservative assumptions, an overall recovery estimate of 26.8 Gy (61 %) was obtained. In other words, after an initial course of ≈44 Gy, the cord “forgot” roughly 60 % of this dose ≈2 years later.
3.2.1 Risk Factors
Animal studies suggest that the immature spinal cord is slightly more susceptible to radiation-induced complications and the latent period is shorter (Ang et al. 1983, Ruifrok et al. 1992a, b, 1994). For example, Ruifrok et al. (1992a) found that the 50 % effect dose in 1-week-old rats was 19.5 Gy versus 21.5 Gy in adult animals (p < 0.05). The latency to complications increased from about 2 weeks after irradiation in the 1-week-old rats to 6–8 months in the adults (Ruifrok et al. 1994). While the ultimate white matter changes were the same in these animals independent of age, vasculopathy increased with increasing age at irradiation. While the literature on radiation-induced spinal cord myelopathy is sparse, care should be exercised in irradiating the pediatric spine because of the increased sensitivity of the child’s developing central nervous system and bone to ionizing radiation (Friedman and Constine 2005).
4 Pathophysiology
This schematic cross-sectional representation of the spinal cord (Fig. 4) illustrates some of the lesions associated with delayed radiation myelopathy. The typical pathologic features for radiation-induced myelopathy are tabulated in Table 1. Laboratory investigations implicate the vascular changes in arterioles as the key underlying etiology.
Fig. 4
a Delayed radiation myelopathy: The inset demonstrates the principal arterial distribution with the anterior spinal artery and two posterior spinal arteries giving off circumferential and penetrating branches. The irradiated cord may at any one time present a diversity of effects in various phases of development. The right half of this section shows a large area of necrosis (a) through which pass sclerosed branches of the penetrating vessels. The edge of this lesion retains some of the fibrillar ground substance and a few glial cells. Within, but at the periphery of, the necrosis is a broad zone of “gitter” cells or foamy histiocytes (b). There are several moderately well demarcated foci of demyelination (c) depicting early stages in the development of necrosis. The vasculature is prominent (d), especially on the right side of the cord, owing to intimal and medial thickening and a marked increase in the perivascular connective tissue [with permissions from White, D. C. (133a)]
White matter lesions | Vasculopathies | Glial reaction |
|---|---|---|
1. Demyelination: isolated nerve fibers | 1. None | 1. MicrogliaJmacrophages |
2. Demyelination: groups of nerve fibers (spongiosis) | 2. Increased vascularity | a. morphology |
3. “Inactive” malacia | 3. Telengectasias | i. rod-shaped |
a. spongiosis spheroids | ||
b. scar | 4. Hyaline degeneration and thickening | ii. foam cells |
5. Edema and fibrin exudation | iii. multinucleated | |
4. “Active” malacia | 6. Perivascular fibrosis and inflammation | b. patterns |
a. coagulative malacia | 7. Vasculitus | i. diffuse |
b. liquefactive malacia | 8. Fibrinoid necrosis | ii. focal |
i. amorphous | 9. Thrombosis | iii. perivascular |
ii. foam cell fields | 10. Hemorrhage | 2. Astrocytes |
iii. cystic | a. morphology | |
i. inconspicuous | ||
ii. Edematous | ||
iii. fibrillary | ||
b. patterns | ||
i. diffuse | ||
ii. focal | ||
iii.perivascular | ||
3. Gliosis |
5 Clinical Syndromes
Both transient and irreversible syndromes form the spectrum of radiation injuries to the spinal cord. Transient myelopathy is the most common syndrome, seen 2–4 months following irradiation. Lhermitte’s sign has been described frequently after 40–45 Gy mantle irradiation for Hodgkin’s disease, and it appears as a shock-like sensation along the spine and tingling or pain in the hands from neck flexion or stretching from the arms (160). The mechanism is presumably a transient demyelination induced by a transient vasculopathy. Very occasionally, rapidly evolving permanent paralysis is seen, possibly resulting from an acute infarction of the cord of the supplying artery being occluded.
Chronic progressive radiation myelitis is rare. Intramedullary vascular damage that progresses to hemorrhagic necrosis or infarction is the likely mechanism, although extensive demyelination that progresses to white matter necrosis is an alternative explanation. Initial symptoms are usually paresthesias and sensory changes, starting 9–15 months following therapy and progressing over the subsequent year. Diagnosis of myelitis rests on supportive information: the lesion must be within the irradiated volume, and recurrent or metastatic tumor must be ruled out. In addition, the cerebrospinal fluid protein levels may be elevated; myelography can demonstrate cord swelling or atrophy, with MRI and CT scan providing additional supportive information. Various clinical endpoints are categorized and graded in the SOMA LENT system (Table 2).
Table 2
LENT SOMA for the Spinal Cord
Spinal cord | ||||
|---|---|---|---|---|
Grade 1 | Grade 2 | Grade 3 | Grade 4 | |
Subjective | ||||
Parethesias (tingling sensation, shooting pain. Lhermitte’s syndrome) | Occasional and minimal | Intermittent and tolerable | Persistent and intense | Refractory and excruciation |
Sensory (numbness) | Minimal change | Mild unilateral sensory loss; works with some difficulties | Partial unilateral sensory loss; needs assistance for self-care | Total loss of sensation, danger of self-injury |
Motor (weakness) | Minor loss of strength | Weakness interfering with normal activities | Persistent weakness preventing basic activities | Paralysis |
Sphincter control | Occasional loss | Intermittent loss | Incomplete control | Complete incontinence |
Objective | ||||
Neurologic evaluation | Barely detectable decrease in sensation or motor weakness on one side, no effect on function | Easily detectable decrease in sensation or motor weakness on one side disturbs but does not prevent function | Full Brown-Sequard syndrome, loss of sphincter function, prevents function | Complete transection disabling, requiring continuos care |
Management | ||||
Pain | Occasional non-narcotic medication | Persistent non-narcotic medication, intermittent low dose steroids | Intermittent high dose steroids | Persistent high dose steroids |
Neurologic function | Needs minor adaptation to continue working | Regular physiotherapy | Intensive physiotherapy plus regular supervision | Intensive nursing and/or life support |
Incontinence | Occasional use of incontinence pads | Intermittent use of incontinence pads | Regular use of incontinence pads or self-catheterization | Permanent use of pads or catheterization |
Analytic MRI | Edema | Localized demyelination | Extensive demyelination | Necrosis |
CT | Assessment of swelling, edema, atrophy | |||
MRS | Assessment of chemical spectra | |||
PET | Assessment of metabolic activity | |||
Serum | Assessment of myelin basic protein levels | |||
CSF | Assessment of total protein and myelin basic protein | |||
5.1 Detection
In the initial evaluation, a detailed history and physical exam, with special attention to neurologic signs and symptoms, should be obtained. These data are essential for establishing a baseline status against which changes in neurologic function can be measured, correlating functional deficits with anatomic lesions identified on imaging (below), and identifying patient factors, such as diabetes, peripheral vascular disease, pre-existing cognitive deficits, social support resources and recent/concurrent medications, that will influence the choice of and response to therapy.
5.1.1 Electromyography
Electromyography (EMG) and nerve conduction studies (NCS) are typically performed in tandem to determine the action potential and conduction velocity of nerves, respectively (Falah et al. 2005; Corbo and Balmaceda 2001). EMG/NCS neuropathies can result from a variety of cancer-associated causes besides radiation-induced injury, including chemotherapy, tumor compression/invasion of nerves, surgical changes, and paraneoplastic syndromes. In patients with radiation-induced fibrosis, these electrodiagnostic studies often reveal fibrillations, positive sharp waves, and myokymia (Corbo et al. 2001; Mullins et al. 2007).
While history, physical exam, electrodiagnostic testing, and MRI studies can reveal abnormalities in nerves and associated structures, it is frequently difficult to establish the proximal cause of those abnormalities (Lederman and Wilbourn 1984; Planner et al. 2006). While a study of 18FDG PET in breast cancer patients with brachial plexopathy suggested that the lack of hypermetabolic activity was characteristic of radiation-induced plexopathy (Ahmad et al. 1999), several case reports describe hypermetabolic purely radiation-induced lesions associated with transient myelopathy (Chamroonrat et al. 2005; Uchida et al. 2008).
5.2 Diagnosis
5.2.1 Magnetic Resonance Imaging
Magnetic resonance imaging (MRI) is typically the imaging modality of choice for assessing malignancies involving the spinal cord and brachial plexuses (Grossman and Yousem 2003). Accurate, precise delineation of the extent and location of tumor in relation to normal tissue structures is necessary to identify target lesions for radiation therapy and quantitatively gauge the response of tumor to radiation therapy. In addition, computed tomography is frequently critical to both plan radiation treatment and provide precise localization and visualization of bony structures and/or fiducial markers for image-guided radiotherapy (Yin et al. 2006). MRI myelopathy can accurately delineate the segment of spinal cord irradiated through degeneration of the axonal tracts distal to injury (Rubin et al. 1994). An example of radiation-associated myelitis is shown in Fig. 5.
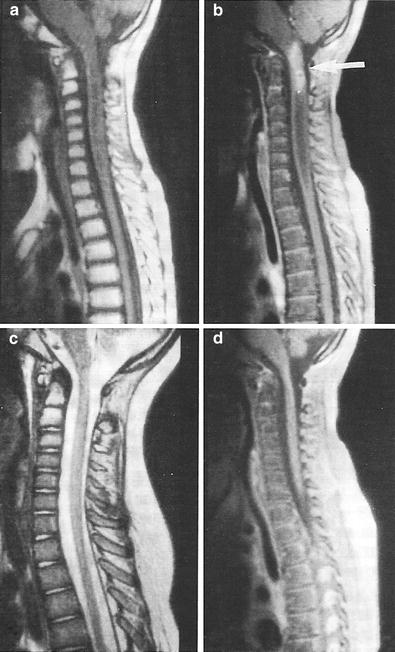
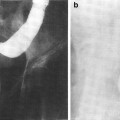
Fig. 5
Postradiation changes in the spinal cord: chemoradiation myelitis in 8-year-old girl with history of chemotherapy and radiation for acute lymphocytic leukemia (ALL). One year after the therapy, she developed limb weakness and urinary retention. a Sagittal T1-weighted magnetic resonance (MR) image reveals hyperintense marrow and edematous cervical cord. The bone marrow shows signs of radiation changes with increased signal intensity in C1 and C2. b Sagittal T1-weighted postgadolinium MR image with fat saturation demonstrates an enhancing mass in the upper cervical cord (arrow). Because there was no evidence of ALL relapse, this was presumed to represent radiation myelitis. c Sagittal fast spin echo T2-wieghted image 1 year later demonstrated an essentially normal cord. d Sagittal T1-weighted postgadolinium MR image with fat saturation shows that the enhancing lesion has resolved (with permission from Braggs et al. 2002)
6 Radiation Tolerance
6.1 Dose, Time, Fractionation
The most widely observed clinical dose limits are 45 Gy in 22–25 fractions of 1.8–2.0 Gy, and a TD5 of 50 Gy has been suggested. However, this TD5 value is overly conservative. While a 5 % risk might be considered clinically acceptable for other organs, a 5 % risk is clearly unacceptable for the spinal cord given the severe clinical consequences of myelopathy. Thus, the historical TD5 value was more accurately describing the dose that would yield a clinically acceptable complication rate (closer to ≈1 per 1,000; i.e., the TD0.1).
Published reports of radiation myelopathy rates for 335 and 1,946 patients receiving radiotherapy to the cervical and thoracic spine, respectively, are summarized in Tables 3 and 4. While a few of these patients received relatively high doses/fraction, none were treated using stereotactic techniques to exclude a portion of the circumference of the cord. Note that the dose to the cord is the prescribed dose reported in those studies; typically, dosimetric data were not available to calculate the true cord dose. The probability of myelopathy was derived from the raw percentage of patients developing myelopathy by correcting for the estimated overall survival as described by Schultheiss (2008).
Table 3
a. Summary of published reports of cervical spinal cord myelopathy in patients receiving conventional RT (modified from Schultheiss 2008)
Institution | Dose (Gy) | Dose/fraction (Gy) | Cases of myelopathy/total number of patients | Probability of Myelopathya | 2-Gy dose equivalentb |
|---|---|---|---|---|---|
McCunniff (1989) | 60 | 2 | 1/12 | 0.090 | 60.0 |
65 | 1.63 | 0/24 | 0.000 | 56.6 | |
Abbatucci (1978) | 54 | 3 | 7/15 | 0.622 | 72.8 |
Atkins (1966) | 19 | 9.5 | 4/13 | 0.437 | 68.6 |
Marcus (1990) | 47.5 | 1.9 | 0/211 | 0.000 | 45.0 |
52.5 | 1.9 | 0/22 | 0.000 | 49.8 | |
60 | 2 | 2/19 | 0.118 | 60.0 | |
Jeremic (1991) | 65 | 1.63 | 0/19 | 0.000 | 56.6 |
Table 4
Summary of published reports of thoracic spinal cord myelopathy in patients receiving conventional RT [modified from Schultheiss (2008)]
Institution | Dose (Gy) | Dose/fraction (Gy) | Cases of myelopathy/total number of patients | Probability of Myelopathya | 2-Gy dose equivalentb |
|---|---|---|---|---|---|
Hazra (1974) | 45 | 3 | 1/16 | 0.093 | 60.7 |
Choi (1980) | 45 | 3 | 0/75 | 0.000 | 60.7 |
Abramson (1973) | 40 | 4 | 4/271 | 0.063 | 67.9 |
Fitzgerald (1982) | 40 | 4 | 6/45 | 0.332 | 67.9 |
Madden (1979) | 40 | 4 | 1/43 | 0.284 | 67.9 |
Guthrie (1973) | 40 | 4 | 0/42 | 0.000 | 67.9 |
Dische (1988) | 34.4 | 5.7 | 13/145 | 0.278 | 78.9 |
Hatlevoll (1983) | 38 | 3 × 6 Gy + 5 × 4 Gy | 8/157 | 0.196 | 77.0 |
38 | 3 × 6 Gy + 3 × 4 Gy + 2 × 2 Gy | 9/230 | 0.151 | 67.4 | |
Eichhorn (1972) | 66.2 | 2.45 | 8/142 | 0.256 | 76.5 |
Scruggs (1974) | 40 | 5 × 4 Gy + 8 × 2.5 Gy | 2/248 | 0.028 | 57.4 |
18.4 | 9.2 | 3/524 | 0.032 | 64.5 | |
39.8 | 3.06 | 2/153 | 0.062 | 54.5 |
Using the above data, Schultheiss (1986, 2008) estimated the risk of myelopathy as a function of dose. The 2-Gy equivalent dose using the LQ model with the α/β ratio of 0.87, is calculated for each study (Schultheiss 2008) in Tables 3 and 4. A good fit to the combined cervical and thoracic cord data reportedly was not possible and separate analyses were performed. For the cervical cord data, values of D50 = 69.4 Gy and α/β = 0.87 Gy were obtained with a Pearson χ2 statistic of 2.1 for 5 degrees of freedom, providing a reasonable fit of the model as shown in Fig. 6a. The 95 % confidence intervals were 66.4–72.6 Gy for D50 and 0.54–1.19 Gy for α/β. At 2-Gy per fraction, the probability of myelopathy is 0.03 % for a total dose of 45 Gy and 0.2 % at 50 Gy. However, the further one gets into the tail of the dose–response function, the more dependent the estimates become on the statistical distribution used to model this function.
Fig. 6
a The dose–response function for the myelopathy of the cervical spinal cord and associated data points are from Table 3 (Reprinted with the permission of International Journal of Radiation Oncology Biology Physics). b The dose–response function for myelopathy of the cervical cord (solid line) and data points for the thoracic spinal cord are derived from Table 4 (Reprinted with the permission of International Journal of Radiation Oncology Biology Physics). c Radiation tolerance: dose/volume constraints. The right y-axis indicates the tolerance dose ranges for the TD5–50 for whole organ irradiation. The left axis relates dose to risk for volumes irradiated. (Modified with permissions from Rubin et al. 1997). d ED50 for rats irradiated with protons to various lengths of cord (with permissions from Bijl et al. 2002, 2003)
Because of the dispersion in the thoracic cord data, a good fit of these data reputedly could not be obtained. As shown in Fig. 6b, most of the thoracic cord data points lie to the right of the dose–response curve for the cervical cord. This suggests that the thoracic cord is less radiation sensitive than the cervical cord. For external beam radiotherapy (EBRT) to the spinal cord in 2 Gy daily fractions, the risk of myelopathy appears low (<0.2 %) at 50 Gy and modest (<10 %) at 60 Gy, with an approximately 50 % risk of myelopathy at 70 Gy, based on the above analysis. Note that earlier “consensus opinions” (Withers et al. 1988; Emami et al. 1991) suggested more conservative guidelines for spinal cord tolerance, likely as a result of the concern for the severe disability resulting from spinal cord damage (Fowler et al. 2000).
There is an increased risk of myelitis following use of a continuous hyperfractionated accelerated radiation treatment (165), suggesting that a 6-h interval between treatments is insufficient to allow for significant repair. Shortening the interval between treatments from 24 h to 6–8 h reduces spinal cord tolerance by 10–15 %. In animal models, the dose rate also influences risk (van der Kogel 166, 167).
6.2 Dose/Volume Constraints
A suggested association between dose, volume, and risk of myelopathy is shown in Fig. 6c. The right y-axis indicates the tolerance dose ranges for the TD5–50 for whole organ irradiation. The left axis relates dose to risk for variable volumes irradiated. (Modified from Rubin et al. 1997). The volume effect has been assessed in animal studies.
In recent series of experiments, four different lengths of the rat spinal cord (2, 4, 8, and 20 mm) were irradiated with single doses of protons (150–190 MeV) using paralysis as functional endpoint. A minor increase in tolerance was observed when the irradiated rat cord length was decreased from 20 mm (ED50 = 20.4 Gy) to 8 mm (ED50 = 24.9 Gy), whereas a large increase in tolerance was observed when the length was further reduced to 4 mm (ED50 = 53.7 Gy) and 2 mm (ED50 = 87.8 Gy). These results suggest that for small field lengths there may be a volume effect and that tiny overlaps of RT fields in the clinic might be tolerable, but that anything more than a few mm would not be tolerated.
These investigators also addressed the significance of partial volume irradiation and inhomogeneous dose distributions to the cord using a “bath and shower” approach. “Bath” irradiation represents doses to a larger volume that are on both sides of a “shower” irradiation focused on a smaller volume (i.e., a low dose bath with a focal hot spot shower in the middle). For different bath doses, the ED50 for spinal cord damage was determined, and compared to the situation with a bath dose of zero (i.e., homogeneous irradiation of the spinal cord to the shower dose). With a bath dose of zero, the ED50 is relatively high (e.g., >80 Gy for a 2 mm length of cord irradiated). The ED50 values drop dramatically even at modest bath doses (Fig. 6d). The effect of the bath dose was greatest at smaller size shower doses, and was relatively modest when the shower field lengths increased to 8 mm (Bijl et al. 2002, 2003).
In concert, one interpretation of these data is that there are neighborhood effects that ‘protect/mitigate’ the cord injury, but that these protective effects can extend only a few mm in length. For example, one might hypothesize that a 2 mm focus of high dose radiation (i.e., shower in the above vernacular) leads to local damage that is “mitigated by the neighborhood” only a mm or two away. As the focus of high dose is enlarged, there is less capability for such mitigation since the distance between the irradiated and non-irradiated tissues is, on average, greater. The bath dose, that is low enough not to cause any evident functional consequences by itself, appears to reduce the ability of the neighboring tissues to provide mitigation. The clinical implications of these data are interesting. Inadvertent overdoses of the cord may occur in the setting of abutting RT fields (e.g., via mis-calculated gaps, or set-up errors). At first blush, the data on the far left-hand side of Fig. 6d might suggest that tiny regions of overlap (e.g., 1–2 mm) might be tolerable, but that anything more than a few mm would not be tolerated. However, even with very small overlaps of 1–2 mm, the dose to the adjacent spinal cord would largely eliminate this ‘neighborhood mitigation effect.’ Thus, any overlap of abutting fields is likely not tolerable in the clinic.
7 Chemotherapy
A variety of chemotherapeutic agents have been implicated to be toxic to the central nervous system. The chemotoxic drugs are similar to those causing encephalopathy (Table 5).
Table 5
Antineoplastic drugs associated with cerebral encephalopathy
Antimetabolites |
High-dose methotrexate |
5-Flurouracil (with allopurinol) |
Cytosine arabinoside (ara-C) |
Fludarabine |
PALA (N-[phosphonacetyl]-L-asparate) |
Alkylating agents |
Cisplatin |
Ifosfamide |
BCNU (carmustine) |
Spiromustine |
Plant alkaloids |
Vincristine (associated with inappropriate antidiuretic hormone secretion) |
High-dose regimens used in bone marrow transplantation |
Nitrogen mustard |
Etoposide |
Procarbazine |
Miscellaneous |
Mitotane |
Misonidazole |
L-asparaginase |
Hexamethylmelamine |
Interleukin-2 |
In rats, the use of various chemotherapy agents during radiotherapy has been shown to increase the radiosensitivity of the spinal cord. Administration of intrathecal ara-C (Ruifrok et al. 1993) or intraperitoneal fludarabine (Grégoire et al. 1995) immediately prior to irradiation of the spinal cord showed an enhanced effect on radiation-induced injury, yielding a dose modifying factor of 1.2–1.3. There are rare reports of radiation myelopathy at relatively low doses in human patients post chemotherapy. Ruckdeschel et al. (1979) found a single case of radiation myelitis in a series of 15 lung cancer patients receiving cyclophosphamide, adriamycin, methotrexate, and procarbazine followed 3 weeks later by ten 300-cGy fractions to the mediastinum and lesion. The maximum dose to the cord was less than 21 Gy (BED ≈ 43Gy2). Chao et al. (1998) described a case of radiation myelopathy in a patient with non-Hodgkin’s lymphoma initially treated with VACOP-B chemotherapy and autologous bone marrow transplant followed by consolidative radiation to the mediastinum; the upper thoracic spine received a maximum dose of 40.3 Gy in 22 fractions (BED ≈ 81Gy2). Seddon et al. (2005) reported fatal radiation myelopathy in a patient who received 50 Gy to the cervical spinal cord in 30 fractions (BED ≈ 92Gy2) 4 months after treatment with busulfan and melphalan for a paraspinal Ewing sarcoma. Many of these agents are neurotoxic in their own right (Lee et al. 1986) and caution is advised in their concurrent use during irradiation of the central nervous system (Schultheiss et al. 1995).
7.1 Combined Modality
The most recognized example of adverse combined radiation and drug effects involves methotrexate (Fig. 7) (Bleyer 1981; Bernaldez-Rios et al. 1998; Evans et al. 1981). Large doses of methotrexate alone can lead to leukoencephalopathy; however, this complication is seen most often when the drug is given intrathecally and/or in high doses intravenously combined with whole brain irradiation.
Fig. 7
Encephalopathies are induced by both irradiation and chemotherapy and can be acute and chronic. a A Venn diagram illustrates the pathophysiology of delayed neurotoxic sequelae seen months to years later associated with CNS irradiation, intrathecal methotrexate, and high-dose intravenous methotrexate, alone or in combination. b Incidence is greatest for all modes combined. In this Venn diagram, the incidence is very low when either irradiation or chemotherapy is administered alone, but it increases considerably (up to 45 %) when combined. The mechanism is believed to be attributable to alteration of the blood–brain barrier by irradiation, followed by direct entry of methotrexate into the CNS, causing diffuse necrosis and damage. (From Evans et al. 1981, with permission)
It had been assumed that most drugs would not cause CNS late effects because of their inability to cross the blood–brain barrier. However, because radiation alters and increases capillary permeability, (Rubin et al. 1994) a combined-modality regimen may lead to systemically administered drugs entering the brain (Williams et al. 1993; Qin et al. 1997). In addition, damage to the vascular choroid plexus can affect methotrexate clearance, decreasing turnover, thereby leading to higher drug concentrations. Therefore, combination therapy sequencing for brain neoplasms should be approached with caution (Remsen et al. 1997). For example, a 1998 study employing a combination of high-dose systemic methotrexate with intrathecal methotrexate followed by whole brain irradiation for primary CNS lymphoma has observed a high rate of severe leukoencephalopathy in patients older than 60 years of age (Abrey et al. 1998).
Related posts:
Stay updated, free articles. Join our Telegram channel

Full access? Get Clinical Tree


