, Maja Guenthert1, Philippe Gasser1, Falk Lucas1 and Roger Wepf1
(1)
Electron Microscopy ETH Zurich (EMEZ), ETH Zurich, Zurich, Switzerland
Abstract
Correlative light and electron microscopy aims at combining data from different imaging modalities, ideally from the same area of the one sample, in order to achieve a more holistic view of the hierarchical structural organization of cells and tissues. Modern 3D imaging techniques opened up new possibilities to expand morphological studies into the third dimension at the nanometer scale. Here we present an approach to correlate 3D light microscopy data with volume data from focused ion beam-scanning electron microscopy. An adapted sample preparation method based on high-pressure freezing for structure preservation, followed by freeze-substitution for multimodal en bloc imaging, is described. It is based on including fluorescent labeling during freeze-substitution, which enables histological context description of the structure of interest by confocal laser scanning microscopy prior to high-resolution electron microscopy. This information can be employed to relocate the respective structure in the electron microscope. This approach is most suitable for targeted small 3D volume correlation and has the potential to extract statistically relevant data of structural details for systems biology.
Key words
Correlative light and electron microscopy (CLEM)CLSMFIB-SEMHigh-pressure freezingFreeze-substitutionPre-embedding labeling3D volume imaging1 Introduction
Correlative light and electron microscopy (CLEM) has become a powerful tool in life science [1]. The rationale is to combine data from light and electron microscopy obtained from the identical area of one sample to obtain a holistic understanding of the ultrastructure of living systems. Expanding this morphological context description into the third dimension, even at nanometer scale, has become available with the introduction of 3D imaging techniques in both light and electron microscopy, such as confocal laser scanning microscopy (CLSM) and focused ion beam-scanning electron microscopy (FIB-SEM).
The key element to morphological investigations in life science is the description of lipid membranes delineating intracellular compartments, i.e., organelles or vesicles, as well as cell borders and intercellular connections. As these membranes are only 4.5–5 nm thick, they are invisible to light microscopy (LM) but can be resolved by electron microscopy (EM). FIB-SEM has proven to be a valuable application for ultrastructural investigations in life science [2, 3], offering the combination of precise, site-specific milling of material from a bulk sample, using a focused beam of gallium ions, with high-resolution SEM imaging. Thus, the FIB can be used as a tool for serial sectioning to produce stacks of consecutive planes. This alternate sectioning and imaging by SEM allows automated recording of large volumes [4, 5]. With modern FIB-SEM platforms, an imaging resolution of 2–3 nm can be achieved. And routine overnight FIB-SEM volume imaging can cover cross sections of up to 50 × 40 μm2. With a slice thickness of 5–10 nm, these stacks can expand to several 10 μm in the z-axis. Thus, FIB-SEM can be considered a valid alternative to standard serial-section transmission electron microscopy (TEM) for volume imaging, because the preparative effort is reduced and a better z-resolution compared to serial sections can be achieved. Furthermore, FIB-SEM enables the recording of isotropic voxels, which is an advantage when it comes to 3D reconstruction and modeling of the results.
The here described correlative approach for embedded biological specimen combines FIB-SEM with preceding screening of the same specimen with CLSM. It is based on pre-embedding fluorescence labeling, which facilitates the identification of the region of interest (ROI) with CLSM for targeted FIB-SEM investigation, and provides a 3D overview of the biological context.
The necessary specimen preparation for this 3D CLEM approach requires a compromise, as dyes and specific labels for LM are often incompatible or only partially compatible with heavy metal salts used for EM. The ideal sample preparation results in a sample suitable for both en bloc CLSM and FIB-SEM and has to meet the following requirements: firstly, the ROI has to be accessible for CLSM imaging as well as for FIB-milling, i.e., near the surface (of the specimen); secondly, the material should facilitate stable and artifact-free milling conditions in FIB-SEM; and thirdly, en bloc fluorescence imaging should be possible while providing optimum signal-to-noise ratio for backscatter electron imaging. Resin embedding meets these requirements in as much as, first, the ROI can easily be uncovered by trimming or ultramicrotomy as is routinely done for TEM samples and, second, the material is sufficiently homogenous in terms of hardness and density to enable artifact-free FIB-milling [4].
The introduction of fluorescent dyes prior to embedding was shown to be a powerful adaptation of standard embedding protocols for EM, enabling en bloc CLSM investigation prior to processing the sample for either TEM or (FIB-)SEM [6, 7]. In this chapter we will focus on freeze-substitution (FS) after high-pressure freezing (HPF), rather than embedding protocols for chemically fixed samples. However, the principle of pre-embedding fluorescence labeling would also be applicable for this type of specimen preparation.
Since its introduction in the 1960s [8–10], HPF has proven in numerous applications and among various kinds of samples [11–20] to preserve biological tissue better and closer to its lifelike state than any other fixation method for EM [21–23]. Its pinpoint precision of preserving the functional locus of biomolecules has been demonstrated for various sample types [24–29]. For ultrastructural investigations, especially when statistical data is to be collected with respect to the cell size, HPF is preferable to chemical fixation, as it is faster and avoids fixative-induced artifacts such as shrinkage or membrane perturbation [22, 30, 31]. HPF has the additional benefit of being the fastest fixation method, which makes it indispensable for the study of very fast cellular processes, e.g., virus entry into host cells [32].
The application of fluorescent dyes during FS avoids the drawback of interfering with the preservation of ultrastructure, as would be the case with other common pre-embedding labeling techniques which involve, e.g., permeabilization of cell membranes to facilitate the introduction of specific labels or extensive treatment with reagents to trigger site-specific reactions [33, 34]. Although these methods would enable specific labeling for CLEM, the artifacts induced by this kind of labeling may result in changes of ultrastructure or even redistribution of intracellular and extracellular components [30]. Fluorescent Labeling during FS after HPF avoids these artifacts. However, it comes at the price of specificity of labeling. The fluorophores introduced during FS offer only semi-specific quality of labeling. Lipophilic domains, such as lipid membranes, can be labeled reliably using, e.g., DiIC18, DiD, or DiO6. However, for this specific application, most common nuclear stains do not yield suitable staining results. But some general histological dyes such as acridine orange, Safranin O, or Nile blue sulfate can be used to stain nuclei, if needed (see Fig. 1). Staining results may vary even between different types of cell cultures. It is therefore strongly recommended to evaluate different dyes for each new application. A complete list of the dyes we have tested so far for different applications and specimens is given in Table 1. This list—although far from being comprehensive—may serve as a guideline when planning new experiments. But the combination of the lipophilic dye DiIC18 and the histological stain Nile blue sulfate produced suitable results for most of the tested sample types and can be recommended for initial testing (see Fig. 1).
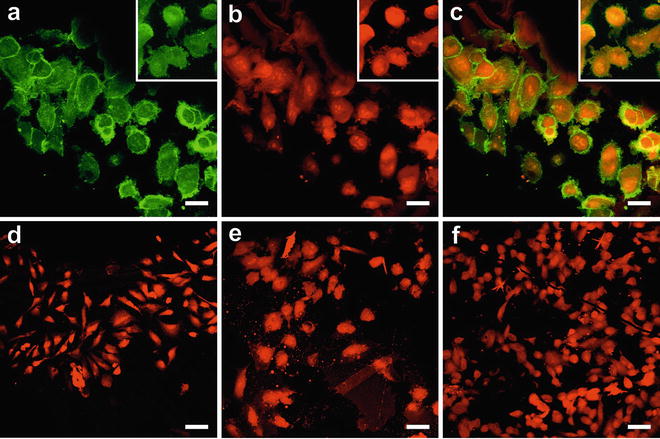
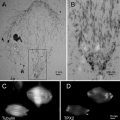
Fig. 1
Pre-embedding fluorescence staining during FS. All samples were high-pressure frozen and freeze-substituted in acetone containing either uranyl acetate alone or a combination of uranyl acetate and osmium tetroxide, as well as fluorescence dyes. Subsequently, the samples were embedded in HM20. (a–c) HeLa cells stained with DiIC18 to label cell membranes (a) and Nile blue sulfate for staining of the nucleus and cytosol (b), (c) merge of both signals. Large images of cell cultures represent samples labeled with uranyl acetate only; insets show the respective fluorescence when osmium tetroxide was applied additionally. Only the fluorescence of DiIC18 is slightly impaired by application of osmium tetroxide (inset), while the Nile blue signal is not affected. (d–f) HeLa cells labeled with acridine orange (d), Safranin O (e), or Nile red, respectively (f). These three samples were freeze-substituted with uranyl acetate alone. The dyes stain the entire cell but rather unspecifically. Figure adapted from Lucas et al. [7], with the permission of Elsevier Ltd. Scale bars = 25 μm
Table 1
Fluorescent dyes suitable for application in freeze substitution
Dye | Tested with | Highlighting | Image quality |
|---|---|---|---|
1.8 ANS | Skin (human) | Collagen and/or elastic fibers | + |
Acridine orange | Skin (human) | Nuclei, cytoplasm, stratum corneum | ++ |
Liver (mouse) | Nuclei, cytoplasm | + | |
Lymph node (mouse) | Nuclei, cytoplasm | ++ | |
HeLa cells | Cytoplasm, nuclei | + | |
Mung bean roots | Bacteria population of root nodules | ++ | |
BODIPY 560 | Skin (human) | Nuclei, cell membranes, stratum corneum, whole dermis | + |
DAPI | MDCK cells | Entire cell, unspecific | − |
DCVJ | Skin (human) | Nuclei, collagen and/or elastic fibers | + |
DiD | Skin (human) | Lipophilic domains, cell membranes | + |
Liver (mouse) | Lipophilic domains | ++ | |
HeLa cells | Cell membranes | ++ | |
MDCK cells | Lipophilic domains, cell membranes (also intracellular) | ++ | |
DiIC18 | Skin (human) | Lipophilic domains, cell membranes | ++ |
Liver (mouse) | Lipophilic domains, cell membranes | ++ | |
HeLa cells | Cell membranes | ++ | |
MDCK cells | Cell membranes | + | |
Nematodes (C. elegans) | Lipophilic domains | − | |
DiOC6 | Skin | Cytoplasm (lipophilic domains), stratum corneum | + |
Nile blue sulfate | Skin (human) | Nuclei, cytoplasm, stratum corneum, collagen, elastic fibers | ++ |
Liver (mouse) | Nuclei, cytoplasm | + | |
HeLa cells | Nuclei, cytoplasm | + | |
MDCK cells | Nuclei, cytoskeleton | ++ | |
Nematodes (C. elegans) | Cytoplasm, membranes | + | |
Nile red | Skin (human) | Nuclei, cytoplasm, stratum corneum | − |
Liver (mouse) | No labeling | – | |
HeLa cells | Nuclei, cytoplasm | + | |
MDCK cells | Nuclei, cytoplasm | ++ | |
Oregon Green | Skin (human) | Nuclei, collagen, elastic fibers | + |
Phalloidin Alexa 488 | HeLa cells | Cytoskeleton | ++ |
Safranin O | Skin (human) | Nuclei, cytoplasm, stratum corneum, collagen, elastic fibers | ++ |
Liver (mouse) | Cytoplasm | − | |
HeLa cells | Nuclei, cytoplasm | ++ | |
Nematodes (C. elegans) | Nuclei, cytoplasm, cell membranes | ++ | |
Mung bean roots | Entire tissue, unspecific | + | |
Sudan III | Skin (human) | Nuclei, whole dermis | + |
SYTO 16 | MDCK cells | No labeling | – |
SYTO 24 | MDCK cells | Entire cell, unspecific | − |
SYTO 83 | MDCK cells | Entire cell, unspecific | + |
SYTOX Green | MDCK cells | Entire cell incl. membranes, unspecific | + |
Tannin | Skin (human) | Nuclei, stratum corneum | − |
However, even this unspecific fluorescent labeling during FS is very useful to identify a ROI with CSLM, and the fluorophores may serve as navigational aid for subsequent FIB-SEM imaging. In the case of cell culture samples, specific labeling may even be unnecessary, as long as a cell of interest can be identified by its shape and/or position. And for more complex tissue samples, the introduced fluorescence provides a histological description, enabling the identification of a ROI based on morphological features (see Fig. 2). In both cases, the process of elaborate searching for a ROI in FIB-SEM can be simplified by morphological scouting.
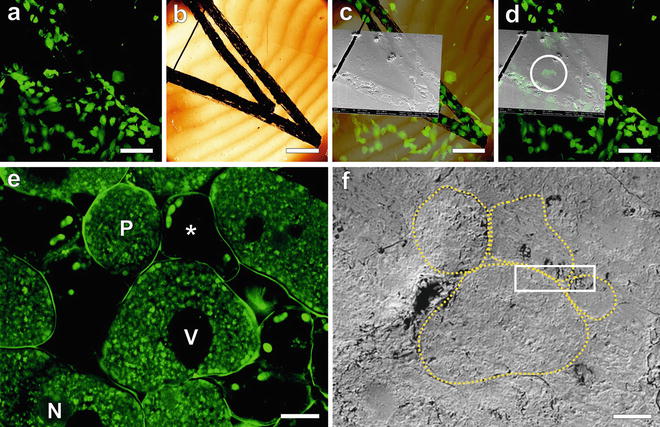
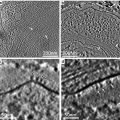
Fig. 2
Identification of the region of interest for FIB-SEM using the CLSM data. (a–d) MDCK cells, grown on carbon-coated sapphire discs, high-pressure frozen and freeze-substituted in the presence of uranyl acetate and Safranin O, and then embedded in HM20. Here any feature scratched into the carbon coating of the sapphire discs can be used to identify the ROI. Investigation by CLSM facilitates the selection and 3D characterization of a ROI (a). Surface features of the resin block can be recognized in the reflection mode of the CLSM (b) as well as in SEM (c) and can be used to navigate to the ROI for FIB-SEM investigation (d). In the case of more complex samples or tissues, morphological features such as cell shape and positioning can be used to identify the ROI. (e and f) A root nodule from mung bean (Vigna radiata) colonized with nitrogen-fixing bacteria (B. japonicum) extracted fresh from the plant. 200 μm thick slices were high-pressure frozen after degassing in 1-hexadecene, followed by FS in acetone supplemented with uranyl acetate, osmium tetroxide, and acridine orange for fluorescent labeling of the bacteria, embedded in HM20. (e) To access the sample for CLSM imaging, a clean block-face was created in the microtome using a diamond trimming knife. Cells with (P) and without (asterisk) bacteria population can be distinguished, as well as vacuoles (V) and weakly stained nuclei (N). The fluorescence of the cell walls is rather attributed to autofluorescence of the plant sample. The corresponding area imaged in SEM is shown in (f). Four cells are outlined (yellow dotted line) to illustrate the correspondence. The white rectangle marks the position where a FIB-SEM volume was recorded. Figure adapted from Lucas et al. [7], with the permission of Elsevier Ltd. Scale bars: (a–d) = 50 μm; (e and f) = 10 μm (Color figure online)
As already mentioned, the specimens have to be stained for both CLSM and FIB-SEM during FS, which requires not only a good fluorescence signal but also optimum membrane visibility and imaging contrast in the FIB-SEM. Enhancing membrane staining during FS after HPF has been discussed intensely for TEM applications. FS in acetone with uranyl acetate, sometimes with the addition of glutaraldehyde, was shown to preserve membrane details and lipids well [28, 35]. Others concluded that osmium tetroxide in acetone, only with the optional addition of uranyl acetate, yielded the best results for morphological descriptions [36]. Mordant-mediated osmium staining at room temperature following FS with osmium in acetone was applied successfully to visualize membranes in semi-thin sections used for TEM tomography and rendered even post-staining of the sections unnecessary [37]. Furthermore, addition of water to the FS-medium has been described to enhance membrane visibility [38, 39] and also improved mordant-mediated osmium staining, although this is effect can be attributed to swelling of the membranes and is most obvious in cell culture or yeast samples.
However, the described methods either involve additional post-staining of ultrathin sections or, especially when applying osmium tetroxide, are incompatible with fluorescence labeling. Obtaining a good signal-to-noise ratio in FIB-SEM, especially with respect to the visibility of lipid membranes, is more challenging, because the samples are investigated en bloc and conventional post-staining is not possible. Several methods for the optimization of pre-embedding membrane staining have been published, based on potassium ferrocyanide-mediated oxidation of osmium tetroxide, followed by uranyl acetate [4, 40], or tannic acid [41]. However, these protocols are all based on room temperature embedding after chemical fixation, rather than HPF and FS.
In this chapter we present a protocol for FS after HPF, which yields optimized membrane staining for en bloc FIB-SEM while not or only minimally interfering with fluorescence detection by CLSM. This protocol was initially developed for the combined application of CLSM and TEM using post-stained sections [6] and employed only the combination of uranyl acetate and fluorescence dyes in the FS-medium. However, osmium tetroxide proved to be indispensable for a clear detection of membranes when employing en bloc imaging techniques such as FIB-SEM. We therefore adapted this protocol to include 0.9 % osmium tetroxide in the FS-medium. An important modification in this protocol compared to those discussed above is to keep the samples below −50 °C during osmium penetration. This prevents the blackening reaction, which interferes with fluorescence. Any excess osmium is removed at −50 °C, and the substitution medium is replaced with pure organic solvent to finish the FS-experiment. The resulting membrane staining is not as pronounced as e.g. after potassium ferrocyanide-mediated osmium treatment, but is sufficient to detect and trace the membranes for 3D analysis and modeling (see Fig. 3).
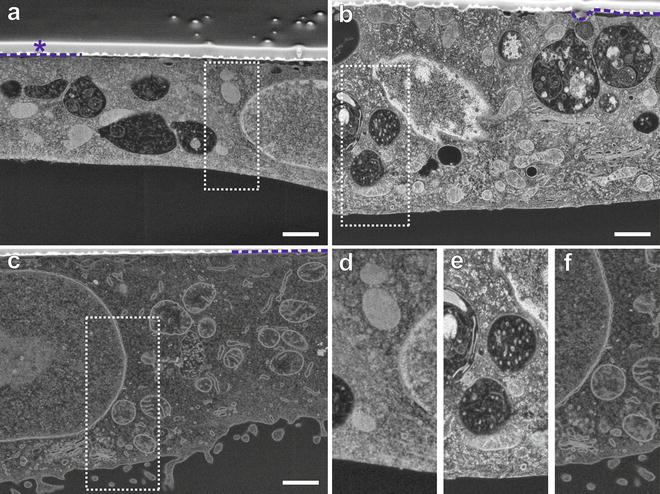
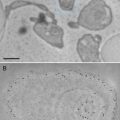
Fig. 3
Optimization of membrane staining for FIB-SEM. Cells are embedded upside down. After resin curing the sapphire substrate is removed, leaving the cells directly beneath the surface of the resin block. For FIB-SEM, the resin block is evaporation-coated with 5–7 nm gold (indicated by blue dashed line) for conductivity. To protect the sample and prevent curtaining effects during milling, the ROI is additionally coated with carbon (asterisk). The images were acquired with identical settings for brightness and contrast to enable direct comparison of staining quality. (a and b) MDCK cells grown on sapphire discs, freeze-substituted after HPF in acetone and embedded in HM20. (a) Imaging contrast achieved with uranyl acetate in the FS-medium. (b) The combination of uranyl acetate and osmium tetroxide. Note that membrane visibility is improved by addition of osmium tetroxide. (c) Benchmark preparation according to a protocol for chemical fixation optimized for membrane detection, using uranyl acetate and pure and reduced osmium tetroxide followed by embedding in EPON [4]. The membranes show strong staining, while cytoplasm and other details of the cell are less pronounced. (d–f) Magnified display corresponding to areas marked by dotted lines in images (a–c), respectively. Figure reproduced from Lucas et al. [7], with the permission of Elsevier Ltd. Scale bars = 1 μm (Color figure online)
The described protocol is applicable to a wide variety of samples, such as cultured cells, small organisms, tissue samples, or plant specimens. Here we will focus on two different specimen types, namely, cell culture monolayers (MDCK or HeLa cells) and mung bean (Vigna radiata) root nodules to demonstrate the application. However, the success of the technique does not depend on the described samples. Based on this sample preparation, we will illustrate a 3D correlative imaging approach combining CLSM and FIB-SEM volume imaging and some basic steps of imaging processing to visualize the correlation and analyze correlative volumes.
2 Materials
2.1 Specimen Preparation
In the following, we list all materials needed to prepare the demonstrated specimen types: MDCK or HeLa cells cultured on sapphire discs and slices of mung bean (V. radiata) root nodules.
1.
Cell culture, e.g., MDCK or HeLa cells.
2.
Round sapphire coverslips (diameter 3 mm, 100 μm thick; Rudolf Brügger SA, Minusio, Switzerland), evaporation-coated with carbon, as cell substrate.
3.
Sulfuric acid (70 %), tap water, distilled water, and ethanol for cleaning of the sapphire discs before carbon coating.
4.
Glow-discharging system (Emitech Plasma Cleaner K100X; Quorum Technologies Ltd, UK).
5.
Filter paper.
6.
Carbon coater for coating of sapphire discs (BAE 120, Bal-Tec AG, Principality of Liechtenstein).
7.
Root nodules from wild-type mung bean plants, 3 weeks old.
8.
Hand microtome (Windaus Labortechnik GmbH, Germany) to cut plant material to a thickness suitable for HPF.
9.
Pre-vacuum chamber for degassing of samples before freezing.
10.
1-Hexadecene (Fluka, Switzerland) as filling medium of aluminum planchettes can be used for all types of samples, except for cell culture samples, which are better frozen in the respective culture medium.
11.
Standard aluminum planchettes (3 mm diameter, 200 μm indentation) and aluminum spacer rings (3 mm diameter, 100 μm thick) for HPF.
12.
Tweezers for handling of the samples and aluminum planchettes.
13.
High-pressure freezing machine. We use the Bal-Tec HPM 010 (Bal-Tec AG, Principality of Liechtenstein) and the Leica EM HPM 100 (Leica Microsystems, Austria).
14.
Liquid nitrogen.
15.
Liquid nitrogen storage container for high-pressure frozen samples.
2.2 Freeze- Substitution Including Fluorescent Staining
1.
Acetone, puriss. p.a., ACS grade, dried over molecular sieve.
2.
Ethanol, puriss. p.a., ACS grade, dried over molecular sieve.
3.
Uranyl acetate dihydrate, puriss. p.a., ACS grade, ≥98.0 %.
4.
Osmium tetroxide, crystalline, highest purity, 99.95 %.
6.
Lowicryl HM20 nonpolar, hydrophobic embedding kit (Polysciences Europe GmbH, Germany).
7.
Eppendorf tubes, as sample containers.
8.
Freeze-substitution baskets, made from pipette tips cut to 5 mm length, with a solvent-resistant ethylene tetrafluoroethylene netting, mesh size 210 μm (Bückmann GmbH & Co. KG, Mönchengladbach, Germany) glued to the bottom of a truncated pipette tip by carefully melting the plastic on a hot plate.
9.
 Microwave-Assisted Processing and Embedding for Transmission Electron Microscopy
 Electron Microscopy of Microtubule Cytoskeleton Assembly In Vitro
 Visualization of DNA and Protein–DNA Complexes with Atomic Force Microscopy
 Biological Applications of Phase-Contrast Electron Microscopy
 Correlative Light and Electron Microscopy Using Immunolabeled Sections
 X-Ray Microanalysis in the Scanning Electron Microscope


Automated freeze-substitution device, self-build, consisting of a cooling unit holding the sample containers, filled with ethanol as cooling agent, plus a temperature controller (Tecon AG, Switzerland) for automatic temperature shifting.
Related posts:
Microwave-Assisted Processing and Embedding for Transmission Electron Microscopy
Electron Microscopy of Microtubule Cytoskeleton Assembly In Vitro
Visualization of DNA and Protein–DNA Complexes with Atomic Force Microscopy
Biological Applications of Phase-Contrast Electron Microscopy
Correlative Light and Electron Microscopy Using Immunolabeled Sections
Stay updated, free articles. Join our Telegram channel
Full access? Get Clinical Tree
