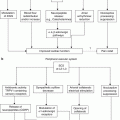
Fig. 47.1
Markov model, SCS analysis
In this model, patients were divided into three cohorts, each undergoing a different strategy:
1.
Successful treatment with SCS (success-SCS).
2.
Failed SCS after 3 years of intervention had hardware explanted and were subsequently maintained on CMM (failed-SCS).
3.
CMM.
During the simulation, there were four mutually exclusive health states in which patients could exist: optimal HRQoL (with or without complications), suboptimal HRQoL, or death. Each health state was associated with a utility value and probability taken from the literature [7–10]. In health economics, a utility value is a number that represents a given quality of life or state of health. An individual with a medical condition can be assigned a utility value between 0 (death) and 1 (perfect health) depending on how substantially the disease affects quality of life. Patients first undergo a screening trial. Those who achieve optimal pain relief proceed to a permanent implant, and the rest receive CMM.
During each 1-year Markov cycle, patients allocated to SCS are assumed to remain in their health state unless they (1) experience a complication or (2) move from optimal to suboptimal HRQoL [7–10]. Table 47.1 indicates the values assigned to model probabilities, utilities, and costs. EuroQoL-5Dimension (EQ-5D) scores were 0.598 for optimal pain relief without a complication, 0.258 for suboptimal pain relief (with or without complications), and 0.168 for no pain relief. In calculating the results of the failed-SCS group, we utilize the success-SCS group data for the first three cycles and CMM results for the remaining cycles. The model assumes that long-term SCS complications will occur at a rate of 18 % per annum [14]. It is assumed that any complications incurred in the CMM strategy do not impact cost or quality of life. We also modeled the impact of non-rechargeable versus rechargeable IPGs (Table 47.1).
Table 47.1
Costs, utility, and probability distribution pertaining to SCS analysis
Procedure | Cost | Sensitivity analysis range | |
|---|---|---|---|
SCS | |||
Implantation | |||
Rechargeable system | $23,160 | $18,528 | $27,792 |
Non-rechargeable system | $29,162 | $23,330 | $34,994 |
Annual maintenance | |||
Rechargeable system | $2,786 | $2,229 | $3,343 |
Non-rechargeable system | $3,732 | $2,985 | $4,478 |
Trial | $1,930 | $1,544 | $2,316 |
Explantation | $529 | $423 | $635 |
Adjunct drug therapy with SCS | $1,692 | $1,354 | $2,030 |
CMM | $7,988 | $6,390 | $9,586 |
Utility score (EQ–5D) | |||
Optimal HRQoL | |||
Success-SCS | |||
Without complications | 0.598 | 0.478 | 0.718 |
With complications | 0.528 | 0.422 | 0.634 |
CMM | 0.396 | 0.317 | 0.475 |
Suboptimal HRQoL | |||
Success-SCS | |||
Without complications | 0.258 | 0.206 | 0.310 |
With complications | 0.258 | 0.206 | 0.310 |
CMM | 0.205 | 0.164 | 0.246 |
Probability | |||
Complication rate (SCS) | 0.180 | 0.144 | 0.216 |
Complication rate (CMM) | 0.000 | 0.000 | 0.000 |
Death rate | 0.009 | 0.007 | 0.011 |
Optimal HRQoL | |||
Success-SCS | 0.585 | 0.468 | 0.702 |
CMM | 0.100 | 0.080 | 0.120 |
Suboptimal HRQoL | |||
CMM | 0.900 | 0.720 | 1.000 |
Strategy | |||
Success-SCS | |||
Cost | $104,197 | $83,357 | $125,036 |
Effectiveness (QALY) | 5.63 | 4.50 | 6.76 |
Cost/effectiveness | $18,504 | $14,803 | $22,205 |
CMM | |||
Incremental cost | −$7,197 | −$5,757 | −$8,636 |
Incremental effectiveness | −3.51 | −2.81 | −4.21 |
Cost/effectiveness | $46,180 | $36,944 | $55,416 |
Failed-SCS | |||
Incremental cost | $67,628 | $54,103 | $81,154 |
Incremental effectiveness | −1.34 | −1.07 | −1.60 |
Cost/effectiveness | $39,998 | $31,998 | $47,997 |
Intrathecal Drug Therapy
To investigate IT cost-effectiveness, we utilized the data of 88 patients with FBSS who underwent SCS and subsequently failed to achieve satisfactory pain relief. These patients had their SCS electrodes explanted. The 88 patients were randomly divided into two groups of 44 patients each and were matched, in the same manner described earlier. Patients in the IT group received an IT morphine trial. Twenty-three patients (11 female [48 %] and 12 male [52 %]) were selected to undergo implantation of a permanent SynchroMed™ pump (Medtronic of Canada Ltd., Brampton, ON, Canada) as they met the outcome criteria of ≥50 % pain relief. The remaining 21 patients were excluded from study. In the original investigation as in the current study, anticipated costs of these patients were not factored, as they received no further treatment of any kind and thus incurred no further expenses [72].
Pump refills are performed by a neuromodulation nurse, the frequency of which is dictated by the medication dose and concentration. The dose escalation required with time for each patient was averaged. In this study, we found that the pumps had to be replaced in the sixth year of life due to battery depletion and amortized the cost accordingly. In the context of IT, costs include those associated with intrathecal agents, pharmacy costs for compounding and dispensing, refill costs, and physician contacts for dose adjustment.
Decision Analytic Model
This model was developed to compare costs and outcomes over a 10-year span for three strategies and is structured similarly to the abovementioned Markov process for SCS (Fig. 47.2). It is assumed that a patient always exists in one discrete health state during each 1-year Markov cycle. In this model, patients were divided into three cohorts, each undergoing a different strategy:
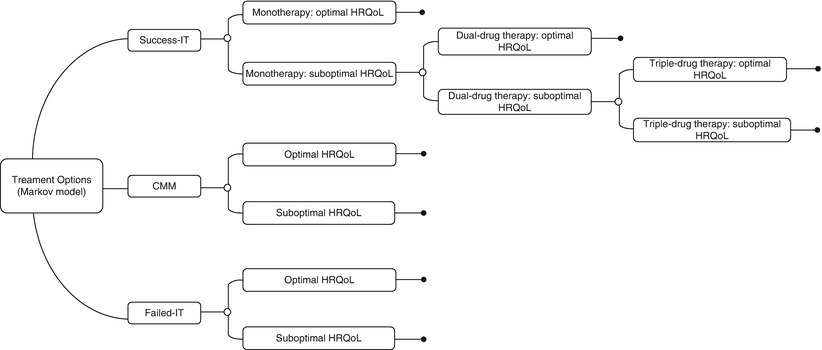

Fig. 47.2
Markov model, IT analysis
1.
Successful treatment with IT which is initiated by monotherapy. If monotherapy results in suboptimal pain relief, the patients are sequentially advanced to dual- and triple-drug admixtures (success-IT).
2.
Failed IT after 3 years and subsequent maintenance on CMM (failed-IT).
3.
CMM.
During the simulation, patients could exist in three mutually exclusive health states, optimal HRQoL, suboptimal HRQoL, or death. Each health state was associated with a utility value and probability taken from the literature and patient chart reviews [72, 73]. Patients first undergo a screening trial. Those who achieve optimal pain relief proceed to a permanent implant, and the rest receive CMM.
Utility values were 0.521, 0.617, 0.603, and 0.405 for optimal improvement in HRQoL with IT mono-, dual-drug, triple-drug therapy, and CMM, respectively. EQ-5D scores for suboptimal improvement were 0.250. In calculating the outcomes of the failed-IT group, we utilized the success-IT group data for the first three cycles and CMM results for the remaining cycles. Our model assumes that the pump will remain functional for an average of 6 years, after which a replacement will be necessary. Furthermore the model assumes that CMM complications will not impact cost or quality of life. The model subsumes an overall rate of 24 % per annum for IT-related complications (Table 47.2) [84].
Table 47.2
Cost, utility, and probability distribution pertaining to IT analysis
Procedure | Cost | Sensitivity analysis range | |
|---|---|---|---|
IT | |||
Implantation | $16,140 | $12,912 | $19,368 |
Annual maintenance | |||
Polyanalgesia and supplemental oral drug costs | $6,157 | $4,926 | $7,389 |
Monotherapy and supplemental oral drug costs | $3,700 | $2,960 | $4,440 |
Trial | $4,535 | $3,628 | $5,442 |
Explantation | $636 | $509 | $763 |
CMM | $7,988 | $6,390 | $9,586 |
Utility score (EQ–5D) | |||
Optimal HRQoL | |||
Success-IT | 0.527 | 0.422 | 0.632 |
CMM | 0.400 | 0.320 | 0.480 |
Suboptimal HRQoL | |||
Failed-IT | 0.310 | 0.248 | 0.372 |
CMM | 0.205 | 0.164 | 0.246 |
Probability | |||
Complication rate – IT | 0.240 | 0.192 | 0.288 |
Complication rate – CMM | 0.000 | 0.000 | 0.000 |
Death rate | 0.009 | 0.007 | 0.011 |
Optimal HRQoL | |||
Success-IT | |||
Monotherapy | 0.571 | 0.457 | 0.685 |
Dual-drug therapy | 0.797 | 0.638 | 0.956 |
Triple-drug therapy | 0.789 | 0.631 | 0.947 |
CMM | 0.150 | 0.120 | 0.180 |
Suboptimal HRQoL | |||
Failed-IT | |||
Monotherapy | 0.429 | 0.343 | 0.515 |
Dual-drug therapy | 0.203 | 0.162 | 0.244 |
Triple-drug therapy | 0.211 | 0.169 | 0.253 |
CMM | 0.850 | 0.680 | 1.000 |
Strategy | |||
Success-IT | |||
Cost | $92,798 | $74,239 | $111,358 |
Effectiveness (QALY) | 5.01 | 4.01 | 6.01 |
Cost/effectiveness | $18,532 | $14,825 | $22,238 |
CMM | |||
Incremental cost | $1,414 | $1,131 | $1,696 |
Incremental effectiveness | −2.75 | −2.20 | −3.30 |
Cost/effectiveness | $41,772 | $33,418 | $50,127 |
Failed-IT | |||
Incremental cost | $14,958 | $11,967 | $17,950 |
Incremental effectiveness | −1.87 | −1.50 | −2.25 |
Cost/effectiveness | $34,363 | $27,490 | $41,236 |
Interpretation
Spinal Cord Stimulation
Cost-Effectiveness
The analysis confirms that success-SCS is the most cost-effective strategy with a cost-effectiveness ratio (CER) of $18,504 followed by failed-SCS (CER: $39,998). Clinically, even if the effectiveness of SCS dissipates over 3 years requiring hardware removal and reversion to CMM, it is a more acceptable alternative to CMM which is least cost-effective (CER: $46,180) (Table 47.1). The CER for successful SCS therapy is well below the societal WTP thresholds of $20,000–$50,000.
In addition to the Markov model, we re-tabulated cumulative costs for a 10-year period by updating our previously published 2002 analysis [16] to reflect 2010 values. Costs are calculated as described above in methods: tabulation of costs (Fig. 47.3). The graph reflects that the higher initial cost of SCS, due largely to hardware costs, is recovered by 2.25 years after which CMM becomes more costly than SCS.
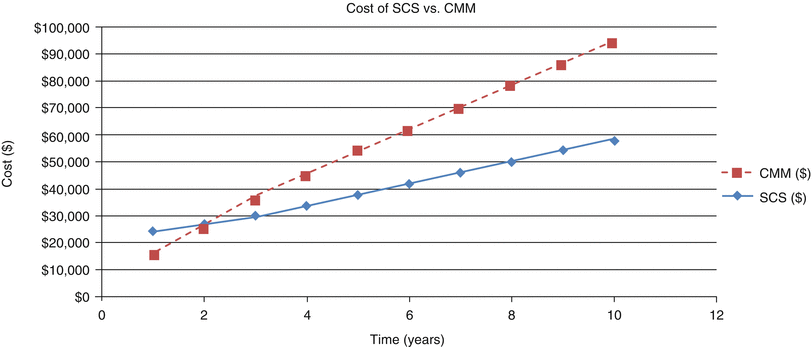

Fig. 47.3
Cumulative cost comparison SCS and CMM over a 10-year period. The 2.25-year payoff period should be noted
The one-way sensitivity analyses (using CMM, failed-SCS, or success-SCS as baseline) revealed that the cost-effectiveness of success-SCS was exceptionally resistant to parameter uncertainty, as it remained cost-effective compared with the other two strategies (i.e., CER < $20,000/QALY) throughout all of the sensitivity analyses.
Net Monetary Benefit
A positive NMB implies that the cost of a new therapy is less than the value of the additional benefit achieved. Conversely, a negative NMB implies that an intervention should be rejected, as its costs are higher than the value of the benefit achieved. The NMB analysis showed substantial savings over a relevant range of WTP for a QALY in the case of success-SCS where the NMB becomes positive at a WTP of $18,501. For failed-SCS and CMM, the NMB thresholds were much higher at WTP of $40,000 and $48,000, respectively. For all commonly accepted values of WTP, SCS represents the optimal strategy (Fig. 47.4).
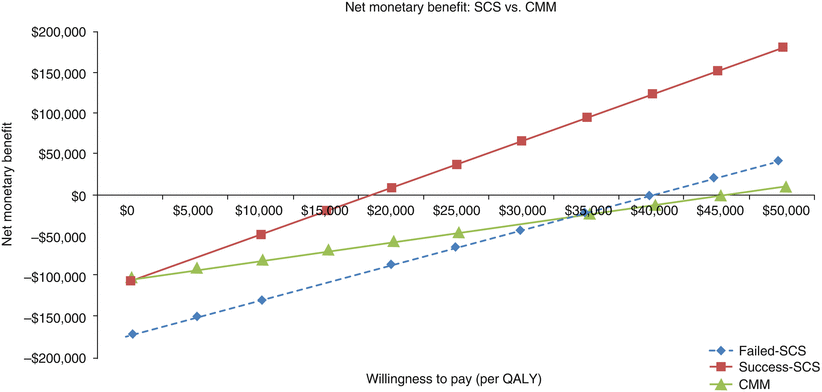

Fig. 47.4
Net monetary benefit (NMB), SCS versus comparator treatment. In the case of success-SCS, the NMB becomes positive at a WTP of $18,501. For failed-SCS and CMM, the NMB thresholds were much higher at WTP of $40,000 and $48,000, respectively. Thus, success-SCS represents the optimal strategy
Impact Analysis
The tornado diagram shows the impact of the most influential individual parameters on the incremental CER for base-case analysis. Impact analysis determined that the most significant factor affecting the model was IPG costs.
Acceptability of Treatment
Stay updated, free articles. Join our Telegram channel

Full access? Get Clinical Tree


