Fig. 19.1
Colored drawing illustrating the gross anatomy of both adrenal glands and their vascular supply. They receive blood supply from the superior, middle, and inferior suprarenal arteries, which originate from the inferior phrenic arteries, abdominal aorta, and renal arteries, respectively. Medullary veins emerge from the suprarenal hila to form the suprarenal veins, which drain to the inferior vena cava (IVC) (right side) and left renal vein (left side)
Fig. 19.2
Cross-sectional microscopy of the adrenal gland. The adrenal gland is composed of an outer cortex and thinner inner medulla, which accounts for one-tenth of the gland’s weight. The cortex is further subdivided into three zones: outer zona glomerulosa, middle zona fasciculata, and inner zona reticularis
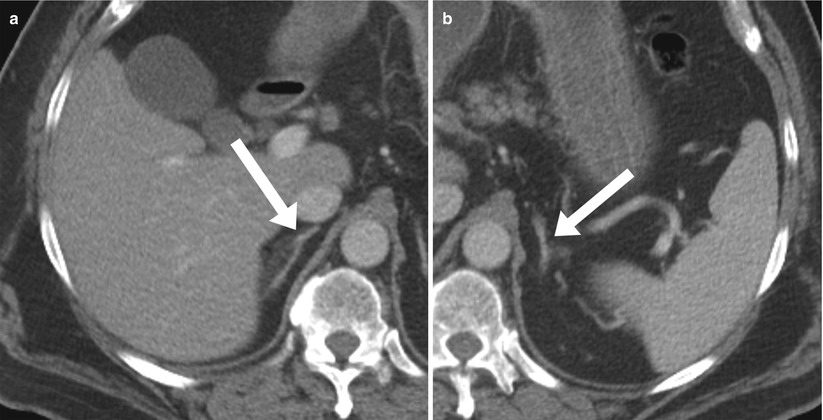
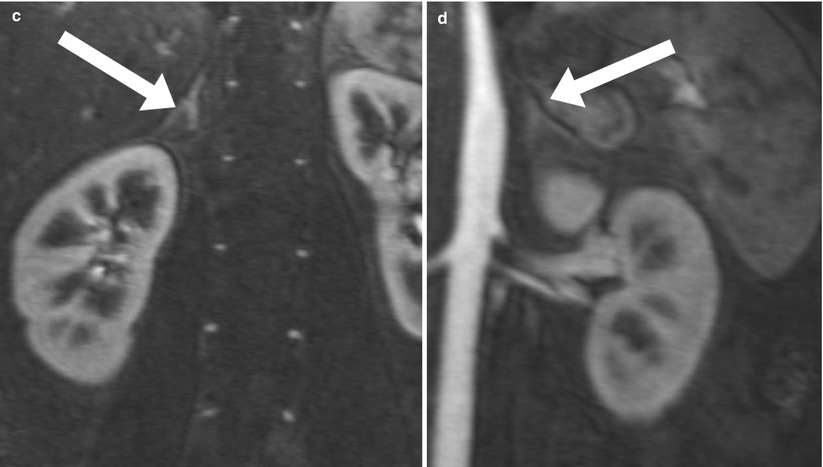
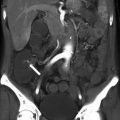
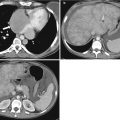
Fig. 19.3
Normal adrenal glands on CT and MR. Axial contrast enhanced CT (a and b), and coronal contrast enhanced T1-weighted images. The right adrenal gland is posterior to the IVC and superior to the upper pole of the right kidney. It has inverted Y configuration (a, c). The left adrenal gland is anteromedial to the upper pole of the kidney and posterior to the pancreas (b, d). Normal adrenal glands range from 2 to 4 mm in thickness and 2 to 4 cm in length
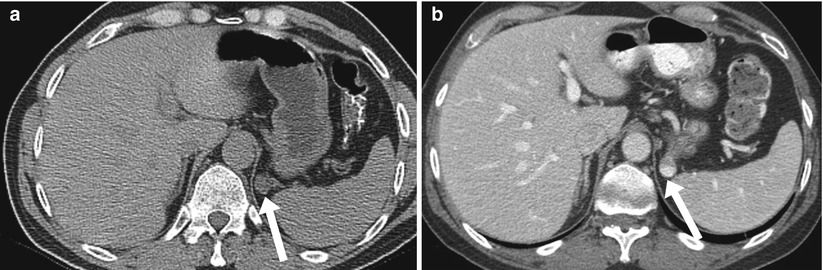
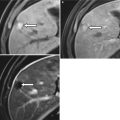
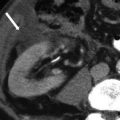
Fig 19.4
Gastric diverticulum mimicking adrenal adenoma. Nonenhanced CT [lower sections of chest CT] (a) reveals a small nodule (arrow) noted in the left suprarenal region, this was interpreted as indeterminate adrenal nodule. Follow up CT of the abdomen with intravenous and oral contrast (b) demonstrates oral contrast filling this lesion (arrow) consistent with gastric diverticulum
Imaging Techniques
Computed Tomography (CT)
CT is commonly used to detect and characterize adrenal masses. A dedicated adrenal CT protocol is usually performed to further evaluate incidental adrenal masses, particularly in patients with a history of primary malignancy. The adrenal mass protocol may include the densitometry of the mass on noncontrast CT scans. Measuring the unenhanced attenuation value of an adrenal mass is important for diagnosing lipid-rich adenoma (Fig. 19.5). An unenhanced attenuation value of less than 10 Hounsfield units (HU) is characteristic of a benign adrenal mass, and no further imaging evaluation is required (Algorithm 19.1) [1]. The use of contrast enhancement washout values helps to further distinguish adenomas from other pathologies. Adrenal masses that have attenuation values more than 10 HU on unenhanced imaging should undergo enhanced CT imaging for 60 seconds after the intravenous administration of contrast material, and then delayed enhanced CT imaging after 15 min (Fig. 19.6). Enhancement washout percentages for these masses are then calculated. The absolute percent enhancement washout can be calculated by measuring the enhanced attenuation, delayed enhanced, and unenhanced values, using the following formula:
 If noncontrast scans are not obtained, the relative enhancement washout can be calculated as follows:
 Absolute threshold values of 60 % or more and a relative washout threshold of 40 % or more have been found to be 98 % sensitive and 92 % specific for diagnosing adrenal adenomas [1].
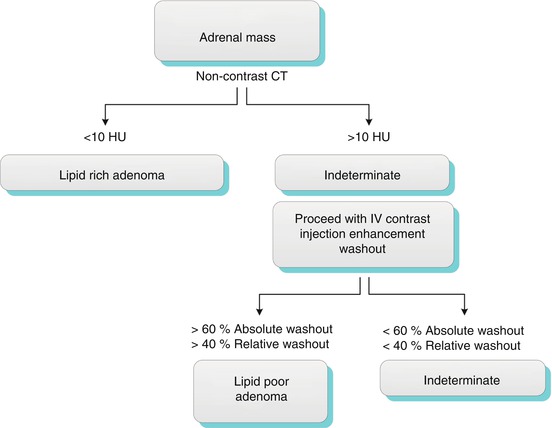
Algorithm19.1 Diagnostic work-up of adrenal mass by CT
Magnetic Resonance Imaging (MRI)
The most important pulse sequences in the adrenal MRI protocol are in-phase and out-of-phase sequences. Drop of signal intensity of the adrenal mass on out-of-phase images compared with on in-phase images is diagnostic of the presence of intracellular lipid. The accuracy of MRI in distinguishing adenomas from metastatic tumors is 100 % if the cutoff value of the signal intensity index selected is 16.5 % (Fig. 19.7) [2].
However, MRI has been reported to have a limited role in characterizing lipid-poor adenomas. Haidar [3] described this limitation in lipid-poor adenomas with attenuation values higher than 30 HU. Similarly, only 62 % (8 of 13 cases) adrenal adenomas measuring more than 10 HU on unenhanced CT were characterized with chemical shift MRI (Fig. 19.8) [4].
Role of Positron Emission Tomography (PET)
PET was found to be less useful than CT in differentiating adrenal adenomas from non-adenomas. However, adrenal mass activity that is visibly lower than that of the liver is more specific for adenoma and activity that is higher than that of the liver is more specific for malignancy (Figs. 19.11 and 19.12) [6].
Main Teaching Points
CT washout technique is most sensitive for differentiating adenomas from non-adenomas.
Of note, CT washout should not be used in heterogeneous masses.
In-phase/out-of-phase pulse sequences are helpful for diagnosing lipid-rich and most lipid-poor adenomas. These demonstrate signal loss of out-of-phase compared to in-phase pulse sequences.
PET and DWI have low specificity in differentiating adenomas from non-adenomas.
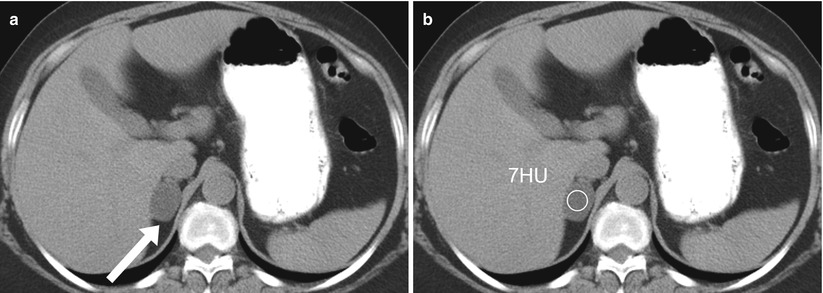
Fig. 19.5
Adrenal lipid rich adenoma on CT. Axial non-enhanced CT (a, b) demonstrate a well-circumscribed oval nodule involving the right adrenal gland with an attenuation value of 7 HU, characteristic of a lipid-rich adenoma
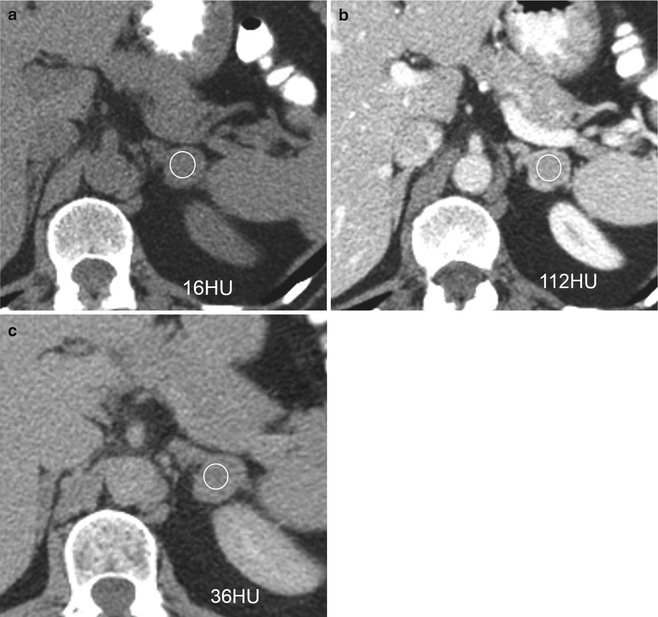
Fig. 19.6
Adrenal lipid poor adenoma on CT. Axial non-enhanced CT (a), contrast enhanced CT in venous (b) and delayed 15 minutes (c), demonstrate a left adrenal mass with an attenuation value of 16 HU. Because the attenuation value was more than 10 HU, intravenous contrast was administered. The venous phase attenuation value was 112 HU, with 36 HU in delayed phase, leading to an absolute enhancement washout of 75 %; characteristic of a lipid-poor adenoma
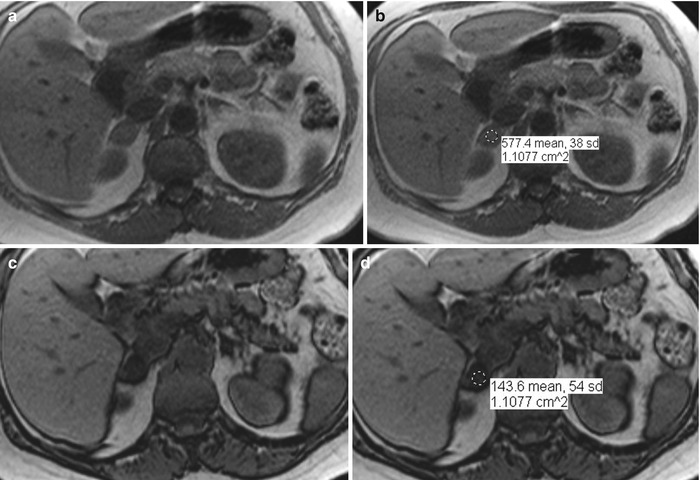
Fig. 19.7
Adrenal adenoma on MR. Axial in-phase (a, b) and out-of-phase (c, d) images demonstrate a right adrenal nodule exhibiting significant signal loss on out-of-phase compared to in-phase (SII = 577 – 144/577 = 75 %), which is characteristic of an adenoma. Note the low signal intensity demarcation surrounding abdominal organs in the out-of-phase pulse sequence
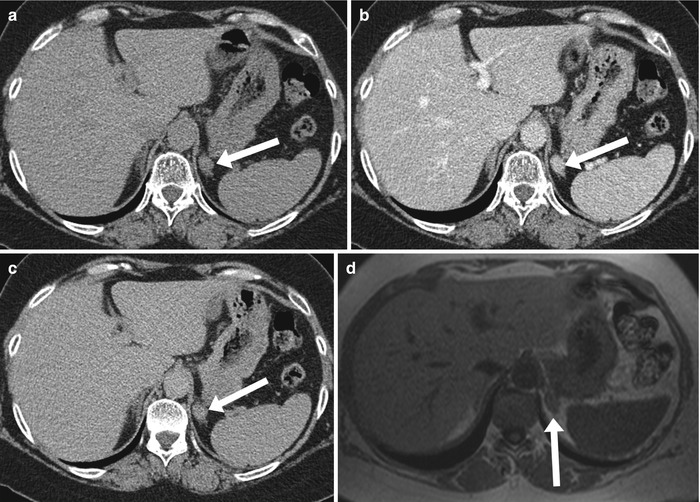
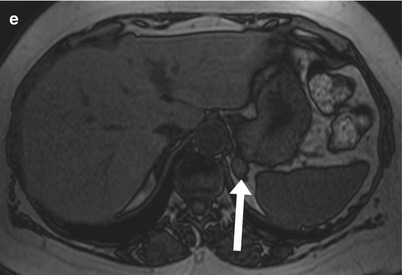
Fig. 19.8
Diagnostic limitation of MR in characterizing some lipid poor adenoma. Axial non-enhanced (a), venous phase (b), and delayed phase (c) CT images demonstrate an enhancement washout of 75 % (109 HU (venous phase) – 60 HU(delayed phase) / 109 HU (venous phase) – 46 HU (non-enhanced), which is characteristic of a lipid-poor adenoma. Axial in-phase (d) and out-of-phase (e) images demonstrate no significant signal loss. This represents an example of MRI’s limitation in characterizing some lipid-poor adenomas
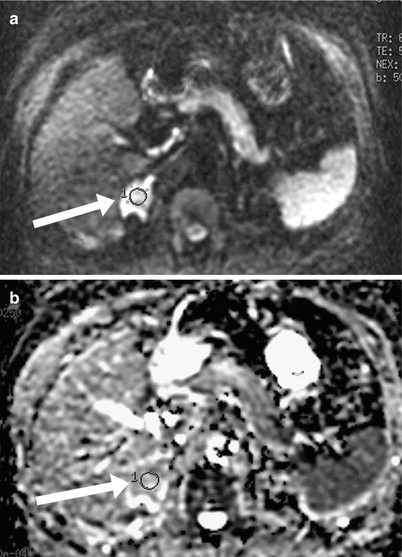
Fig. 19.9
Adrenal metastasis on DWI. Diffusion weighted (a) and an ADC map (b) demonstrate a right adrenal mass (arrow) with restricted diffusion with an ADC value of 1.8. Note that both adenomas and metastases restrict diffusion; thus, they cannot be differentiated based on diffusion characteristics
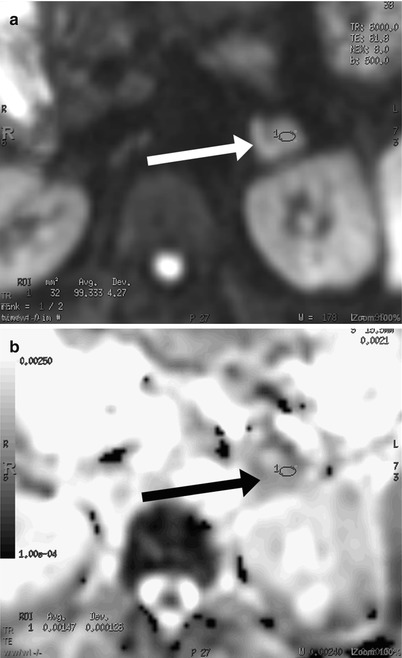
Fig. 19.10
Adrenal adenoma on DWI. Diffusion weighted (a) and an ADC map (b) demonstrate a left adrenal mass (arrow) with restricted diffusion and an ADC value of 1.5. Note that both adenomas and metastases restrict diffusion; thus, they cannot be differentiated based on diffusion characteristics
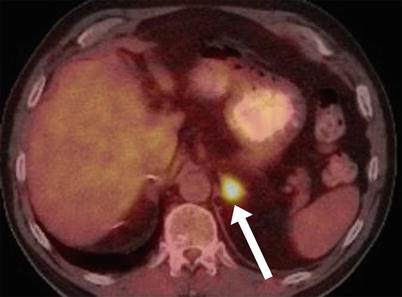
Fig. 19.11
Adrenal metastasis on PET. Axial fused PET/CT image demonstrates increased uptake of a left adrenal mass, compatible with a known adrenal metastasis. Note that increased uptake compared with in the liver is more specific for malignancy
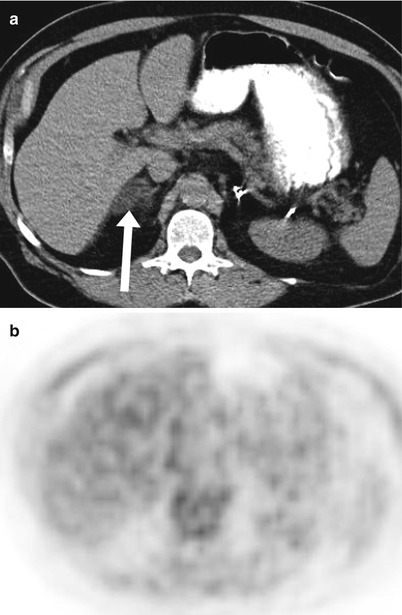
Fig. 19.12
Adrenal adenoma on PET. Axial nonenhanced CT (a) and axial PET image (b) demonstrate a right adrenal mass with decreased uptake compared to the liver, compatible with known adenoma. Note that decreased uptake compared to the liver is more specific for an adenoma
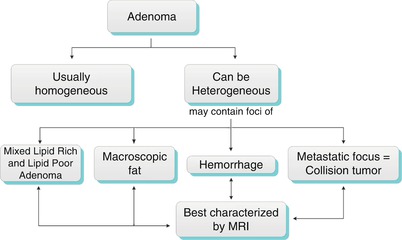
Diagnostic Algorithmic Approach of Adrenal Masses
Adrenal masses can be categorized based on morphologic features and contents into intacellular lipid, macroscopic fat, hemorrhage, cystic, markedly enhancing, large lobulated heterogeneous mass, calcified, bilateral as illustrated in algorithm 19.2).
Algorithm 19.2 Algorithmic diagnostic approach of common adrenal masses
Adrenal Masses Containing Intracellular Lipid
Adrenal Adenoma
Adrenal adenoma is the most common adrenal lesion, found in 3 % of cases at autopsy. An important feature of adrenal adenoma is the presence of intracellular lipid. CT is the most sensitive and specific imaging modality for characterizing adrenal masses. As discussed above, an unenhanced attenuation value of less than 10 HU is characteristic of a lipid-rich adenoma (Fig. 19.5). Threshold values of more than 60 % for absolute and 40 % for relative enhancement washout have been found to be highly sensitive and specific for diagnosing adrenal adenomas (Fig. 19.6) [1]. Chemical shift imaging (with in-phase and out-of-phase pulse sequences) is the most reliable MRI technique for diagnosing adrenal adenomas. Most adrenal adenomas demonstrate a loss of signal intensity on out-of-phase images compared with in-phase images (Fig. 19.7) [7–9]. A decrease in signal intensity of more than 16.5 % is considered diagnostic of an adenoma [2].
Main Teaching Points
Unenhanced attenuation value <10 HU is characteristic of lipid-rich adenoma.
Absolute enhancement washout >60 % and relative washout >40 % are highly sensitive and specific for diagnosing adrenal adenomas.
Lipid-rich and most lipid-poor adenomas demonstrate signal loss on out-of-phase compared to in-phase pulse sequences.
MR is limited in diagnosing some lipid poor adenomas.
Uniform enhancement on contrast material-enhanced images is also typical of adenomas [10]. Small, rounded foci of altered signal intensity may be seen in an adenoma as a result of cystic changes, hemorrhage (Figs. 19.13 and 19.14), variable vascularity or mixed areas of lipid rich and lipid poor (Algorithm 19.3) (Fig. 19.15) [11]. Rarely, foci of macroscopic fat have been reported in adrenocortical adenomas (Fig. 19.16), which could be potentially misdiagnosed as myelolipoma diagnosed as myelolipomas on the basis of radiologic findings. The lipomatous tissue may represent degenerative phenomena in an adrenocortical adenoma or may be an additional neoplastic component of the tumor. Irrespective of their origin, extensive (myelolipomatous) lipomatous changes in adrenocortical tumors can lead to misinterpretation in the preoperative work-up of patients with adrenal masses [12].
Algorithm 19.3 Common and uncommon features of adrenal adenoma
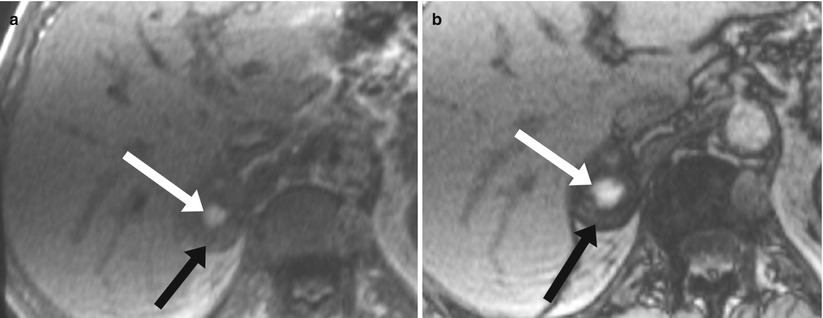
Fig. 19.13
Adrenal adenoma with a focus of hemorrhage on MR. Axial in-phase (a), axial out-of-phase (b) and axial fat saturated T2-weighted (c) images demonstrate signal loss on out-of-phase images compared with in-phase pulse images, which is characteristic of an adenoma (black arrow). A central focus of hemorrhage (white arrow) is noted, with a characteristic high signal intensity on T1-weighted images and low signal intensity on T2-weighted images
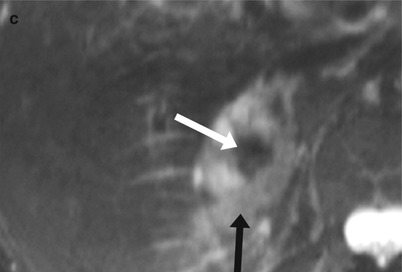
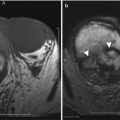
Fig. 19.14
Adrenal adenoma with a focus of hemorrhage on CT. Axial non-enhanced CT (a), venous phase postcontrast CT (b), demonstrate an oval-shaped right adrenal mass (arrow head) with a hyperdense focus (arrow) representing a focal hemorrhage within adrenal adenoma
Fig. 19.15
Adrenal adenoma containing mixed lipid rich and lipid poor components. Axial non-enhanced (a), venous phase (b) and delayed phase postcontrast (c) CT images demonstrate an adrenal mass (white arrow) with a relatively hyperdense central focus (black arrow)that demonstrate enhancement washout similar to the larger background mass proven to represent adenoma containing mixed lipid rich (peripherally) and lipid poor (centrally) components
Fig. 19.16
Adrenal adenoma with myelolipomatous degeneration. Axial non-enhanced CT (a) shows a left adrenal mass (arrow heads) with two small foci of macroscopic fat (arrows). Axial in-phase (b) and out-of-phase (c) demonstrate signal drop of the background lesion (arrow heads) seen on out-of-phase images compared with in-phase images, characteristic of an adenoma, with foci of high signal intensity (arrows in b) surrounded by india ink artifacts on out-of-phase (arrows in c). Axial fat saturated T1-weighted (d) demonstrate signal loss of the small central foci (arrows) indicating the presence of macroscopic fat within adrenal adenoma
Mimics of Adrenal Adenoma
Although uncommon, various adrenal masses can mimic adrenal adenomas, mainly because of low attenuation on CT or signal loss on out-of-phase compared to in-phase MR pulse sequences. Simple cyst with an attenuation value of less than 10 HU can mimic adrenal lipid-rich adenoma on unenhanced CT. However, they do not enhance on postcontrast series (Fig. 19.17) and exhibit markedly increased signal intensity on T2-weighted MR images (Fig. 19.18). Metastatic deposits containing intracellular lipid can develop secondary to primary malignancies containing intracellular lipid, such as hepatocellular carcinoma (HCC) or renal cell carcinoma (RCC-clear cell subtype) (Fig. 19.19) [13, 14]. The presence of intracellular lipid in these masses results in signal loss on out-of-phase compared with in-phase pulse sequences, making it difficult to differentiate them from the more common adrenal adenoma. Adrenal cortical carcinoma (ACC) has been also reported to contain intracellular lipid [15]. It should be noted, however, that ACCs are usually large at presentation, and the distribution of intracellular lipid in ACC is rather inhomogeneous (Fig. 19.20).
Main Teaching Points
Mimics of Adrenal Adenoma
Simple cyst can mimic adenoma in unenhanced CT; cysts however do not enhance.
Metastases containing lipid (such as clear cell RCC and HCC) can also mimic adenoma as they demonstrate drop of signal on out-of-phase compared to in-phase pulse sequences.
Adrenal carcinoma (ACC) rarely contains intracellular lipid; ACC usually large at presentation and the distribution of intracellular lipid in ACC would be rather inhomogeneous.
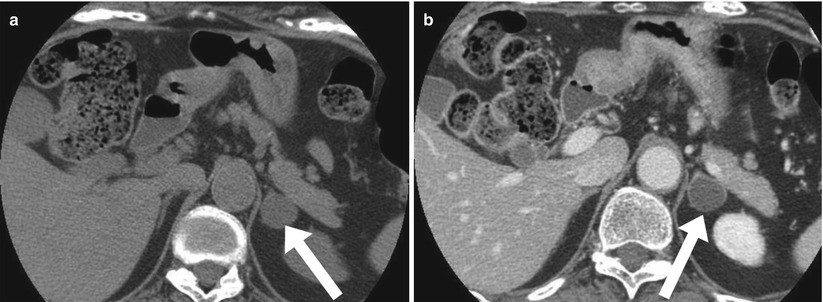
Fig. 19.17
Adrenal simple cyst on CT. Axial non-enhanced (a) and contrast enhanced (b) CT images demonstrate a left adrenal mass with fluid attenuation; the low attenuation in the unenhanced phase mimics lipid-rich adenoma. However, the mass does not enhance on postcontrast CT, which is characteristic of a simple cyst (in contrast, adenoma demonstrates postcontrast enhancement)
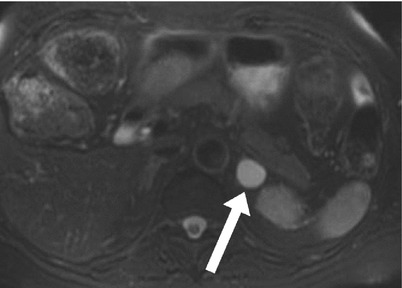
Fig. 19.18
Adrenal simple cyst on MR Axial fat saturated T2-weighted image demonstrates a well circumscribed oval mass (arrow) involving the left adrenal gland and exhibiting markedly increased signal intensity, consistent with a simple cyst
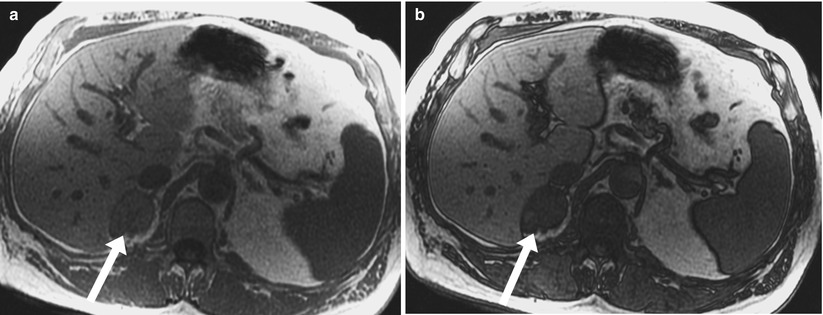
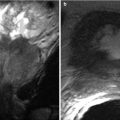
Fig. 19.19
Adrenal metastasis containing intracellular lipid. Axial in-phase (a) and out-of-phase (b) demonstrate a well circumscribed mass involving the right adrenal gland demonstrating a drop of signal on out-of-phase compared in-phase indicating the presence of intracellular lipid within the mass. This was found to represent metastatic deposit secondary to clear cell renal cell carcinoma of the left kidney which was previously resected
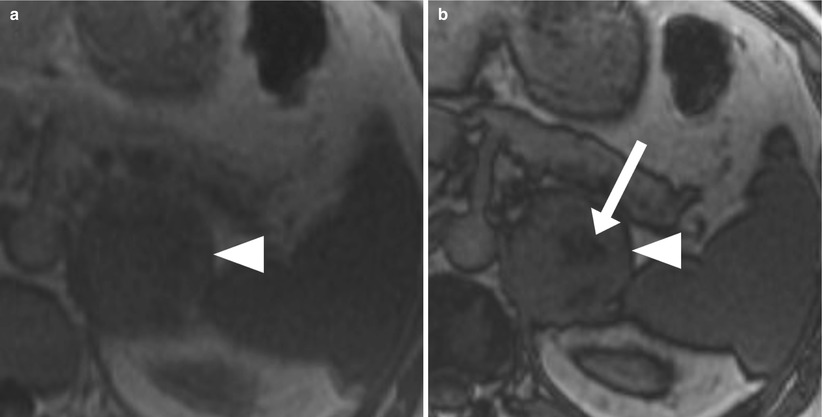
Fig. 19.20
Adrenal cortical carcinoma containing intracellular lipid. Axial in-phase (a) and axial out-of-phase (b) images demonstrate a large lobulated heterogeneous mass (arrow head) in the left adrenal gland with foci of signal loss (arrow) on out-of-phase compared with in-phase pulse sequences indicates the presence of intracellular lipid in this surgically proven adrenocortical carcinoma (ACC). Note that intracellular lipid is rarely reported to be present in ACC. However, the lobulated morphologic characteristics, large size, and heterogeneity of the mass favor a diagnosis of ACC. Image courtesy Dr. Hero Hussain, University of Michigan, Ann Arbor
Adrenal Masses Not Containing Intracellular Lipid
Adrenal Metastases
Adrenal metastases are the most common malignant lesions involving the adrenal gland. Adrenal metastases are found in up to 27 % of patients with malignant epithelial tumors at autopsy [16]. Common primary tumors that metastasize to the adrenal glands include the lungs, bowels, breasts, and pancreas [17]. Metastases are usually bilateral but may also be unilateral. On CT, they typically have attenuation values higher than 10 HU on unenhanced CT. They also demonstrate absolute enhancement washout of less than 60 % and relative enhancement of less than 40 % [1]. On MRI, metastases usually exhibit low signal intensity on T1-weighted images and high signal intensity on T2-weighted images, with heterogeneous enhancement after administration of contrast material. The most important diagnostic feature is the lack of signal loss on out-of-phase images (Fig. 19.21) (in contrast to that seen with adrenal adenoma) [7–9].
Collision Tumors
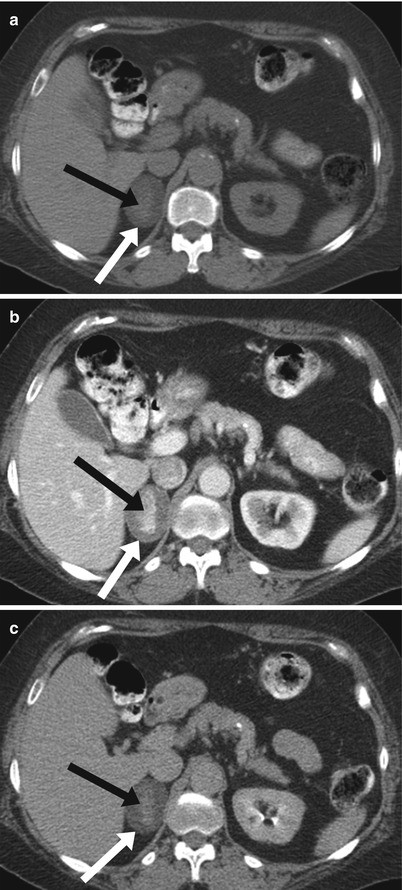
Collision tumors are uncommon; they represent the coexistence of two adjacent but histologically distinct tumors, with no histological admixture. If a collision tumor is not recognized, however, a biopsy of only the benign component can result in a misdiagnosis [18]. On contrast enhanced CT, an adrenal adenoma complicated by hemorrhage can have a similar appearance to that of collision tumors. MRI can improve characterization of the separate components of collision tumor [18]. The internal component is either a hematoma with characteristic nonenhancing blood products (when the adenoma is complicated by hemorrhage) or an enhancing metastatic component on top of the adenoma (collision tumor) (Fig. 19.22) or an adenoma with mixed lipid poor and lipid rich components (as described above and illustrated in Fig. 19.15).
Adrenal Lymphoma
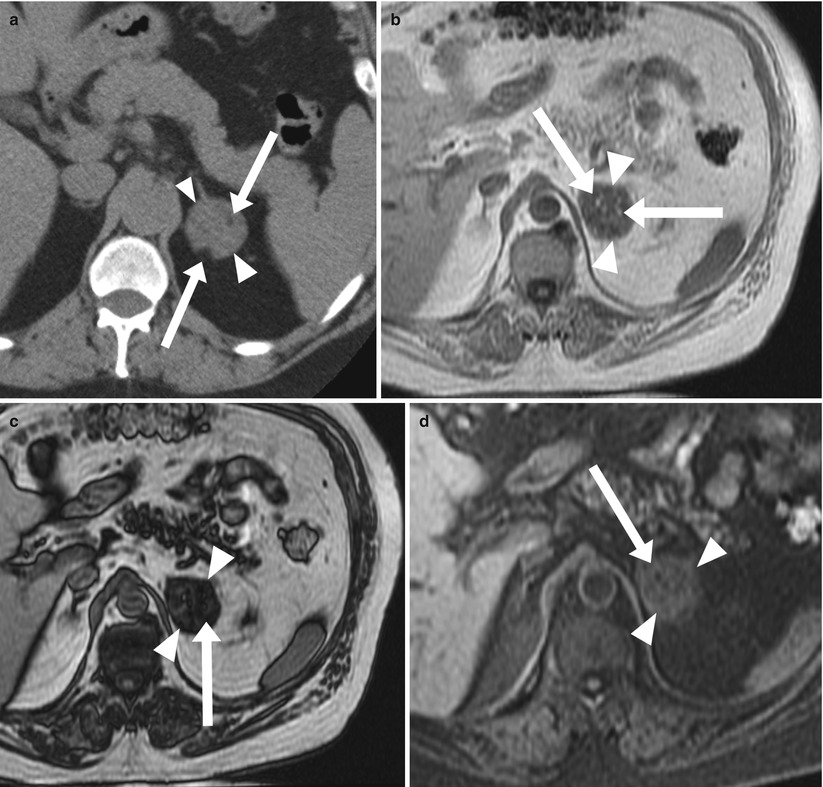
Adrenal lymphoma occasionally involves the adrenal glands, with non-Hodgkin lymphoma being more common than Hodgkin disease at this site. Bilateral involvement is seen in 50 % of patients with diffuse or focal involvement. Lymphoma is usually characterized similarly to metastases, as described above, with lack of enhancement washout and lack of intracellular lipid on MRI (Fig. 19.23) [28]. On CT, lymphoma is also visualized similar to metastases demonstrating a noncontrast attenuation of more than 10 HFU with lack of washout on delayed phase. Lymphoma has been described to demonstrate increased uptake than liver on PET/CT (Fig. 19.24).
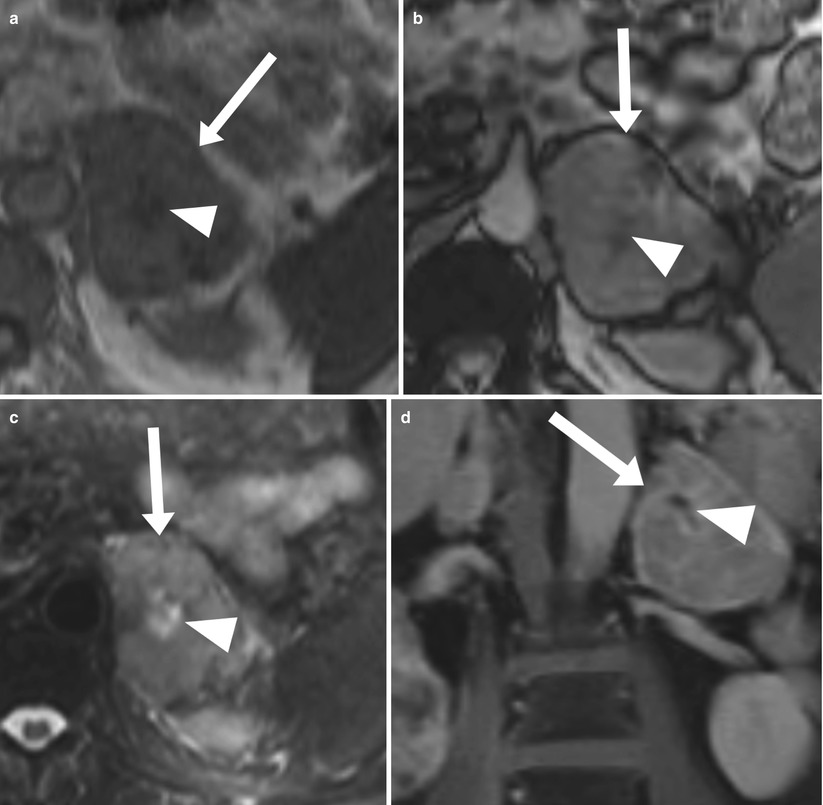
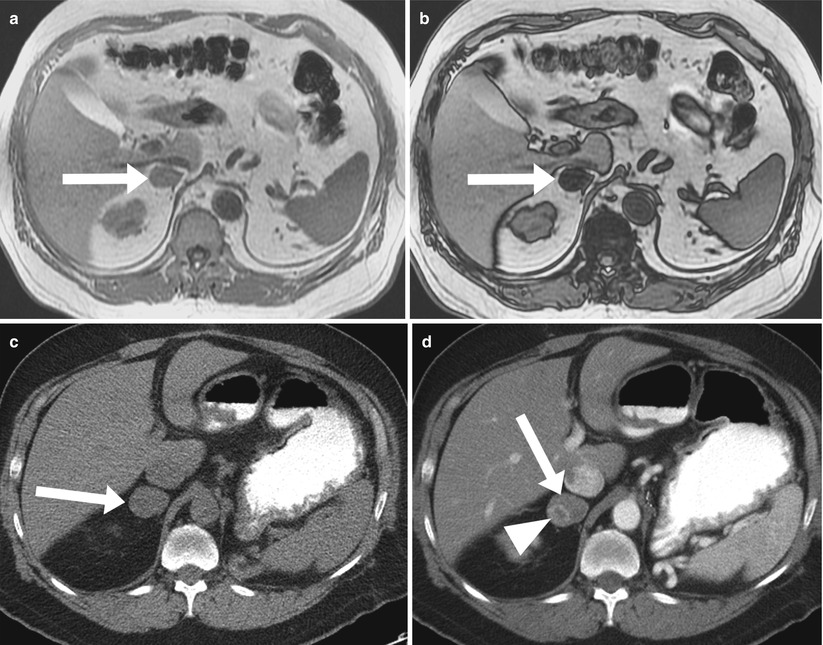
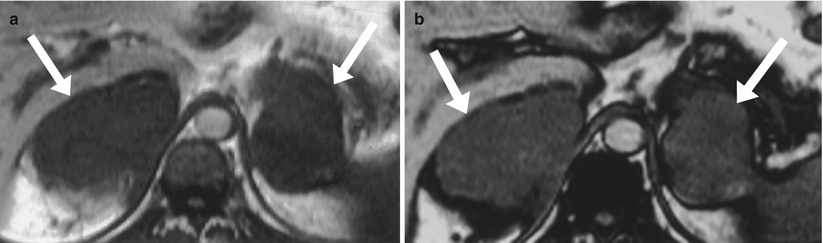
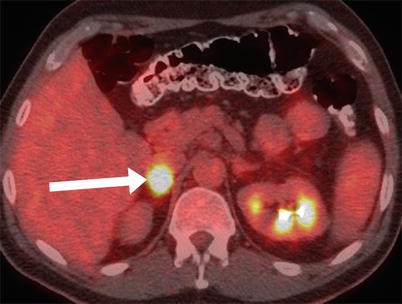
Fig. 19.21
Adrenal Metastasis. Axial in-phase (a), axial out-of-phase (b), axial T2-weighted-weighted (c), and coronal contrast-enhanced T1-weighted (d) images demonstrate a heterogeneous mass (arrow) in the left adrenal gland representing metastasis with no signal loss on out-of-phase compared with in-phase. Note that additional features, such as large size, lobulated contour, central necrosis (arrowhead) and heterogeneous texture, support a diagnosis of malignancy
Fig. 19.22
Collision Tumor. Axial in-phase (a), axial out-of-phase (b), demonstrate a well-circumscribed mass (arrow) involving the right adrenal gland compatible with adenoma in this patient with history of retroperitoneal sarcoma. Follow up imaging with axial non-enhanced (c) and contrast enhanced (d) CT images demonstrate a developing enhancing metastatic focus (arrowhead) within adenoma (arrow), most compatible with collision tumor
Fig. 19.23
Bilateral Adrenal Lymphoma on MR. Axial T1-weighted in-phase (a) and out-of-phase (b) MR images show bilateral lobulated adrenal masses representing lymphomatous deposits. The deposits have low signal intensity, with no signal drop on out-of-phase compared to in-phase pulse sequences
Fig. 19.24
Adrenal Lymphoma on PET. Axial CT/PET demonstrating a high uptake in this patient with right adrenal lymphoma
Adrenal Masses Containing Macroscopic Fat
The most common macroscopic fat-containing adrenal mass is myelolipoma. Myelolipoma is an uncommon benign tumor composed of mature adipose tissue and hematopoietic tissue. Most of these lesions are discovered incidentally. The fatty component of this tumor can be diagnosed by the presence of areas of negative attenuation value on CT (Fig. 19.25). On MRI, macroscopic fat is hyperintense on non-fat-suppressed, T1-weighted images. The use of fat suppression can help confirm the diagnosis by demonstrating a loss of signal intensity in the fatty component (Fig. 19.26) [19]. Myelolipomas can be large and symptomatic, secondary to spontaneous hemorrhage (Fig. 19.27). Rarely, large myelolipomas are confused with other retroperitoneal lipomatous tumors, such as liposarcoma (Fig. 19.28) [11].
Congenital adrenal hyperplasia can have a characteristic appearance of multiple bilateral adrenal masses containing extensive macroscopic fat, which may result from prolonged stimulation of the adrenal cortex by elevated ACT levels (Fig. 19.29).
We have described a rare entity presumed to represent lipomatous metaplasia [20]. Adrenal lipomatous metaplasia is a known pathological entity characterized by the presence of small oval foci of macroscopic lipid occupying an otherwise unremarkable adrenal cortex (Fig. 19.30). Because all the cases have been reported in the pathology literature, it is not surprising that they have been found in patients with hypersecretory adrenal lesions such as hyperplasia, adenoma, and carcinoma, which required surgical resection. In our cases, we found no clinical evidence of hypersecretory or structural adrenal abnormalities [20]. ACC has been rarely reported to contain foci of macroscopic fat, considering the amount of macroscopic fat in the lesion. However, all the described cases of macroscopic fat-containing ACC have contained only a small amount of fat compared with the overall lesion size; thus, this may not be a reliable distinguishing feature because it is well known that myelolipomas contain widely varying amounts of fat, with some containing very little fatty tissue. For this reason, we feel that it is important to consider additional features of the lesion, including the presence of hypertension or clinical or biochemical stigmata of adrenal hormonal excess, which favor the presence of ACC rather than myelolipoma, and the amount of enhancement after intravenous contrast administration. Although myelolipomas can demonstrate enhancement, the presence of a large heterogeneous mass with significant peripheral enhancement more likely represents ACC than myelolipoma (Fig. 19.31) [21].
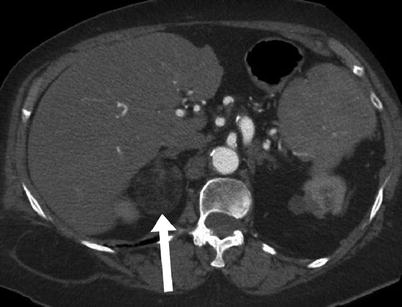
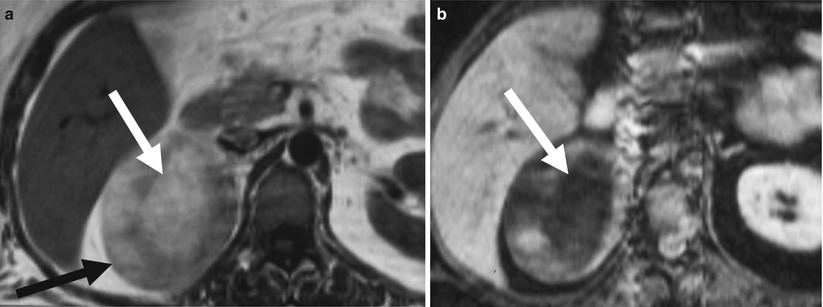
Fig. 19.25
Adrenal Myelolipoma on CT. Axial contrast-enhanced CT demonstrates a right adrenal mass with an internal component of macroscopic fat, which is characteristic of an adrenal myelolipoma. Note that qualitatively, the attenuation is similar to that of retroperitoneal fat, and – quantitatively- the negative attenuation of the fat component is measured
Fig. 19.26
Adrenal Myelolipoma on MR. Axial non-fat-suppressed T1-weighted (a) and fat-suppressed T1-weighted (b) images demonstrate a large oval-shaped mass (black arrow) involving the right adrenal gland with a high signal intensity component (white arrow) on non-fat-saturated images which drops in signal intensity on fat-saturated, T1-weighted images (arrow)
Fig. 19.27


Hemorrhagic Adrenal Myelolipoma on CT. Axial non-enhanced (a) and contrast enhanced (b) demonstrate a large right adrenal mass containing macroscopic fat (arrow) with a surrounding high density fluid representing hemorrhage (arrow heads)
Related posts:
Stay updated, free articles. Join our Telegram channel
Full access? Get Clinical Tree
