CT-Based Attentuation Correction for PET-CT Scanners
Jonathan P. J. Carney
David W. Townsend
In dual-modality PET-CT tomographs, the PET emission data can be routinely corrected for photon-attenuation effects by using the CT images acquired as part of the PET-CT scan protocol. The advantages of such an approach include attenuation-correction factors that are essentially noiseless, owing to the high photon flux used for CT, and short transmission scan times compared with standard PET scanning. As part of the attenuation-correction procedure, it is necessary to scale the CT images from the mean CT energy of approximately 70 keV to the PET photon energy of 511 keV. This is typically achieved using a bilinear function that associates a unique 511-keV linear attenuation value with each measured Hounsfield unit. The use of a bilinear function originates from the different constituent characteristics of soft tissue and bone. After scaling, the attenuation-correction factors are generated by integration (forward projection) along each line of response in the emission data. In practice, however, the CT images may be acquired with intravenous or oral contrast present and they may contain artifacts because of truncation of the arms and patient respiration. Furthermore, there may be foreign objects present, such as dental implants or prosthetic devices. For these reasons, even a scaling algorithm that correctly identifies the proper 511-keV linear attenuation values for human tissue may still not allow for exact attenuation correction. In particular, there is the possibility of introducing spurious hot spots in the attenuation-corrected PET images corresponding to very dense structures seen on CT. Nevertheless, despite this potential for artifact, CT-based attenuation correction has become a routine practice, with resulting artifacts in the attenuation-corrected PET images either being too small to be of clinical significance or, in the case of more substantial artifacts, being easily interpreted as such and therefore not impairing diagnosis. Remedies, including modified scan protocols and scaling procedures, have been proposed to reduce or eliminate these artifacts, in spite of their limited significance in routine oncologic imaging. These remedies become more important in cases where the need for precise attenuation correction is more critical, an example being cardiac PET-CT imaging, where the elimination of metal artifacts and motion artifacts may be necessary for proper clinical interpretation.
Introduction
The recent introduction of combined, dual-modality PET-CT tomographs allows the PET emission data to be routinely corrected for photon-attenuation effects by using the CT images acquired as part of the PET-CT scan protocol (1). The advantages of such an approach include (a) attenuation-correction factors that are essentially noiseless owing to the high photon flux used for CT and (b) short transmission scan times compared with standard PET scanning, which reduce overall imaging times. Because attenuation is an energy-dependent effect, the CT-based correction factors
will be biased unless the energy difference between CT (approximately 70 keV) and PET (511 keV) is accounted for by an appropriate scaling of the CT images, as described later. After scaling, the attenuation-correction factors are generated by integration (forward projection) of the CT image volume along each line of response in the emission data.
will be biased unless the energy difference between CT (approximately 70 keV) and PET (511 keV) is accounted for by an appropriate scaling of the CT images, as described later. After scaling, the attenuation-correction factors are generated by integration (forward projection) of the CT image volume along each line of response in the emission data.
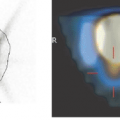
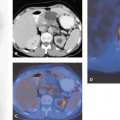
Although in principle such a straightforward method can be used to generate CT-based attenuation-correction factors, a number of practical issues may limit the accuracy of the approach. Clinical CT scans of the thoracic region are generally acquired with the arms above the head and with breath-hold at full inspiration; clinical CT of the head and neck is performed after injection of intravenous contrast; and clinical CT of the abdomen and pelvis is generally performed after administration of both oral and intravenous contrast. However, such clinical protocols may affect the accuracy of the CT-based attenuation-correction factors unless appropriate modifications are made to the standard scaling algorithm (discussed later). The duration of the PET scan may not easily be tolerated by patients with their arms above their heads, and the scan may be performed with arms in the field of view. If the PET-CT scan is to be used for radiation treatment planning, it is desirable to have the patient in the treatment position. For the CT images, this can result in complete or partial truncation of the arms or other regions due to the 50-cm-diameter transverse field of view. Attenuation-correction factors generated from truncated CT images may be inaccurate. When the CT scan is acquired with breath-hold at full inspiration and the PET scan is acquired during free breathing owing to a typical scan duration of several minutes, the images will not match, especially in the thorax, again resulting in potentially inaccurate correction factors. Finally, the use of intravenous or oral contrast will introduce pixels into the CT images with enhanced Hounsfield units that may scale incorrectly for attenuation purposes, as may also be the case with x-ray–dense foreign objects such as dental implants and prostheses. Various modifications to the basic scaling procedure and PET-CT scan protocol have been proposed to eliminate or minimize the bias that can result, although these effects are generally seen to have little clinical significance in routine PET-CT imaging, which is primarily focused on oncology. In more specialized applications, such as the use of PET-CT in cardiac imaging, these considerations may take on increased importance.
This chapter summarizes the standard algorithm for CT-based attenuation correction and then discusses modifications and protocols intended to address the issues of patient movement, including respiration; truncation of the CT images; and the presence of intravenous or oral contrast (or both) and foreign objects in the CT images. These modifications to the standard algorithm are required to ensure accurate and unbiased CT-based attenuation-correction factors, although in most cases artifacts associated with the standard approach are not of clinical concern or are well understood and well tolerated.
Computed Tomography-Based Attenuation Correction: the Scaling Algorithm
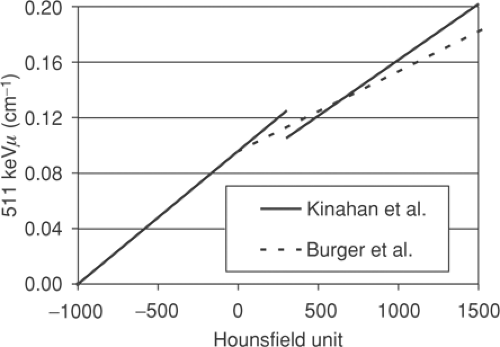
A number of approaches are possible to convert the CT attenuation map acquired at approximately 70 keV to an attenuation map at 511 keV. The x-ray beam for the CT is polychromatic, with the mean effective energy of the beam being ∼70 keV. The methods employed typically use a one-to-one bilinear mapping of measured Hounsfield units in the CT image to 511-keV linear attenuation values, as described by Kinahan et al. (2) and Burger et al. (3). The particular transformations (2,3) are depicted in Figure 7.1. The use of a bilinear function originates in the different constituent characteristics of soft tissue and bone, as seen in Figure 7.2, which shows the linear attenuation per unit density for soft tissue/water and for bone, with iodine also shown for comparison. The range of energies is selected to include the PET photon energy at 511 keV as the upper limit as well as the full CT range of energies (20 to 140 keV). The linear attenuation coefficients per unit density of water and
for the different soft-tissue types cannot be resolved separately and are taken to be the same. Bone has the higher linear attenuation coefficient per unit density at the lower CT energies because of the larger photoelectric component of the higher-atomic-number constituent, calcium, and consequently the ratio of the linear attenuation per unit density at the PET energy to that at the mean CT energy is lower for bone than for soft tissue or water by approximately 20%.
for the different soft-tissue types cannot be resolved separately and are taken to be the same. Bone has the higher linear attenuation coefficient per unit density at the lower CT energies because of the larger photoelectric component of the higher-atomic-number constituent, calcium, and consequently the ratio of the linear attenuation per unit density at the PET energy to that at the mean CT energy is lower for bone than for soft tissue or water by approximately 20%.
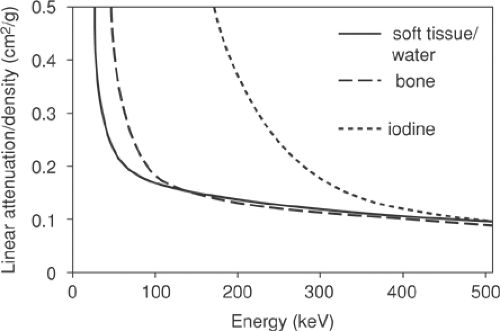 Figure 7.2 Linear attenuation per unit density as a function of energy for soft tissue/water (solid line), bone (long dashes), and iodine (short dashes). |
It is this difference due to the mineral content present in bone and the subsequent different attenuating properties that motivates the use of a bilinear function. In Figure 7.1 both methods assume that for Hounsfield units below 0 HU the tissue may be taken to be essentially equivalent to a mixture of air and water; the air (-1,000 HU) and water (0 HU) points can be mapped to their known linear attenuation values at 511 keV, and this defines the linear transformation for all points in between. Above 0 HU, in the approach of Burger et al. (3), a variable mixture of water and bone is assumed, giving increasingly lower values at 511 keV than if a waterlike material of varying density was assumed. Kinahan et al. (2) adopted a slightly different approach, identifying bone pixels as those pixels above 300 HU, with all pixels below this value assumed to be a waterlike material of varying density. This leads to a discontinuity in the transformation, as seen in Figure 7.1. Nevertheless, both these bilinear methods are reasonably successful at transforming human tissue CT values into 511-keV linear attenuation values, as has been demonstrated in studies comparing CT-based attenuation-corrected images with germanium 68 transmission-based attenuation-corrected images (4,5).
Also shown in Figure 7.2 is the curve for iodine which (bound to specific molecules) serves as a CT contrast agent. The higher atomic number of this element results in an increased photoelectric contribution at the lower CT energies compared with fluids or soft tissues, leading to a much larger linear attenuation per unit density than even that for cortical bone. At 511 keV, however, iodine has essentially the same value as that of bone and soft tissue, indicating that only the Compton scattering contribution is significant at these energies, and the concentrations of iodine in oral contrast agents used to enhance the CT image are found to have little effect at 511 keV, as is discussed in detail in the section on contrast agents. Despite the general success of the transformations in Figure 7.1 in scaling the CT images for attenuation-correction purposes, they are not adequate for precise attenuation correction in all cases. For instance, a one-to-one mapping cannot correctly scale both bone pixels and oral contrast–enhanced pixels, since they may have the same Hounsfield unit in the CT images and yet have different linear attenuation values at 511 keV. Furthermore, it is well known that measured Hounsfield units for a particular material can differ depending on the tube voltage (kVp) setting that is chosen as part of the CT protocol. Values for dense bone in particular will be dependent on this choice of kVp setting. Consequently, scaling procedures that are not dependent on the kVp setting cannot be optimized for all possible kVp settings. However, since scans are typically performed at a setting at or close to 120 kVp, for which the methods (2,3) are optimized, this is generally not an issue. Other settings that may be available, such as 80 kVp, are generally not employed, except perhaps in special cases such as pediatric cases. Nevertheless, the elimination of bias due to an unusual choice of kVp setting does require a more generalized method to take account of these effects (6).
The 2-D transverse CT images transformed to linear attenuation maps and scaled to 511 keV are then stacked to form a 3-D transmission volume image of the attenuating medium. The corresponding attenuation-correction factors for the PET emission data are generated by integrating (forward projecting) through the scaled CT volume. The attenuation-correction factor for a coincidence line of response L is given by
where μ511 (x, y, z) are the stacked, scaled linear attenuation values from the CT images and l is the integration variable along the coincidence line of response L.
Patient Respiration
Usually CT studies of the chest and abdomen are performed with breath-hold and at full inspiration, thereby eliminating respiratory motion. This is possible because of the short scan time of modern CT scanners. Such an approach is not possible for PET scans because of their longer duration; instead, the patient is breathing freely, and the acquired PET emission data correspond to an average over the respiratory cycle. This leads to the question of the most appropriate breathing protocol for the best handling of respiratory motion when performing PET-CT scans. The patient will be breathing during the PET acquisition, although it is possible to instruct the patient to adopt a different breathing protocol during the initial CT scan. Adopting the approach of conventional CT studies (i.e., instructing the patient to maintain full-inspiration breath-hold during the CT portion of the study) will tend to maximize the discrepancy between the PET and CT acquisitions due to respiration. This is because breath-hold is typically maintained at full or deep inspiration; it is not practical to expect patients to maintain breath-hold for longer periods except at full inspiration. In some respiratory protocols, most patients can do this during the critical imaging passage of CT data acquisition through the chest, which with a multi-slice device lasts only approximately 10 seconds. However, the state of full forced inspiration is far removed from any of the states of shallow or even normal breathing, and although the CT acquired in this way will be free of motion artifacts from respiration, anatomic structures will tend to be maximally displaced
from their mean position during shallow or normal respiration. For example, the anterior chest wall in full forced inspiration can be so displaced from the range of its position during shallow breathing that the anterior chest wall is not even apparent in the attenuation-corrected PET emission image.
from their mean position during shallow or normal respiration. For example, the anterior chest wall in full forced inspiration can be so displaced from the range of its position during shallow breathing that the anterior chest wall is not even apparent in the attenuation-corrected PET emission image.
Another approach in PET-CT studies is to acquire both scans with the patient performing shallow breathing. However, the CT images will now exhibit motion artifacts because the patient is not maintaining breath-hold, which can lead to artifacts in the attenuation-corrected PET image unless the CT is of the most recent multi-slice vintage. Similar problems regarding respiratory motion arise in using CT for radiation therapy planning, and many studies (7,8,9,10) have used MRI or sonography to investigate the movement associated with respiration, looking at normal, shallow (or quiet), and deep (or forced) breathing. In Korin et al. (7), MRI studies were used to examine the relative motions of the upper abdominal organs in the craniocaudal (CC), right-left (RL), and anteroposterior (AP) directions. The reported ratio for motion in the CC direction to motion in the AP direction was approximately 5 for both normal and deep breathing, and the ratios for motion in the CC direction to motion in the RL direction were approximately 6 and approximately 8 for normal and deep breathing, respectively. The main conclusion of Korin et al. is that the movement of the upper abdominal organs is primarily in the CC direction. Studies reporting the maximal excursion of the upper abdominal organs due to respiration, as determined by ultrasound or MRI, are generally consistent in the values found for both deep and normal breathing. For example, Suramo et al. (8) report the mean excursion in the CC direction as 2.5 cm for the liver, 2.0 cm for the pancreas, 2.0 and 1.9 cm for the kidneys in normal breathing. Values for deep breathing generally exceed those for normal breathing by a factor of 2 or more. Instructing the patient to breathe shallowly is expected to lead to excursions less than those for normal breathing. In shallow breathing, there also will be motion in the lower abdomen, including significant motion in the AP direction, although the motion of the upper abdominal organs at the boundary of the lungs leads to the largest artifacts in the PET image.
Related posts:
 11C-Based PET- Radiopharmaceuticals of Clinical Value
 Brain Tumors: Astrocytoma, Oligodendroglioma, and Glioblastoma Images with PET and SPECT
 Sentinel Node Imaging in Head and Neck Tumors
 PET-CT and SPECT-CT of Bone Metastases
 SPECT and PET in Benign Thyroid and Parathyroid Disease
Stay updated, free articles. Join our Telegram channel

Full access? Get Clinical Tree


