CT-Based Attenuation Correction for SPECT
Timothy G. Turkington
David R. Gilland
The addition of x-ray computed tomography (CT) to a conventional single-photon emission computed tomography (SPECT) system allows attenuation correction and anatomic localization of SPECT lesions, similar to positron emission tomography (PET)-CT. Compared with PET, SPECT images are generally of lower quality because of fewer collected counts and lower spatial resolution. Transmission scanning, which is considered to be an essential feature of any dedicated PET scanner, is commercially available for SPECT but is not widely used, even though attenuation correction is essential to providing uniform images with quantitative accuracy.
Many SPECT radiotracers provide very little anatomic information, warranting the use of correlated CT images to help with lesion localization. The issue of aligning the SPECT and CT images is minimized if both are performed by the same system in the same session, minimizing changes in body morphology between the two scans.
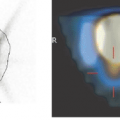
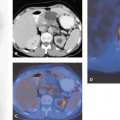
SPECT-CT systems are now commercially available from three manufacturers. One system uses the same rotating gantry for both SPECT detectors and x-ray CT tube and detectors. A very low current x-ray tube is used, matched to the relatively slow rotation speed, compared with diagnostic CT systems. The resulting CT images are adequate for attenuation correction and provide anatomic detail for many lesion-localization tasks (Fig. 8.1). The other two systems use CT systems with their own fast gantries and correspondingly high flux x-ray tubes.
Introduction
The possibility of including single-photon emission computed tomography (SPECT) and x-ray computed tomography (CT) in a single combined system was first investigated by Lang et al. (1). This group investigated the use of separately functional CT and SPECT components put together into a larger system as well as a single solid-state detector design that could be used to count the gamma rays emitted from the body in addition to measuring the flux of x-rays from an x-ray tube (2).
The appeal of combining CT and SPECT is largely the same as the appeal of combining CT and positron emission tomography (PET). SPECT imaging suffers from effects of photon scatter and absorption. SPECT images are made more accurate, therefore, by the application of attenuation correction. In most regions of the body, appropriate attenuation correction can be done only when the attenuation of the body is measured directly with a transmission scan. X-ray CT images that are aligned with the SPECT data can be used for attenuation correction if appropriate adjustments are made to the attenuation values. In addition, the anatomic information that can be deduced from radiotracer distributions is sometimes insufficient for accurate localization of SPECT lesions. The inherently registered x-ray CT resulting from dual-modality scanning can provide the required anatomic localization, alleviating the problems that occur in the very complex task of retrospectively matching SPECT and x-ray CT images by using software algorithms.
Differences between PET and SPECT
Although PET and SPECT are quite similar in concept and use, important differences may have implications for how
the addition of CT to either modality should be designed and implemented.
the addition of CT to either modality should be designed and implemented.
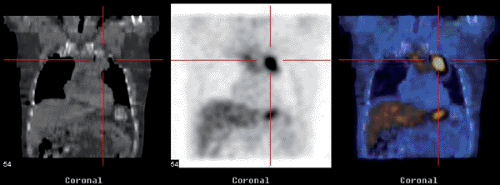 Figure 8.1 SPECT-CT study. At left is an x-ray CT image. In the middle is the corresponding SPECT image (gallium 67 citrate). At the right, the SPECT is superimposed on the CT. |
Attenuation
The absorption or scatter of photons emitted from radiotracers, whether positron emitting or single-photon emitting, results in a reduction of detected events. This loss of events can dramatically degrade both the quantitative accuracy and visual quality of the resulting images. In Figure 8.2, attenuation of a single photon and an annihilation photon pair is illustrated.
The single photon must traverse a path length d in tissue before leaving the body. The probability that this photon survives attenuation is given by
P = e-μd
where d is the path length of the photon through the body and μ is the linear attenuation coefficient. For the photon pair, the probability that both photons survive is the product of the individual survival probabilities:
P = P1P2 = e-μd1e-μd2 = e-μ(d1 + d2)
where d1 and d2 are the path lengths of the two photons in the body. Although these equations assume a constant μ (uniform attenuation within the body), the following points also are true for more general body features, including bone, lungs, and gas. These two important points can be made in comparing the single-photon case with the positron case. The first is that because both photons must survive for the event to be detected, attenuation effects are greater in PET imaging than in SPECT, at least from a quantitative perspective. The magnitude of this effect is illustrated in Figure 8.3.
The second point is that whereas the attenuation probability would be the same for any photon pair emitted along a path shown for the pair in Figure 8.2, regardless of where the annihilation point is on that path (because the final answer depends only on the total path length d1 + d2), with single-photon emission, the amount of attenuation depends on the particular emission point of the photon on any particular path. This feature makes accurate attenuation correction of single-photon imaging more difficult. For PET, because all photon pairs emitted and possibly detected in a given line are attenuated by the same probability, the raw data (the counts obtained for that line) can be corrected by a well-defined factor before reconstruction. For SPECT, the most accurate attenuation correction can be done only once an estimate of the radioactivity distribution has been made. An iterative algorithm is therefore required that can simultaneously improve the tracer distribution estimate with each update and use accurate attenuation compensation.
The second point is that whereas the attenuation probability would be the same for any photon pair emitted along a path shown for the pair in Figure 8.2, regardless of where the annihilation point is on that path (because the final answer depends only on the total path length d1 + d2), with single-photon emission, the amount of attenuation depends on the particular emission point of the photon on any particular path. This feature makes accurate attenuation correction of single-photon imaging more difficult. For PET, because all photon pairs emitted and possibly detected in a given line are attenuated by the same probability, the raw data (the counts obtained for that line) can be corrected by a well-defined factor before reconstruction. For SPECT, the most accurate attenuation correction can be done only once an estimate of the radioactivity distribution has been made. An iterative algorithm is therefore required that can simultaneously improve the tracer distribution estimate with each update and use accurate attenuation compensation.
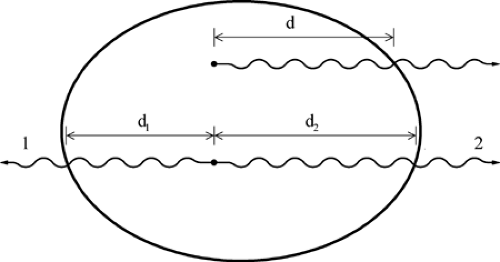 Figure 8.2 Comparison of attenuation in PET and SPECT. For SPECT, the single photon must survive, and its survival depends on the path it traverses through the body. For PET, both photons must survive. The negative implication is that overall attenuation probabilities are high. The positive implication is that the attenuation probability is the same for all photon pairs emitted along the same line of response. |
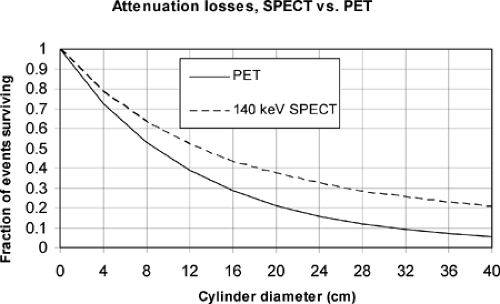 Figure 8.3 Attenuation losses in PET and SPECT. The curves indicate the number of events surviving attenuation for a uniform distribution of radioactivity in circular cylinders of varying radii. SPECT curves use attenuation appropriate for 140 keV.
Related posts: 11C-Based PET- Radiopharmaceuticals of Clinical Value 11C-Based PET- Radiopharmaceuticals of Clinical Value
 Brain Tumors: Astrocytoma, Oligodendroglioma, and Glioblastoma Images with PET and SPECT Brain Tumors: Astrocytoma, Oligodendroglioma, and Glioblastoma Images with PET and SPECT
 Sentinel Node Imaging in Head and Neck Tumors Sentinel Node Imaging in Head and Neck Tumors
 PET-CT and SPECT-CT of Bone Metastases PET-CT and SPECT-CT of Bone Metastases
 SPECT and PET in Benign Thyroid and Parathyroid Disease SPECT and PET in Benign Thyroid and Parathyroid Disease
Stay updated, free articles. Join our Telegram channel
Full access? Get Clinical Tree
 Get Clinical Tree app for offline access

|