Myocarditis is an acute inflammatory process resulting from various infectious (mostly viral), immune, and nonimmune causes in the absence of ischemic injury. In many cases, myocarditis does not identify itself by specific cardiovascular symptoms or electrocardiogram (ECG) abnormalities, thus making diagnostic decisions difficult. Because many cases are not detected at the time of the acute illness, the true incidence and prevalence of myocarditis remain unknown. What is known, however, is that myocarditis is more prevalent in young men, who are also at greater risk of fatal myocarditis. Furthermore, myocarditis can be the underlying cause of dilated cardiomyopathy. Often, myocarditis causes nonspecific symptoms such as fatigue, dyspnea, palpitations, and fever. Occasionally, chest pain or ECG changes may mimic an acute coronary syndrome or may result in heart failure. The ECG may show ST-segment changes, arrhythmias, or atrioventricular block; laboratory tests may show elevation in the creatinine kinase or troponin, or both. However, these tests have limited sensitivity. Although endomyocardial biopsy is still considered the gold standard for diagnosing myocarditis, the value of myocardial biopsy is decreased by its low sensitivity, its high interosberver variability, and the invasive nature of this procedure. Cardiovascular magnetic resonance (CMR) offers the advantages of noninvasiveness and safety. It is also of special importance because of its ability to visualize tissue abnormalities associated with acute or severe remote inflammation.
Specific Value of Cardiovascular Magnetic Resonance in Myocarditis
Since the late 1990s, CMR has emerged as a widely used tool for diagnosing myocarditis. In addition to the accuracy of functional and morphologic CMR data, this popularity mostly results from the value added by the ability of CMR to assess the activity of inflammatory changes including myocardial edema, hyperemia or capillary leak, and the degree of irreversible injury as defined by fibrosis.
Functional and Morphologic Ventricular Abnormalities
CMR is the noninvasive diagnostic tool of choice for assessing ventricular anatomy, structure, and function. This technique also allows the assessment of pericardial effusion.
High-resolution cine imaging with the best current steady-state free precession (SSFP) technique is widely considered the gold standard for the assessment of systolic function, ventricular volumes, and myocardial mass. Although nonspecific for myocarditis, cine CMR may reveal wall motion abnormalities that may be segmental or more diffuse, as well as transient increases of left ventricular (LV) volume. In severe forms of myocarditis, the LV ejection fraction can be severely depressed; however, LV dysfunction alone has a low sensitivity of 54% with a specificity of 76% and an overall accuracy of 64%.
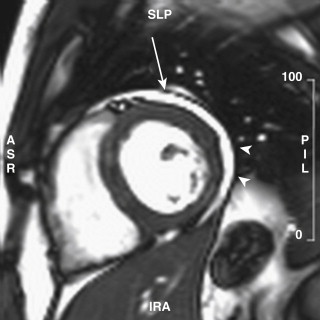
Pericardial effusion is noted in 32% to 57% of patients with myocarditis. SSFP sequences are T1 or T2 weighted and therefore demonstrate pericardial effusion with bright signal intensity (SI) ( Fig. 26-1 ). However, the differentiation from equally bright epicardial fat may be difficult. Epicardial fat is typically separated from pericardial effusion by a chemical shift artifact layer (see Fig. 26-1 ). Although nonspecific, pericardial effusion and LV dysfunction provide additional support for the presence of myocarditis.
Myocardial Edema
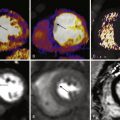
Because of interstitial edema and lymphocyte infiltrate with myocytolysis, free water content is increased in acute myocarditis. As a result, tissue T2 relaxation time is increased and causes hyperintense areas on T2-weighted images. In 1991, Gagliardi et al reported their preliminary results in 11 patients with clinically suspected myocarditis. These investigators demonstrated that, in patients with histologically confirmed myocarditis, abnormal SI of the myocardial walls was detected using T2-weighted spin echo sequences. In later years, T2-weighted imaging was optimized, leading to much better image quality. Today, detection of myocardial edema is typically performed by short tau inversion recovery (STIR) pulse sequences. This technique consists of black-blood, T2-weighted triple inversion recovery with inversion pulses for fat and blood suppression. These pulse sequences are sensitive to the long T2 of water protons and provide excellent contrast between edematous myocardial tissue and normal myocardium. Edema in acute myocarditis may have a global ( Fig. 26-2 , A ) or a regional ( Fig. 26-3 , A ) distribution.


Because global edema is sometimes not recognizable to the eye, quantitative analysis is recommended (see the later discussion of global and regional edema assessment) by normalizing the SI of the myocardium to that of the skeletal muscle (T2 ratio). A T2 ratio of 2 or more is considered positive for myocardial edema (see Fig. 26-2 , B ). A high diagnostic accuracy of T2-weighted sequences (T2 ratio) has been shown in tissue edema detection in myocarditis. A group of experts proposed a set of criteria for the CMR diagnosis of myocarditis in which global edema (T2 ratio) and regional edema comprise one of three criteria for myocarditis. The other criteria are abnormal delayed hyperenhancement (fibrosis) and global relative enhancement (early enhancement) and are discussed in detail in the following sections.
The image quality of STIR may be limited by motion artifacts and its inherently low signal-to-noise ratio. Other T2-weighted sequences have been proposed. The value of T2 mapping for assessing myocardial inflammation appears promising, but it has yet to be established.
Myocardial Hyperemia (Myocardial Early Gadolinium Enhancement)
Tissue hyperemia, a component of the myocardial inflammatory reaction, can be detected by contrast-enhanced T1-weighted fast spin echo techniques with image acquisition during the first 3 minutes after gadolinium (Gd) injection. This technique visualizes reversible myocardial signal changes in acute myocarditis that showing Gd accumulation in regions of suspected myocardial inflammation. This Gd accumulation causes contrast enhancement compared with noninflamed myocardium. Increased volume of distribution from acute cell damage allows Gd enter into the intracellular space and could explain enhancement in the pathologic areas. Contrast-enhanced magnetic resonance imaging (MRI) was initially reported in 2 patients with myocarditis. Friedrich at al were the first to report an ECG-triggered T1-weighted contrast-enhanced technique in 44 patients with suspected acute myocarditis. These investigators measured the global relative signal enhancement of the LV myocardium related to skeletal muscle and found a focal myocardial enhancement pattern in the acute phase and a more diffuse pattern later. Other studies have confirmed the diagnostic value of this sequence in acute myocarditis.
Similar to the analysis of the T2-weighted images for edema, SI derived from regions of interest (ROIs) over the myocardium is compared with a reference ROI of skeletal muscle, and a normalized enhancement ratio (early Gd enhancement ratio [EGE ratio]) is calculated. An EGE ratio of 4 or more or an absolute increase of myocardium enhancement 45% or more is considered positive for myocardial inflammation ( Fig. 26-4 ) and represents one of the three CMR criteria for myocarditis.

Fibrosis
Late Gd enhancement (LGE) imaging allows visualization of myocardial necrosis and fibrosis. This type of imaging, performed 10 to 20 minutes after contrast injection, uses inversion recovery gradient echo sequences with the inversion time set to null viable myocardium.
Gd, an extracellular agent, easily distributes in extracellular fluid space but not into intact myocyte cell membrane. In the acute stage of necrosis, cell membrane rupture allows Gd to enter into cells, and the volume of contrast distribution is increased. This process results in local accumulation of Gd with subsequently high SI values (hyperenhancement, LGE). In the chronic setting, necrotic myocytes are replaced by fibrous tissue, and the interstitial space is expanded. These changes lead to increased Gd concentration and hyperenhancement. This technique was initially developed for the noninvasive detection of myocardial scarring in coronary artery disease. The main difference from infarcted regions is that areas of tissue damage within myocarditis generally do not involve the subendocardial layers in an isolated fashion; this characteristic distinguishes ischemic (which always has subendocardial involvement) from nonischemic injury. Moreover, areas of tissue damage in myocarditis are usually smaller and not as bright as infarct enhancement because inflammatory areas usually contain more living myocytes between the islands of necrosis than in myocardial infarction.
Several controlled studies investigated late contrast-enhanced CMR in patients with suspected myocarditis and confirmed a high specificity of LGE for the detection of irreversible injury. The pattern of myocardial fibrosis in myocarditis varies considerably, but it typically involves the subendocardial or midmyocardial wall focally without being confined to a coronary distribution. Usually, the inferolateral wall is involved ( Fig. 26-5 ), and the anteroseptal segments are involved less frequently (see Fig. 26-5 ). In 2006, Mahrholdt et al suggested that in the setting of parvovirus B19 myocarditis, lateral subepicardial LGE was the most frequent distribution, and midwall interventricular septum LGE was the most common in human herpesvirus 6 myocarditis.

Areas of high SI in LGE images, however, may also appear focally transmural ( Fig. 26-6 ) or diffuse ( Fig. 26-7 ). The presence of myocardial fibrosis is more common in younger men compared with women, with an almost twofold greater frequency of myocardial fibrosis in men. LGE is one of the three criteria for the CMR diagnosis of myocarditis.


International Consensus on Cardiovascular Magnetic Resonance in Myocarditis: Lake Louise Criteria
Several controlled trials evaluated the diagnostic accuracy of individual or combined CMR methods in patients with suspected acute myocarditis ( Table 26-1 ). More recently, a group of CMR and myocarditis experts pooled these data and found that the combination of these methods was the most appropriate approach to achieve the highest diagnostic accuracy, sensitivity, and specificity. If two or more of the three criteria are positive, myocardial inflammation can be predicted or ruled out with a diagnostic accuracy of 78%; if only LGE imaging is performed, the diagnostic accuracy is 68% ( Table 26-2 ). The international consensus group on CMR in myocarditis proposed diagnostic CMR criteria for myocarditis that are known as the Lake Louise criteria ( Table 26-3 ).
| CMR Parameters | Accuracy (%) | Sensitivity (%) | Specificity (%) |
|---|---|---|---|
| Single Approach | |||
| T2 Signal Intensity Ratio | |||
| Laissy | 59 | 45 | 100 |
| Rieker | 76 | 100 | 50 |
| Abdel-Aty | 79 | 84 | 74 |
| Gutberlet | 67 | 67 | 69 |
| Myocardial Early Gadolinium Enhancement | |||
| Friedrich | 86 | 84 | 89 |
| Laissy | 89 | 85 | 100 |
| Abdel-Aty | 74 | 80 | 68 |
| Gutberlet | 72 | 63 | 86 |
| Late Enhancement | |||
| Rieker | 52 | 45 | 60 |
| Abdel-Aty | 71 | 44 | 100 |
| Mahrholdt | 96 | 95 | 96 |
| Gutberlet | 49 | 27 | 80 |
| Yilmaz | 51 | 35 | 83 |
| Combined Approach | |||
| Any 1 of 3 | |||
| Abdel-Aty | 75 | 100 | 48 |
| Gutberlet | 67 | 81 | 49 |
| Any 2 of 3 | |||
| Abdel-Aty | 85 | 76 | 96 |
| Gutberlet | 73 | 63 | 89 |
| CMR Parameters | Accuracy (%) | Sensitivity (%) | Specificity (%) |
|---|---|---|---|
| Single Approach | |||
| T2 signal intensity ratio ( n = 178) | 70 | 70 | 71 |
| Myocardial early gadolinium enhancement ( n = 19) Late enhancement ( n = 336) | 78 68 | 74 59 | 83 86 |
| Combined Approach | |||
| Any 1 of 3 ( n = 130) | 70 | 88 | 48 |
| Any 2 of 3 ( n = 130) | 78 | 67 | 91 |
| If clinical criteria for myocarditis are met, CMR findings are consistent with myocarditis if two of the following CMR criteria are present: | ||
| Criteria | Signal Intensity Threshold | CMR Sequences |
| Global myocardial edema or regional edema | T2 ratio ≥2 | T2-weighted images (STIR) |
| Increased myocardial early gadolinium enhancement | EGE ratio ≥4 | T1-weighted images (T1 FSE/TSE precontrast/postcontrast) |
| Presence of late enhancement | Visual assessment | Phase sensitive IR-GE |
Indications for Lake Louise Criteria Assessment
The Lake Louise criteria for CMR are applicable only in patients with suspected myocarditis who have the following clinical presentation: recent onset or persisting symptoms (dyspnea, palpitations, chest discomfort, or fatigue); and evidence of significant myocardial injury (ventricular dysfunction or new ECG changes or elevated troponin) in the absence of coronary artery disease.
Cardiovascular Magnetic Resonance Protocol
The international consensus group on CMR in myocarditis proposed a comprehensive CMR protocol including assessment of global or regional myocardial edema, global relative enhancement, and LGE.
Global and Regional Edema Assessment
A STIR spin echo sequence is recommended with suppression pulses for blood and fat. Because of the required SI quantification, the body coil or an SI correction algorithm is recommended to avoid signal inhomogeneity. A slice thickness of 10 to 15 mm is required to maximize the signal-to-noise ratio. Short-axis slices covering the base, middle, and apex of the heart are recommended.
Myocardial edema appears as bright areas of high SI in T2-weighted images. In case of global myocardial edema, quantitative assessment is recommended by normalized SI quantification with manually traced endocardial and epicardial contours of the entire visible myocardium and skeletal muscle in the same slice (T2 SI ratio; see Fig. 26-2 , B ). To identify skeletal muscle correctly, SSFP sequences or T1-weighted images are recommended to trace an ROI at the same slice position. Myocardial SI is related to that of the skeletal muscle by using the following equation:
Relative myocardial T 2 SI = SI myocardium SI skeletal muscle
A ratio of 2 or more is considered positive for global myocardial edema. Because skeletal muscle is used as a reference, this ratio is valid only in patients without clinical evidence of active myositis. No studies have addressed the diagnostic accuracy of T2 ratio in case of involvement of skeletal muscle in systemic inflammation.
Although regional edema can be identified visually, quantitative assessment of the signal abnormalities is recommended. Regional edema is defined by a regional area (of ≥10 adjacent pixels) of SI of at least 2 standard deviations (SD) of remote myocardium in the absence of artifacts in any of these regions (see Fig. 26-3 , B ). Regions of increased SI that did not follow the contour of the myocardium or crossed endocardial or epicardial surfaces are usually considered image artifacts.
Myocardial Early Gadolinium Enhancement Assessment
T1-weighted turbo spin echo sequences should be applied in three short-axis slices (basal, middle, and apical region) before and during the first 3 minutes after an intravenous contrast bolus of 0.1 mmol/kg. Similar to T2-weighted imaging, the use of the body coil or SI correction software is required. The acquisition is performed during free breathing. If image quality is insufficient in short-axis views, axial slices can be acquired. Quantitative evaluation of an EGE ratio is required and calculated by using a similar T2 ratio approach. An ROI in the LV myocardium and in the skeletal muscle within the same section is drawn on the precontrast T1-weighted images and is copied to the postcontrast images (see Fig. 26-4 ). The EGE ratio is calculated by using the following equation:
EGE ratio = ( SI [ myocardium post ] − SI [ myocardium pre ] ) / SI [ myocardium pre ] ( SI [ sm post ] − SI [ sm pre ] ) / SI [ sm pre ]
Related posts:
Stay updated, free articles. Join our Telegram channel

Full access? Get Clinical Tree


