De Novo Brain Tumor Evaluation: Use of Individual and Combined DSC, DCE, and ASL for Diagnosis and Differentiation
Jalal B. Andre
Pia C. Sundgren
Mark S. Shiroishi
Meng Law
Magnetic resonance imaging (MRI) is the current gold standard for the evaluation and management of central nervous system (CNS) neoplasms, playing an essential role in initial lesion characterization, grading, and directed therapy planning, including surgical guidance and radiotherapeutic decision making. MRI also enjoys a central role in monitoring treatment effects throughout the course of therapy, including evaluation for tumor progression, identification of unwanted therapeutic side effects, and monitoring for tumor recurrence once active treatment has been completed.
An early observation that a disrupted blood–brain barrier (BBB) could result in significant regional contrast enhancement1 lead to an initial focus on morphologic lesion characterization, requiring only static MRI obtained with and without administration of a gadolinium-based contrast agent (GBCA), which is still performed in routine clinical practice today. However, the heterogeneous nature of intracranial neoplasms eventually beckoned a multimodal approach to imaging, even within the context of applied MRI techniques. Concentrating on the more specific framework of primary intracranial neoplasms, directed evaluation of tumor vascularity was sought based on the intimate relation between angiogenesis and prognosis across several tumor types, especially as related to microvascular density.2,3,4 Thus, interrogation of intracranial lesions was performed with perfusion techniques in the hope that such evaluation might benefit a deeper understanding of the pathologically complex process of angiogenesis, known to occur in select intracranial tumors and addressed in greater detail in Chapter 55. Perfusion techniques that can extrapolate metrics, such as cerebral blood volume (CBV), blood flow (CBF), and endothelial permeability, have been considered effective in more optimally characterizing angiogenesis and will be discussed in this chapter. In this capacity, evaluating intracranial tumors via morphologic, diffusion, perfusion, and even spectroscopic techniques is thought to increase diagnostic accuracy at any point in the treatment process. Nevertheless, in this chapter, the discussion will focus on optimal perfusion techniques for intracranial tumor evaluation.
The more common current methods for performing MRI-based cerebral perfusion-weighted imaging (PWI) include dynamic contrast-enhanced (DCE) T1-weighted, dynamic susceptibility-weighted contrast (DSC) T2*-weighted, and arterial spin labeling (ASL) perfusion MRI. DCE, DSC, and ASL are becoming increasingly available on clinical scanners and more routinely used at academic and some community centers to evaluate de novo brain lesions (Fig. 57.1). Research in imaging de novo tumors with these techniques has paralleled their increasing clinical availability. Although each of these techniques affords unique benefits and, individually, can be sufficient to address a specific question, there exist opportunities to combine two or perhaps all three techniques to better assess a given lesion. Although ASL must be performed prior to administration of an intravascular gadolinium-chelated contrast agent (such as gadopentetate dimeglumine or others), DCE and DSC can be performed in tandem by using either half-dose (per individual sequence) or full-dose (double dose, total) techniques at the same imaging session (with appropriate attention paid to concerns for nephrogenic systemic fibrosis [NSF]). For more details on NSF, the interested reader is referred to Chapters 7 and 8.
This chapter will thus review the use of these perfusion techniques as they apply specifically to the imaging of intracranial neoplasms, with a focus on MR perfusion-based approaches to de novo intracranial tumor evaluation and their early management. Suggested interpretations for each imaging modality will be reviewed, and a discussion of possible differential considerations will be made, allowing for distinction among differential possibilities, where appropriate.
Diagnosis and Differentiation of De Novo Tumors
The application of perfusion techniques to tumor imaging beckons, at the very least, a brief review of the main premise of each technique (DCE, DSC, ASL) as applied to tumor imaging (with reference made to appropriate prior chapters for additional in-depth details regarding each of these techniques). Much of perfusion-based tumor imaging today relies on identification of surrogate markers for angiogenic activity and may be better described as the imaging of angiogenesis (Table 57.1).5 CBV has historically been a dominant focus in tumor imaging, based on the relation between microvascular density and tumor behavior in histologic studies, and is most commonly evaluated with DSC PWI. CBV appears to closely correlate with glioma grade and prognosis but is a nonspecific marker for, and represents
only one facet of, angiogenesis. Other studies have therefore focused on imaging the marked variation in tumor vessel size as an attempt to improve the specificity of these imaging studies, such as using combined multiecho spin and gradient-echo readouts to better differentiate the large and small vessel contributions in the vascular tumor bed6 (see also Chapters 11, 12, 13, 28 and 32). Other research has focused on disturbances in regional blood flow associated with tumor angiogenesis, which might be imaged with ASL or T2*-based DSC techniques.7,8
only one facet of, angiogenesis. Other studies have therefore focused on imaging the marked variation in tumor vessel size as an attempt to improve the specificity of these imaging studies, such as using combined multiecho spin and gradient-echo readouts to better differentiate the large and small vessel contributions in the vascular tumor bed6 (see also Chapters 11, 12, 13, 28 and 32). Other research has focused on disturbances in regional blood flow associated with tumor angiogenesis, which might be imaged with ASL or T2*-based DSC techniques.7,8
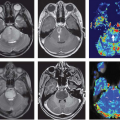
 FIGURE 57.1. Morphologic 3T magnetic resonance (MR) imaging demonstrates a partially cystic and partially enhancing lesion involving the posterior left frontal cortex, centrum semiovale, and posterior temporal lobe, with associated surrounding edema demonstrated on sagittal (A) and axial (C) T1-postgadolinium and axial T2-weighted (B) images. Associated dystrophic, coarse microcalcification is depicted on the axial noncontrast computed tomography image (E). Pseudo-continuous arterial spin labeling image (D) demonstrates two discrete foci of increased cerebral blood flow in this same region, although differing slightly in anatomic location compared with the enhancing components. Proton two-dimensional multivoxel chemical shift MR spectroscopic image (F) obtained with TE equal to 144 milliseconds demonstrates decreased N-acetyl-aspartate (2.01 ppm) and creatine (3.02 ppm) peaks relative to an increased choline peak (3.21 ppm), and small inverted lactate peak (1.31 ppm); the MR spectroscopic signature is suggestive of a high-grade primary intracranial neoplasm. T2*-based dynamic susceptibility contrast (DSC) perfusion imaging was performed during the first pass bolus of a gadolinium agent (Prohance) on a 3T MR system (using the contrast administration during subsequent dynamic contrast enhancement [DCE] perfusion-weighted imaging [PWI] acquisition to minimize leakage effects). A 3D principles of echo shifting with a train of observations (PRESTO) sequence was utilized to derive a series of 50 volumetric acquisitions acquired at 1.5-second intervals, utilizing the first 10 acquisitions as a baseline prior to the injection of contrast. A 20-mL contrast bolus was administered at a rate of 5 mL/s via power injector, followed by a 20-mL saline flush. Images were coregistered to a high-resolution T1-weighted axial 3D magnetization prepared rapid turbo gradient echo sequence (not shown), acquired immediately following the DSC acquisition using the same field of view, slice position, and angulation. Signal intensity time curve during contrast bolus passage (G), raw data (H), and color relative cerebral blood flow (rCBV) map (I) are shown depicting regions of elevated rCBV in the vicinity of the enhancing tumor and elevated CBF in (D). Note the shape of the signal intensity time curve (G) is suggestive of a high-grade neoplasm, with associated sharp decreased signal upon arrival of contrast, followed by rapid, partial recovery of the signal, which approximates, but does not reach baseline, similar to that seen in Figure 57.11D, and described by several authors. DCE-PWI was performed (prior to DSC acquisition) with gadolinium dose in mL = (weight in kg) × 0.2 mL/kg. An injector delay of 55 seconds, and rate of 5 mL/s were employed. Five very short T1 mapping sequences were obtained with variable flip angles preceding the T1 DCE sequence. Prenormalization contrast agent uptake curve (J) demonstrating an initial moderate uptake of contrast followed by a plateau phase indicative of high-grade primary neoplasms. Raw data (K), and color CBV map (L) images are provided for reference. The constellation of findings was most consistent with glioblastoma multiforme, which was confirmed on stereotactic biopsy. Note: the cystic component is best seen on the sagittal image (A). |
TABLE 57.1 QUANTITATIVE IMAGING BIOMARKERS of ANGIOGENESIS | ||||||||||||
|---|---|---|---|---|---|---|---|---|---|---|---|---|
| ||||||||||||
Alternatively, the marked increase in endothelial permeability associated with vascular endothelial growth factor (VEGF) activity raises the possibility of directly quantifying the permeability of tumor vessel endothelia using MR relaxivity-based techniques that rely on models of contrast distribution. DCE (see Chapters 23, 30, 31 and 35), as an MR PWI technique in evaluating de novo tumors, has historically been reserved for evaluation and estimation of impairment of the BBB, which assesses the passage or leakage of contrast material into the extravascular space. This has been traditionally achieved using dynamic T1-weighted (T1W) steady-state free precession (SSFP) gradient-echo (GE)-based PWI techniques (also known as DCE-MRI) in conjunction with pharmacokinetic models such as those developed by Tofts and Kermode.9 This method is alluring as it allows for derivation of several kinetic parameters, including: Ktrans (the volume “transfer constant” between blood plasma and the extravascular-extracellular space [EES], previously known as the endothelial surface area product [k], notably when permeability is low); kep (the “rate constant” between the EES and blood plasma); ve (also know as EES, defined as the volume of EES per unit volume of tissue); and vp (the blood plasma volume per unit volume of tissue).10 These values have been used as surrogates for endothelial permeability. The greatest tradeoff in using a DCE-based perfusion technique is the relatively prolonged scan time (5 to 10 minutes), which can be much longer than that of its DSC-based counterpart (<3 minutes), making it less clinically desirable. This technique, as it applies to tumor imaging, will be discussed within specific sections in this chapter, as appropriate.
DSC-PWI is a commonly reported MR perfusion method used to evaluate de novo primary brain neoplasms, notably via assessment of relative CBV (rCBV) using the contralateral normal appearing white matter as an internal reference.11,12 The use of rCBV reportedly obviates the need for measurement of an arterial input function and simplifies postprocessing, making it desirable for clinical work (with tumors). The DSC technique is T2*-based, relying on local changes in the R2* relaxation rate (ΔR2*) within the intravascular and interstitial spaces during the first pass of a paramagnetic (gadolinium-containing) contrast agent (CA), in which local signal intensity is reduced within the intravascular and surrounding interstitial spaces, as depicted in Figure 57.1G (signal intensity time curve). This is usually imaged with a 1- to 2-second temporal resolution. Here, ΔR2* is proportional to the concentration of contrast agent in the tissue such that CBV is proportional to the area under the curve of ΔR2* at any given point in time (t), as depicted in Figure 57.2 (concentration-time curve). It is important to note that the area under the curve of ΔR2*(t) of the concentration-time curve does not traditionally provide an absolute measure of CBV (although a “bookend” method has been recently described suggesting otherwise (see Chapter 27).13 Thus, intersubject comparisons have been performed using an internal reference standard, typically obtained in the contralateral normal appearing white matter, as previously described, and allowing for derivation of the obtained ratio known as the rCBV, as mentioned previously. Although this technique has been an accepted standard, it is prudent to recall that certain tumors (e.g., infiltrative tumors such as glioblastoma multiforme [GBM]) can harbor disease in apparently normal appearing tissue and within the contralateral hemisphere, thus, potentially confounding rCBV measurements.
The DSC technique traditionally relies on a GE single-shot echo planar imaging (EPI) readout (see Chapter 12).
The distinction in using the GE-EPI technique is critical since CBV values obtained when using a spin-echo (SE) readout are generally lower due to decreased sensitivity to macrovascular components (on the order of 20 to 100 μm) (see Chapter 11 for more details).14,15 The DSC method assumes that changes in relaxivity are proportional to the local concentration of gadolinium flowing in nearby vessels, as discussed in other chapters. Specifically, the changes in signal intensity are usually characterized by the peak height, as discussed below.12
The distinction in using the GE-EPI technique is critical since CBV values obtained when using a spin-echo (SE) readout are generally lower due to decreased sensitivity to macrovascular components (on the order of 20 to 100 μm) (see Chapter 11 for more details).14,15 The DSC method assumes that changes in relaxivity are proportional to the local concentration of gadolinium flowing in nearby vessels, as discussed in other chapters. Specifically, the changes in signal intensity are usually characterized by the peak height, as discussed below.12
 FIGURE 57.2. Concentration-time curve demonstrating possible T1 and T2* effects in the setting of GBCA extravasation related to a leaky blood–brain barrier (BBB), without correcting for endothelial leakage of contrast agent. Possible underestimation of the tissue contrast agent concentration in the presence of BBB leakage due to T1 effects is illustrated by the blue curve, while possible overestimation of contrast agent concentration may be caused by (uncorrected) increased T2* effects, illustrated by the red curve. CBV, cerebral blood volume; GBCA, concentration of gadolinium-based contrast agent. (Figure provided courtesy of Heiko Schmiedeskamp, PhD.) |
One important consideration regarding the DSC technique, as it applies to brain tumor evaluation, is that it is dependent upon the intravascular indicator dilution theory, such that CBV is proportional to the area under the contrast agent concentration-time curve specifically in the absence of recirculation and contrast material leakage.16 Disruption of the BBB, which violates the central volume principle (i.e., what flows in on the arterial side should exit on the venous sided)17,18 used in T2*-weighted DSC-PWI data processing, is relatively common in many brain tumors, as evidenced by the presence of contrast enhancement. In addition, recirculation of GBCA also commonly occurs and has been shown to result in differences in CBV (and subsequently MTT) calculation.19,20 In a study evaluating four different methods to determine both relative and absolute CBV, Perkio et al.19 demonstrated significant, method-dependent differences in precision and accuracy of CBV calculation. These authors concluded that numerical integration over the whole image range (whole time series) was optimal for computational efficacy, signal-to-noise ratio (SNR), and accuracy of relative values (which are most commonly employed in tumor imaging), but that absolute CBV measurements (typically derived in acute stroke imaging) were most optimally derived from the area under the singular value decomposition deconvolved tissue curve. Similar observations have been made by others regarding tumor imaging, who suggest that the concentration-time curve should be integrated beyond the first bolus passage of GBCA.20 In this regard, most experts agree that a long sampling duration of 90 to 120 seconds is requisite, and that it is essential to begin image acquisition (approximately 10 secconds) before the injection of contrast in order to achieve a steady state in the baseline images.21
Dynamic Susceptibility-Weighted Contrast Caveats
A significant drawback to the standard GE-EPI technique, as applied to tumor imaging, is its sensitivity to T1-shortening effects, which is exacerbated by the increased endothelial leakage commonly seen with infiltrative tumors such as GBM. In this case, CA extravasates into the EES and results in T1 shortening, falsely increasing the surrounding MRI signal intensity (already during and) after bolus passage and thereby decreasing the concentration-time curve, as demonstrated in Figure 57.2. Because DSC PWI is based on a drop in signal resulting from the T2* effects of CA, the associated false increase in signal created by T1-leakage effects risks a falsely decreased estimation of the area-under-the-signal intensity time curve, resulting in an underestimation of CBV (also compromised by the observation that the measured CBV actually contains elements of ve and vp).22 This is of critical importance because many earlier published reports of CBV assessment in brain tumors may not have appropriately corrected for this observation and this calls into question many of the previously reported “threshold” values. Multiecho GE-EPI–based PWI acquisitions appear to produce perfusion data that are independent of T1-shortening effects23,24,25,26 but do not correct for T2 and T2* effects, specifically the increased contrast distribution volume due to leakage, which may risk an overestimation of tumor rCBV, as demonstrated in Figure 57.2.20,26,27,28
Accounting for leakage of contrast material then becomes paramount to avoid over- or underestimation of CBV.20,26 Therefore, methods should be implemented to account for leakage correction, notably to diminish the T1, leakage effects (although T2 and T2* leakage effects should also be corrected).26 The former can be achieved in several ways, although perhaps the simplest method is the use of a preload bolus of contrast (typically 3 to 5 cc of a 0.1 mmol of gadolinium per kilogram of body weight dose). This has the added benefit of improving results for several possible postprocessing methods that may be applied.20 Nevertheless, it is worth noting that “preloading” will result in some loss of dynamic information, especially as it pertains to the passage of CA across a leaky endothelium, since the contrast dynamics of DCE PWI are driven by the concentration difference between the plasma space and the EES. Preloading will decrease this concentration gradient, thereby decreasing the fidelity of subsequent DCE-PWI measurements when tandem DSC and DCE acquisitions are performed. At the same time, using a contrast “preload” dose also appears to eliminate the potential for tumors to be associated with erroneously calculated “negative” rCBV values.20 When using a preload dose, it has been suggested that a full “single dose” of contrast agent be used for the ensuing DSC-PWI acquisition (typically 0.1 to 0.2 mmol of gadolinium per kilogram of body weight, although favoring a smaller dose when concerned for possible NSF, as discussed below). As mentioned in previously, the use of a preload dose is removing T1-shortening effects during and after the bolus passage, but caution needs to be exercised because the leakage effects will be elevating both the first pass peak as well as the postbolus baseline20 because the contrast agent will not only reside in the vascular space but also in the EES. A correct modeling approach to account for this leakage is therefore warranted.
Optimizing the echo time (TE) and repetition time (TR) is also an appropriate consideration for tumor imaging. When using a single echo GE-EPI technique at 1.5T, the
optimal T2*tissue contrast has been reported for TEs to be between 40 and 60 milliseconds, while the optimal TE for the CA is reportedly lower, simultaneously providing an increase in the SNR.29 The tissue TE for T2* DSC imaging at 3T is lower, and a TE equal to 21 milliseconds has been reported to be optimal.30,31 Regarding TR, early published simulation experiments suggest that the TR should be less than 1.5 seconds to minimize error (<25%) in CBF calculation.32 Nevertheless, more recent frequency domain evaluations have shown that a shorter TR may improve SNR and the accuracy of CBF estimation, but the improvement in CBF accuracy for TR values less than 2 seconds has been found to be negligible.33 An important consideration is that as the TR is further decreased, there is concomitant increase in the influence of T1 relaxation within the vascular compartment potentially affecting arterial input function. In addition, the mean transit time of the cerebral vasculature is a limiting factor such that the TR must be short enough to adequately sample the signal drop of the first passage of the CA bolus. As a result, most authorities agree that a TR between 1000 and 2000 milliseconds offers the best compromise between these competing parameters.34,35
optimal T2*tissue contrast has been reported for TEs to be between 40 and 60 milliseconds, while the optimal TE for the CA is reportedly lower, simultaneously providing an increase in the SNR.29 The tissue TE for T2* DSC imaging at 3T is lower, and a TE equal to 21 milliseconds has been reported to be optimal.30,31 Regarding TR, early published simulation experiments suggest that the TR should be less than 1.5 seconds to minimize error (<25%) in CBF calculation.32 Nevertheless, more recent frequency domain evaluations have shown that a shorter TR may improve SNR and the accuracy of CBF estimation, but the improvement in CBF accuracy for TR values less than 2 seconds has been found to be negligible.33 An important consideration is that as the TR is further decreased, there is concomitant increase in the influence of T1 relaxation within the vascular compartment potentially affecting arterial input function. In addition, the mean transit time of the cerebral vasculature is a limiting factor such that the TR must be short enough to adequately sample the signal drop of the first passage of the CA bolus. As a result, most authorities agree that a TR between 1000 and 2000 milliseconds offers the best compromise between these competing parameters.34,35
A reasonable alternative to the use of preload contrast administration is the use of a dual-echo acquisition method, when available, which has the added benefit of producing results that are relatively independent of the applied postprocessing technique. This option allows calculation of changes in R2* (ΔR2*), requires only a single total dose of gadolinium, and removes all confounding T1 effects, although T2 and T2* effects may still confound the results if not removed upon postprocessing. The use of lower flip angles to reduce T1 sensitivity should be avoided, because small flip angles traditionally result in poor image contrast that compromises derivation of robust parametric rCBV maps and increases the dependence on the specific postprocessing technique used.20 A lower flip angle renders the sequence less dependent on T1 but is also farther away from the optimal flip angle (i.e., getting the most signal out at a given TR). When considering the Ernst angle, the reported optimal flip angle for GE-based DSC PWI techniques is 72 degrees at 1.5T.20 Here, the flip angle optimization should actually focus on white matter T1, because white matter has the smallest perfusion effect (i.e., smallest CBV). Thus, it is key that one gets the most optimal signal out of white matter. Finally, it should be noted that various postprocessing techniques are available for use, but only a few offer the best contrast-to-noise ratio, as depicted in Figure 57.3.20 The leakage-corrected trapezoidal integration technique (sampling 120 data points, which extends the
sampling duration beyond the first passage of GBCA) has been shown to perform well with both T1– and T2*-leakage conditions and has thus been suggested as a favored postprocessing technique, although there is potential overestimation of rCBV when the full 120-point ΔR2*(t) is integrated.20 The use of gamma-variate fitting or integration following postbolus subtraction techniques appears to potentially result in falsely decreased rCBV values because these methods essentially force the postbolus ΔR2* back to baseline (or suffers from leakage effects).20 Furthermore, the negative enhancement integral (historically a commonly used method included in many vendor-supplied postprocessing software packages) can result in nonphysiologic and erroneous estimations of CBV.20 Use of these methods is not recommended. However, newer techniques have been devised, including one that uses Tikhonov-regularized deconvolution and produces an integration cutoff point for estimation of the first bolus that can be extrapolated to zero, reportedly yielding similar results to the gamma-variate fit.36 Finally, additional techniques may be used, such as circular deconvolution (in the frequency domain) with application of Wiener-filter–style regularization, which can result in improved estimates of CBF and time-to-maximum, not affecting the scaling factors for CBV37 (discussed elsewhere in this book; see Geek Box 1).
sampling duration beyond the first passage of GBCA) has been shown to perform well with both T1– and T2*-leakage conditions and has thus been suggested as a favored postprocessing technique, although there is potential overestimation of rCBV when the full 120-point ΔR2*(t) is integrated.20 The use of gamma-variate fitting or integration following postbolus subtraction techniques appears to potentially result in falsely decreased rCBV values because these methods essentially force the postbolus ΔR2* back to baseline (or suffers from leakage effects).20 Furthermore, the negative enhancement integral (historically a commonly used method included in many vendor-supplied postprocessing software packages) can result in nonphysiologic and erroneous estimations of CBV.20 Use of these methods is not recommended. However, newer techniques have been devised, including one that uses Tikhonov-regularized deconvolution and produces an integration cutoff point for estimation of the first bolus that can be extrapolated to zero, reportedly yielding similar results to the gamma-variate fit.36 Finally, additional techniques may be used, such as circular deconvolution (in the frequency domain) with application of Wiener-filter–style regularization, which can result in improved estimates of CBF and time-to-maximum, not affecting the scaling factors for CBV37 (discussed elsewhere in this book; see Geek Box 1).
 FIGURE 57.3. Parametric maps for relative cerebral blood flow volume (rCBV), derived from dynamic susceptibility contrast perfusion-weighted imaging, demonstrate utility of contrast agent preload. One section of rCBV maps generated for 21-year-old patient diagnosed with malignant glioneuronal tumor. Top (A–F) and bottom (G–L) rCBV maps were created from data collected with acquisition methods A and D, respectively. Although gradient-echo, echo-planar imaging sequence with 90-degree flip angle was used for both methods, method A was collected during primary injection of standard dose of contrast agent, and method D was collected during secondary injection of double dose of contrast agent after administration of preload. Methods of analysis were as follows: UTI (A, G), CTI (B, H), gamma-variate fitting (C, I), PBSI (D, J), MSD (E, K), and NEI (F, L). Note that when preload of contrast agent was not used (top), variability in tumor rCBV was dependent on choice of method of analysis, with negative or zero tumor rCBV results in some cases. Collecting data after preload (bottom) decreases dependence of tumor rCBV on chosen method of analysis. UTI, uncorrected trapezoidal integration; CTI, corrected trapezoidal integration; PBSI, postbolus baseline subtraction; MSD, maximum signal decrease; NEI, negative enhancement integration. (Reprinted with permission from Paulson ES, Schmainda KM. Comparison of dynamic susceptibility-weighted contrast-enhanced MR methods: recommendations for measuring relative cerebral blood volume in brain tumors. Radiology. 2008;249:601–613) |
Geek Box 1: Gradient Echo–Based Dynamic Susceptibility Contrast Optimization Techniques
Avoid use of lower flip angles (optimal reported flip angle: 72° at 1.5T.20
TR: between 1500 and 2000 milliseconds is considered optimal.
Use a dual-echo or preferably multiecho acquisition when possible.
Preload gadolinium bolus to diminish leakage effects and erroneous CBV calculations. (Preloading may negatively affect the dynamic endothelial leakage interrogation when pharmaco-kinetic analysis or DCE PWI is planned.)
Suggested order: perform DCE first, utilizing the DCE contrast volume as preload for the DSC portion of the experiment.
Alternatively, may use a combined method that performs DCE and DSC simultaneously (however, not currently widely available).
Many postprocessing techniques may diminish T1 and T2* leakage effects
The leakage-corrected trapezoidal integration technique has been suggested to be most optimal (although not subsequently confirmed).20
DCE-based PWI, as mentioned previously, can model and best characterize capillary endothelial permeability (and leakage). Although the technique is described in greater detail elsewhere in this book, it is generally acquired in three main steps: (a) standard morphologic MRIs are obtained to localize the tumor; (b) images are obtained for calculation of baseline T1 values; (c) dynamic T1-weighted perfusion MR data are acquired every few seconds for 5 to 10 minutes. The applicability of DCE as a quantitative imaging biomarker for intracranial tumors resides in an increasing interest in documenting the reportedly rapid reductions in tumor vessel permeability identified upon administration of drugs that target VEGF. Institutional protocols vary depending on the balance between desired spatial resolution, the volume of desired anatomical coverage, and temporal resolution, but a preliminary recommended step includes the baseline mapping of T1 and equilibrium magnetization to account for the nonlinear relationship between signal intensity and GBCA concentration. This allows for transformation of the signal-intensity time curve into a time-concentration curve.
The optimal method for acquiring baseline T1 mapping has been debated, but it is critical to perform prior to contrast administration. The variable nutation (multiple flip) angle technique has been cited as the most popular (and clinically useful) technique because T1 mapping can be obtained with reasonable accuracy in a relatively short acquisition time.38 This is based on acquiring two or more scans with identical imaging parameters (TE, TR, etc.) that vary only in the flip angle used. This is usually performed with a small flip angle (such as 8 degrees) and repeated again with a flip angle of approximately 35 degrees. Additional intermediate flip angles can be obtained depending on vendor and protocol (see Table 57.1 for a sample DCE protocol). For the most accurate quantitative T1 mapping, preference is usually given to a SE inversion recovery sequence (reportedly the current gold standard), which can be further optimized by fitting the complex data with a reduced-dimension nonlinear least squares method,39 rather than the traditional Levenberg-Marquardt algorithm, but is still relatively time-consuming and thus not preferred clinically.
DCE is most commonly acquired using a GE sequence, but standard GE sequences have high T2 sensitivity that is undesirable when mapping the associated increase in T1 signal during the passage of the contrast bolus. Thus, DCE-PWI is currently acquired with dynamic T1W spoiled SSFP GE-based PWI techniques, which are more
sensitive to T1 effects and are optimally performed with a three-dimensional readout.40 Increased sampling rate is desired to better characterize the contrast bolus (improved accuracy of the sample), which is achieved with more rapid imaging techniques. The implementation of parallel imaging, for example, has helped. For more details, the interested reader is referred to Chapters 5 and 23. Finally, the quantitative analysis and pharmacokinetic modeling are of critical importance and are discussed in detail in Chapter 29.
sensitive to T1 effects and are optimally performed with a three-dimensional readout.40 Increased sampling rate is desired to better characterize the contrast bolus (improved accuracy of the sample), which is achieved with more rapid imaging techniques. The implementation of parallel imaging, for example, has helped. For more details, the interested reader is referred to Chapters 5 and 23. Finally, the quantitative analysis and pharmacokinetic modeling are of critical importance and are discussed in detail in Chapter 29.
ASL, on the other hand, is an alternative perfusion imaging method that does not require use of an exogenous contrast agent. It has been available as a research tool at academic centers for years but has only recently gained favor as a perfusion technique to evaluate intracranial neoplasms, based in part on improvements in sequence and coil design, product sequence availability, and the prevalence of 3T MRI scanners, the latter affording significant improvement in SNR and increase in the T1 of blood. The ASL technique relies on the noninvasive magnetic tagging of blood water, an endogenous diffusible tracer, to evaluate CBF. With this technique, blood in a feeding artery is labeled via an inversion or saturation pulse, and the magnetization is followed for some time (limited by T1 decay) as the blood travels to the brain, where it is transferred to the brain tissue via capillary exchange at a rate dependent on tissue perfusion. An image without such labeled blood is also obtained and serves as the control image. The signal difference between the “label” and “control” images represents the perfusion image comprised only of the labeled blood (for which all background signal has been eliminated; see Chapter 16).
The more technical aspects of ASL have been discussed elsewhere (see Chapter 15 through 22). ASL has several advantages, including: (a) the ability to directly measure CBF; (b) the option of utilizing a fast-spin-echo readout; (c) the relative insensitivity to disruption or damage to the BBB; (d) the option of infinite repeatability; and (e) the ability to assess microvascular perfusion. Nevertheless, the ASL technique is not without some notable pitfalls, including: (a) the (current) inability to measure CBV in a reliable way; (b) a relatively long acquisition time (5 to 10 minutes) compared with DSC-PWI (2 to 3 minutes); (c) the low SNR and perhaps erroneous measurement of CBF in white matter; (d) the inability to quantify the leakiness of the BBB; and (e) a rapidly decaying tracer that is limited by the T1 decay of blood, resulting in “loss” of the contrast agent signal over time, which renders CBF quantitation also subject to bolus arrival times (see Geek Box 2).
In addition to derivation from ASL, CBF estimation can also be performed with DSC and DCE techniques, possibly circumventing some of the previously mentioned potential shortcomings of the current ASL iterations. Nevertheless, when absolute measurements of CBF are desired (in milliliters per 100 g of tissue per minute), a scaling or calibration must be performed, since the concentration of GBCA is not typically measured in absolute units. For this reason, several unknown proportionality constants must be considered when desiring quantitative parametric maps (discussed elsewhere in this book). There have been four general techniques used for CBF quantification: (a) using assumed values for the various unknown proportionality constants41; (b) calibrating the parametric maps using generalized, known scaling factors obtained from prior published multimodality calibration studies (i.e., such as a positron emission tomography [PET]-MRI calibration study)42; (c) scaling via an internal standard, traditionally performed using an assumed, expected normal white matter CBF value of 22 mL/100 g of tissue per minute43; (d) calibrating the individualized parametric maps using a complementary measure obtained at the same imaging session, such as incorporation of ASL or PET data or implementation of the bookend method, as described previously.44,45,46 This latter option is considered the most accurate for CBF quantification.35
Geek Box 2: Suggested Pseudo-Continuous Arterial Spin Labeling Parameters (3D Readout)
Preferably without vessel suppression.
Matrix = 64 × 64 (minimum) or 3-mm voxel size (better)
Coverage: 26 × 4- to 5-mm slices (begin at foramen magnum)
TR/TE = 5500/2.5 milliseconds
Labeling period = 1500 milliseconds; Postlabel delay = 2000 milliseconds (may reduce if using 2D readout).
Reduction factor (parallel imaging): 2 to 2.5 depending on vendor
With respect to tumor imaging, several studies have suggested that CBF may be an appropriate metric in evaluation of human gliomas, despite the observation that CBF has not historically been used extensively to evaluate intracranial tumors.7,8,47 In one study, Thomsen et al.7 evaluated 61 subjects with differing glioma grades, imaged with DSC-PWI, in which statistical comparison was made between rCBV and regional CBF (rCBF) of diffuse astrocytomas, anaplastic astrocytomas, and glioblastomas. Their results suggested that neither rCBF nor rCBV quantification provided a statistically significant difference between the evaluated tumor types, and both derived perfusion metrics tended to increase with increasing tumor grade and were found to be lower in posttreatment or resection patients. They concluded that rCBF measurements (normalized to white matter or cerebellum) were comparable
with the established rCBV measurements currently used for evaluation of human gliomas.
with the established rCBV measurements currently used for evaluation of human gliomas.
A recent study by Sorensen et al.,47 evaluating 30 patients with recurrent GBM treated with a pan-VEGF inhibitor (cediranib), suggested that assessment of tumor blood perfusion measured by (quantitative imaging of perfusion using a single subtraction, second version [QUIPSS II]) ASL was well correlated with progression-free survival. In this study, the authors performed DSC, DCE, and pulsed ASL in all patients. In addition to reporting improved efficiency in tumor blood perfusion, the authors noted a concomitant decrease in endothelial leakage (measured by DCE-derived Ktrans), surrounding vasogenic edema, contrast avidity, and mass effect. Improved efficiency of tumor blood perfusion was associated with prolongation in progression-free survival and overall survival. Although these authors did not mention which technique was the most optimal quantitative imaging biomarker to monitor treatment changes in GBM patients, their results suggest that CBF assessment of intracranial tumors is an additional metric worthy of evaluation.
Interestingly, the previously mentioned study reported a relative increase in perfusion (represented by an increase in ASL-derived CBF measurements using a QUIPSS II technique48) upon appropriate treatment with a pan-VEGF inhibitor (cediranib). The authors’ own (unpublished) experience in evaluating the treatment effects of bevacizumab (a VEGF-A antagonist) with a pseudo-continuous ASL technique in 18 patients with histologically confirmed recurrent GBM has suggested a statistically significant decrease in CBF within and about the tumor bed upon successful (clinical and radiographic) treatment, as evaluated in 53 serial ASL examinations (obtained without vessel suppression, using a three-dimensional background-suppressed fast-spin-echo stack-of-spirals readout module with eight in-plane spiral interleaves). It is unclear if these directly opposing reported trends in CBF are related to differences in the acquisition technique or to the study methodology, but such discrepancies warrant further investigation. It is worth noting that other sources have similarly reported decreased intratumoral perfusion upon successful treatment with VEGF-blocking therapies.7,49
Direct comparison of qualitative T1-, T2-, and T2*– based DCE and DSC PWI techniques and quantitative, pulsed ASL (using the Q2TIPS [QUIPSS II with thin-slice TI1 periodic saturation technique) and H215O-PET was performed by another group evaluating 12 patients with de novo brain tumors, including nine with high-grade gliomas (World Health Organization [WHO] grades III and VI).8 The results of this study suggested a linear correlation among all five perfusion metrics in evaluating normal brain tissue and tumor, but the authors concluded that not all metrics were comparable, citing that relative tumor perfusion values differed between methods by up to a factor of 2.8. Also with just 12 patients, the study was most likely underpowered. It was concluded that the T2*-DSC (using a GBCA presaturation bolus from immediate prior DCE acquisition) and pulsed ASL techniques (acquired prior to DCE and DSC) depicted median tumor perfusion most reliably.
White et al.50 performed a regional and voxel-wise comparison between DSC-PWI-derived rCBF (notably performed without a “bookend” method or scaling factor) and ASL-derived CBF in 30 patients with histologically confirmed brain tumors and described a positive linear correlation between DSC and ASL measurements of CBF using regional average values. Nevertheless, the voxel-wise correlation was statistically significant in only 30% to 40% of evaluated patients, suggesting that these techniques may provide regionally similar measurements of CBF, albeit differing spatially.
Although these comparison studies may draw conclusions about which technique is optimal, there are several technique-dependent caveats that must always be considered (when comparing any studies for that matter). For example, when comparing two similar PWI studies, one should not expect comparable results when various authors employ disparate techniques, such as use of CA predosing versus leakage correction postprocessing calculation, even when comparing similar DSC techniques; these are seemingly different techniques for which the results cannot be compared. The method of leakage correction, the deconvolution approach, and the scan parameters (TR, TE, flip angle, and SE vs. GE readout) all affect the CBV and CBF computations, and thus affect the outcome of the MR experiment. Similarly, the ASL CBF calculation can depend on (a) the type of labeling technique employed, (b) the labeling efficiency, (c) the angle and placement of labeling plane relative to the labeled vessels, (d) the sequence design, (e) the label duration, (f) postlabel delay, (g) readout scheme used, (h) patient-specific factors such as label arrival time, and (i) physiologic differences in red blood cells concentration and hematocrit (with the latter known to change substantially within tumors). Even patient consumption of caffeine before an MR examination has been shown to alter CBF measurements.51 All of this variability makes direct comparison of perfusion techniques difficult, even when obtained within a single study and technique, let alone between studies or institutions. An understanding and appreciation of this disparity helps to explain, to some extent, the heterogeneity of the published results. Unfortunately, a large portion of published perfusion studies were not conducted with the current knowledge and advanced level of perfusion imaging that is possible today. Thus, some healthy skepticism should be maintained when interpreting prior publications.
Given these many caveats, it may ultimately be desirable to combine the permeability, blood volume, and vascular morphology data obtained with multimodal, optimized perfusion techniques to arrive at a more complete
picture of tumor behavior, such as might be attainable by combined imaging with DSC, DCE, and ASL, as suggested in Figure 57.1 and several published studies.8,47,52 Sample DSC- and DCE-based protocols are provided in Table 57.2.
picture of tumor behavior, such as might be attainable by combined imaging with DSC, DCE, and ASL, as suggested in Figure 57.1 and several published studies.8,47,52 Sample DSC- and DCE-based protocols are provided in Table 57.2.
TABLE 57.2 PERFUSION IMAGING PROTOCOL | ||
|---|---|---|
|
Gadolinium-Based Perfusion Experiments: Preimaging Practical Considerations
There are several technical considerations that should be addressed prior to image acquisition that can significantly affect the results of the perfusion experiment. Although ASL does not require administration of an exogenous contrast agent, DCE- and DSC-based PWI techniques do, thus necessitating the acknowledgment of several topics, including: (a) the potential for patient allergy to contrast material; (b) evaluation of renal function and renal status (for cases in which the patient could be at risk for developing subsequent nephrogenic systemic fibrosis from administration of a gadolinium-based contrast agent); and (c) requisite placement of a temporary, peripheral intravenous (IV) catheter, which may be challenging in patients with peripheral artery disease, diabetes, atherosclerosis, small veins (or those undergoing chemotherapy), and patients with additional comorbidities. The IV access is preferentially placed in a right upper extremity vein (optimally in the antecubital fossa) due to the physiologic angulation of the brachiocephalic vein, which allows for a desirable decrease in unwanted contrast bolus dispersion upon power injection.
Because optimal IV flow rates for a perfusion experiment are 4 to 5 cc/s (as discussed below), an IV catheter no smaller than 20 gauge is necessary (i.e., 14, 16, 18, or 20 gauge are functional, although the former two may cause significant and unnecessary discomfort and do not appear to provide added value). It is important to check that the IV access is completely functional, able to return (freely flowing) blood upon negative pressure administration, and can be easily flushed without evidence of extravasation. The patient should report a “cool” sensation within the right upper extremity (or extremity containing the IV access), upon moderate administration of approximately 5 cc of sterile saline flush within the IV tubing. This is done to confirm that the IV site is properly functioning, demonstrates no evidence of possible extravasation at the IV site, and does not cause patient discomfort (thus potentially minimizing patient motion during the actual perfusion experiment).
Next, it is important to have a functional, automatically triggered power injector capable of delivering contrast and a subsequent saline “chaser” at a rate of 4 to 5 cc/s. Under optimal circumstances, the power injector can be triggered from the MR scanner console. The power injector should be appropriately positioned in the MR scanner suites to allow easy access in an emergency, and it should be readily viewable from the scanner console (to allow for direct visualization upon contrast administration). The amount and choice of GBCA is discussed below. Once the choice of GBCA is made, the power injector should be loaded with the desired volume of contrast to perform the experiment (and preferably with some additional residual). For injectors with a separate saline chamber, the appropriate volume of saline should be added, and all chambers should be checked for removal of unwanted air in the system. An appropriate length of IV connector tubing is then securely attached to the power injector and the contrast is advanced to clear the connector tubing and system of unwanted air. Finally, the free end of the connector tubing is secured to the patient’s IV tubing, and the entire system is again checked to ensure that all attachment sites are appropriately connected and the system is free of unwanted air.
During the perfusion experiment, imaging is begun and a baseline (prior to contrast administration) is obtained (usually on the order of 15 to 20 seconds, depending on the desired spatial resolution, as discussed below). The gadolinium is then administered via the power injector (usually for a total of 15 to 20 mL of GBCA, as discussed below), and immediately followed by a saline flush to decrease gadolinium bolus dispersion in the circulatory system. The minimum recommended volume of saline flush is 25 cc (or slightly higher). This volume of saline “chaser” acts to clear the bolus of gadolinium from the IV tubing and also acts to “push” the gadolinium into the heart, where it undergoes (unavoidable) physiologic dispersion in the pulmonary system prior to returning to the heart and is then sent to the cerebrovascular system. Finally, care must be taken to include a large intracranial artery (such as the M1 middle cerebral artery segment) in the prescribed perfusion examination field of view, from which the arterial input function will be derived. These checkpoints should be reviewed prior to the commencement of any perfusion experiment and will minimize the technique-related factors that may hamper a perfusion experiment prior to image acquisition (Table 57.3).
Gadolinium-Based Contrast Agents
Multiple GBCA are available, including linear and macrocyclic formulations, which may be first or second in generation. A comprehensive list is beyond the scope of this chapter and is discussed extensively in Chapters 7 and 8. Nevertheless, the occurrence of, and concern for, possible development of associated NSF has raised several safety issues regarding the use of these agents, as discussed in other chapters. With regard to tumor imaging, all agents are available in 0.5 mol/L formulations, with the exception of gadobutrol (Gadovist/Gadavist), a second-generation agent available in a 1.0 mol/L formulation. Recommendations for contrast medium choice from a recent international meeting of experts advocate the use of a macrocyclic agent, such as gadobutrol, gadoterate meglumine (Dotarem), and gadoteridol (ProHance), which have higher chelate stability than their linear counterparts.53
TABLE 57.3 PREIMAGING GADOLINIUM-BASED CONTRAST AGENT PERFUSION CHECKLIST | ||
|---|---|---|
|
Use of a contrast medium with high T1 relaxivity is generally preferred to provide high T1-shortening effects and improve conspicuity of the enhancing tumor components.54 It is suggested that a single dose (0.1 mmol/kg body weight) of GBCA be used in evaluating suspected primary neoplasms when using a GE-based EPI PWI technique.53 A second, additional dose can be added (for a total of 0.2 mmol/kg body weight) to increase the conspicuity of enhancing lesion components for cases of diagnostic uncertainty.53 Use of a triple dose of GBCA is not advised since this is likely to exacerbate residual T2* effects, as discussed previously, and falsely elevate the postbolus baseline.20
Although there may be geographic and institutional preferences for choosing a given GBCA, the current consensus is that any GBCA agent can be used safely in patients with a glomerular filtration rate (GFR) greater than 60 mL/min/1.73 m2,55 such that the choice may be made entirely by optimizing T1-shortening effects versus (mostly) cost and availability. In patients with lower GFR (30 and 60 mL/min/1.73 m2), a macrocyclic agent is advised and may be given as a single or half-dose, as deemed prudent per institutional guidelines. It should be noted that higher doses of contrast will increase enhancing lesion conspicuity, and the optimum-desired gadolinium agent concentration should be weighed against associated degree of renal impairment and concerns for developing NSF. Some authorities suggest that patients with GFR below 30 mL/min/1.73 m2 may safely receive up to a single dose of a preferably macrocyclic agent.53
TABLE 57.4 AMERICAN COLLEGE OF RADIOLOGY RECOMMENDATIONS FOR GADOLINIUM-BASED CONTRAST AGENT USE IN CONTRAST-ENHANCED MAGNETIC RESONANCE IMAGING FOR PATIENTS WITH ESTIMATED GLOMERULAR FILTRATION RATES LOWER THAN 60 ML/MIN/1.73 M2 OR RECEIVING CHRONIC DIALYSIS TREATMENT
Related posts:Stay updated, free articles. Join our Telegram channel
Full access? Get Clinical Tree
 Get Clinical Tree app for offline access

|
|---|