PANTOTHENATE KINASE DEFICIENCY (HALLERVORDEN-SPATZ SYNDROME)
KEY FACTS
 Rare autosomal recessive disorder (abnormal gene: 20pl3); deficiency of pantothenate kinase leading to accumulation of cysteine, free radicals, and iron deposition.
 Familial occurrence is found in 50% of patients.
 Clinically evident during first 2 decades of life and characterized by progressive dystonia, oromandibular abnormalities, mental deterioration, pyramidal signs, and retinal degeneration.
 Types: classic or early onset (rapidly progressive) and atypical or late (slowly progressive); latter type is rare.
 MRI (T2/FLAIR) shows typical “eye-of-the-tiger” abnormality involving the pallidum, which reflects increased iron deposition, demyelination, and reactive gliosis. All patients with classic type show MR abnormalities.
 MRS: low NAA and high myoinositol.
 Main differential diagnosis: anoxia, CO intoxication, sequelae of kernicterus.
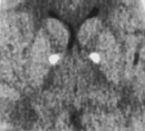
FIGURE 18-1. Axial CT shows calcification in medial globi pallidi.
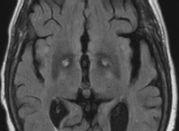
FIGURE 18-2. Axial FLAIR, in a different patient, shows high signal (gliosis) surrounded by low signal (iron deposition) in globi pallidi (“eye-of the tiger” sign).
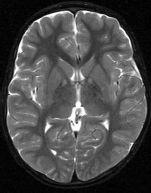
FIGURE 18-3. Axial T2, in a different patient, shows little iron deposition but high signal in the globi pallidi.
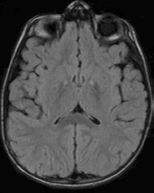
FIGURE 18-4. Axial FLAIR, in the same patient as 18-3, shows high signal in the internal pallid and subtle eye-of-the-tiger sign.
SUGGESTED READING
Nuri Sener R. Pantothenate Kinase-Associated Neurodegeneration: MR imaging, proton MR spectroscopy, and diffusion MR imaging findings. AJNR Am J Neuroradiol 2003;24:f 690–1693.
Hayflick SJ, Hartman M, Coryell J, Gitschier J, Rowley H. Brain MRI in Neurodegeneration with Brain Iron Accumulation with and without PANK2 Mutations. AJNR Am J Neuroradiol 2006;27:1230–1233.

KEY FACTS
 Most common cause of medically intractable complex partial seizures, seen in 60% to 80% of patients with complex partial seizures. Most common predisposing factor: febrile seizures in infancy.
 Hippocampal sclerosis is pathologically characterized by neuronal cell loss (30% to 50%) in cornu ammonis (CA) fields 1,3, and 4 of hippocampal gyrus.
 Loss of volume is more common (>80%) than high signal intensity on T2WI/FLAIR, which is seen in 10% to 70% of cases.
 Ancillary findings: atrophy of ipsilateral column of fornix and mammillary body, loss of undulations of pes hippocampus, ipsilateral temporal lobe volume loss and blurring of gray-white matter junction, and dilatation of temporal horn of lateral ventricle.
 Bilateral in 10% to 15% of patients.
 MRS: low NAA and mildly elevated myoinositol. Occasionally choline may be also minimally elevated. Acutely, lactate may be seen.
 70% to 90% of patients will experience resolution/improvement of seizures after temporal lobe resection.
 Main differential diagnosis (during or immediately after seizures when hippocampus may be swollen, needs imaging 2 to 3 later to document resolution): tumor (astrocytoma), limbic encephalitis.
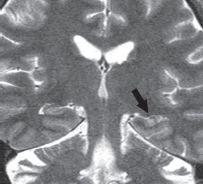
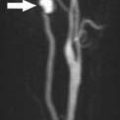
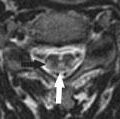
FIGURE 18-5. Coronal T2 shows a small and bright left hippocampus (arrow).
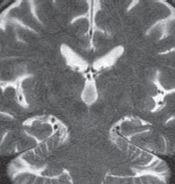
FIGURE 18-6. Coronal T2 shows bilaterally small hippocampi. Only the left one shows increased signal intensity.
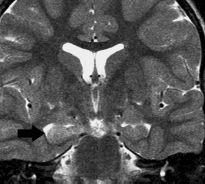
FIGURE 18-7. Coronal T2, in a different patient with recent seizures, shows the bright and swollen right hippocampus (arrow).
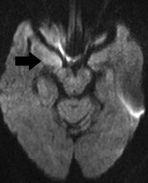
FIGURE 18-8. Axial DWI, in the same patient, shows high signal from the right hippocampus (arrow).
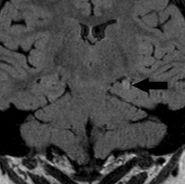
FIGURE 18-9. Coronal FLAIR, in a different patient, shows a very small and bright left hippocampus (arrow).
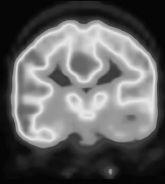
FIGURE 18-10. Coronal PET, in the same patient, shows hypometabolism in the left temporal lobe. (See color insert)
SUGGESTED READING
Bronen RA, Fulbright RK, Kim JH, Spencer SS, Spencer DD. A systematic approach for interpreting MR imaging of the seizure patient. Am J Roentgenol 1997;169:241–247.

KEY FACTS
 Rare, autosomal dominant (complete penetrance) disorder occurring during the fourth to fifth decades of life.
 Symptoms: choreoathetosis (due to loss of GABAergic neurons), rigidity, dementia, and emotional lability.
 MRI: atrophy of caudate nuclei (particularly their heads) and putamina; diffuse brain atrophy is also present. Occasionally, the basal ganglia show high T2/FLAIR signal.
 Increased iron deposition in basal ganglia may also be seen as low signal on T2/FLAIR.
 MRS: low NAA and moderately high choline (due to gliosis) and rarely, lactate.
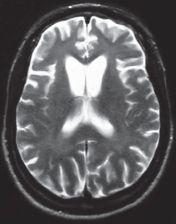
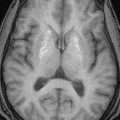
FIGURE 18-11. Axial T2 shows atrophy of caudate nuclei head and prominent sulci in both frontal lobes.
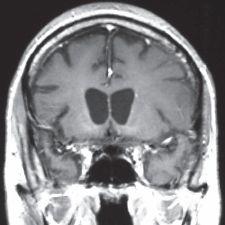
FIGURE 18-12. Coronal T1 shows straightening of lateral walls of the frontal horns due to atrophy of the caudate nuclei heads.
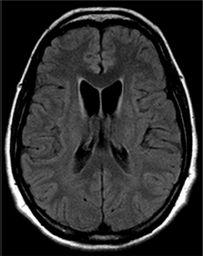
FIGURE 18-13. Axial FLAIR image, in a different patient, showing significant atrophy of the caudate nuclei heads that are also of high signal (Case courtesy of A. Vidal, Chile).
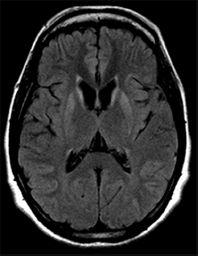
FIGURE 18-14. Axial FLAIR, in the same patient as 18-13, shows high signal in both putamina and residual caudate nuclei heads.
SUGGESTED READING
Mascalchi M, Lolli F, Nave RD, Tessa C, Petralli R, Gavazzi C, et al. Huntington disease: volumetric, diffusion-weighted, and magnetization transfer MR imaging of bain. Radiology 2004;232:867–873.
Ho VB, Chuang HS, Rovira MJ, Koo B. Juvenile Huntington disease: CT and MR features. AJNR Am J Neuroradiol 1995;16:1405–1412.

KEY FACTS
 Most common degenerative motor neuron disease (although very rare) occurring in patients older than 50 years of age.
 Symptoms: atrophy, weakness of the hands and arms, spasticity of the legs, and diffuse hyperreflexia.
 Most patients die within 6 years of the onset of the disease.
 Histologically, there is degeneration of neurons in the central gray matter and in the ventral gray matter horns of the spinal cord; this leads to wallerian degeneration of the corticospinal tracts and of the cauda equina.
 Imaging shows atrophy of the frontal lobes, including widening of the central sulcus, increased deposition of iron (low T2 signal intensity; this may be normal with aging, better seen using SWI) in the motor strip, and increased signal intensity in the posterior limbs of the internal capsules (more obvious on FLAIR).
 MRS: high choline in precentral gyrus, low NAA and high glutamate.
 Despite abnormal anterior horns in the spinal cord, spine MRI studies are high generally normal.
 Early on, it may be unilateral.
 Main differential diagnosis: wallerian degeneration.
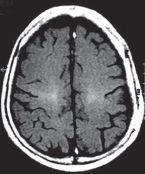
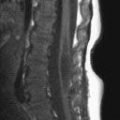
FIGURE 18-15. Axial FLAIR shows symmetrical high signal in both corticospinal tracts.
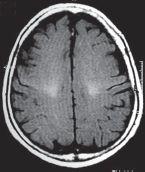
FIGURE 18-16. Axial FLAIR in the same patient shows inferior continuation of abnormal high signal along corticospinal tracts.
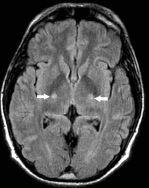
FIGURE 18-17. Axial FLAIR, in a different patient, shows high signal in the corticospinal tracts (arrows).
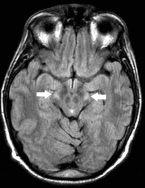
FIGURE 18-18. Axial FLAIR, in the same patient as 18-17, shows high signal in the corticospina tracts (arrows).
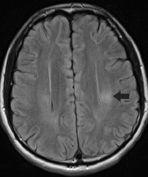
FIGURE 18-19. Axial FLAIR image, in a different patient, shows high signal (arrow) in the left corticospinal tract.
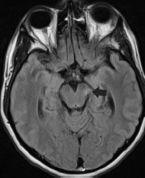
FIGURE 18-20. Axial FLAIR image, in the same patient as 18-19, shows high signal (arrow) unilaterally in the midbrain.
SUGGESTED READING
Agosta F, Chiò A Cosottini M, De Stefano N, Falini A, Mascalchi M, et al. The present and the future of neuroimaging in amyotrophic lateral sclerosis. AJNR Am J Neuroradiol 2010;31:1769–1777.

KEY FACTS
 Most common degenerative brain disorder and most common cause of dementia ( fourth cause of death in the United States), found more often in individuals > 50 years of age.
 Symptoms: forgetfulness, language difficulties, conceptual loss, orientation abnormalities, and apraxia.
 Characterized by presence of neurofibrillary tangles and amyloid that result in death of neurons leading to dementia. Deposits of cortical amyloid label with the “Pittsburgh compound B” up to 10 years before symptoms develop.
 MRI: diffuse atrophy, marked atrophy of the hippocampi, areas of increased T2/FLAIR signal intensity in the white matter (more than expected for age), increased T2/FLAIR signal intensity in the cortex of the temporal lobes, dilated perivascular spaces, and increased deposition of iron in parietal regions and basal ganglia.
 MRS: elevated levels of myoinositol and low NAA throughout the brain.
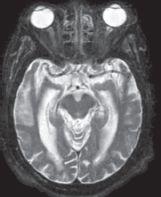
FIGURE 18-21. Axial T2 shows significant hippocampal atrophy.
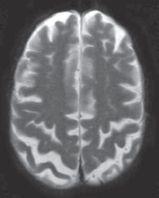
FIGURE 18-22. Axial T2, in the same patient, shows significant dilatation of precentral and parietal sulci.
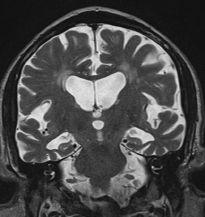
FIGURE 18-23. Coronal T2, in a different patient, shows severe atrophy of the temporal lobes, particularly the hippocampi.
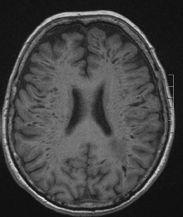
FIGURE 18-24. Axial T1, in a different patient, shows marked and extensive dilated perivascular spaces in both hemispheres.
Related posts:
Stay updated, free articles. Join our Telegram channel

Full access? Get Clinical Tree


