KEY FACTS
 Vertebral métastases occur in 5% to 10% of all cancer patients, especially those with primary tumors in the breast, prostate, uterus, and lung; myeloma; and lymphoma.
 Most vertebral métastases have a combined osseous/epidural/intradural location.
 Most vertebral métastases occur in the thoracic spine. Vertebral métastases are multiple in 90% of patients.
 Most common symptoms from métastases include pain, weakness, autonomie dysfunction, and sensory loss.
 Most vertebral body metastases may be screened with noncontrast sagittal T1; evaluation of epidural/intradural extension needs contrast administration; following contrast administration, many vertebral métastases become isointense to normal marrow and difficult to visualize (fat suppression may be needed in this situation). Tumor is bright on diffusion-weighted imaging (DWI) (showing low apparent diffusion coefficient [ADC]) due to hypercellularity.
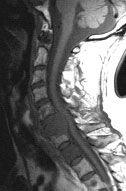
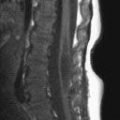
FIGURE 22-1. Midsagittal T1 shows low signal in C6 and T1 from metastases. There is posterior extension of tumor at C6, resulting in cord compression.
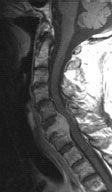
FIGURE 22-2. Corresponding postcontrast T1 shows tumor to enhance. Note that tumor at T1 became isointense to normal bone marrow in this non-fat-suppressed image. Epidural extension at C6 is clearly seen.
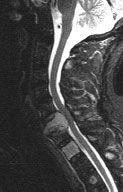
FIGURE 22-3. Corresponding T2 in the same patient as 22-1 and 22-2 fat-suppressed image shows tumor deposits to be bright.
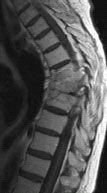
FIGURE 22-4. Midsagittal postcontrast T1 shows tumor in two midthoracic vertebrae with unusua disc involvement. Note acute kyphosis and that tumor is nearly isointense to normal enhancing bone marrow.
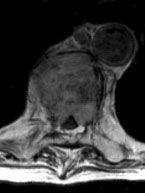
FIGURE 22-5. Axial post contrast T1, in the same patient shown in 22-4, shows tumor in the epidural space and “curtain” sign.
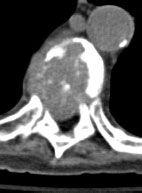
FIGURE 22-6. Axial CT (different level), in the same patient, shows mostly lytic nature of these metastases from a thyroid carcinoma.
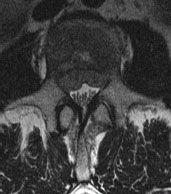
FIGURE 22-7. Axial noncontrast T1, in a different patient, shows prominent “curtain” sign due to tumor in the anterior epidural space.
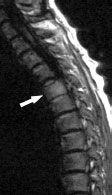
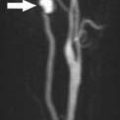
FIGURE 22-8. Midsagittal DWI, in a different patient, shows subtle high signal (arrow) from vertebral body with metastasis.
SUGGESTED READING
Cuenod CA, Laredo JD, Chevret S, et al. Acute vertebral collapse due to osteoporosis or malignancy: appearance on unenhanced and gadolinium-enhanced MR images. Radiology 1996;199:541–549.
 SPINAL CORD AND LEPTOMENINGEAL METASTASES
KEY FACTS
 These types of metastases occur in <l% of cancer patients, especially those with primary tumors in the lung (>50%) and breast or those with lymphoma, melanoma, colorectal carcinoma, head and neck carcinoma, and leukemia.
 The thoracic region is most commonly involved by both types of metastases.
 Although secondary to hematogenous dissemination, spinal cord metastases from primary CNS tumors (mainly medulloblastoma) spread via cerebrospinal fluid (CSF) pathways.
 Tumors of the CNS that most commonly spread via CSF include medulloblastoma, ependymoma, and glioma.
 Faint enhancement along the ventral surface of the conus medullaris may be normal vascular enhancement and should not be confused with metastases; enhancement may also occur 4 to 6 weeks after spinal or posterior fossa surgery.
 The most common sites of leptomeningeal metastases in the spine are the lumbar, thoracic, and cervical regions.
 Main differential diagnosis: for spinal cord lesions— primary tumors, demyelinating disease; for leptomeningeal lesions— tuberculosis, chemical meningitis, post-subarachnoid hemorrhage changes, hypertrophie polyneuropathies, Guillain-Barre.
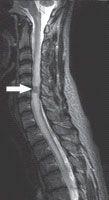
FIGURE 22-9. Midsagittal T2 shows an extensive spinal cord bright edema due to a focal metastasis (arrow) that is dark.
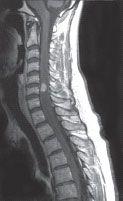
FIGURE 22-10. Corresponding postcontrast T1 shows bright enhancement in the tumor.
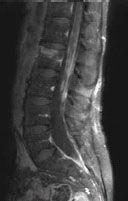
FIGURE 22-11. Midsagittal postcontrast fat-suppressed T1, in a different patient, shows enhancement in the distal spinal cord, conus medullaris, cauda equina, and walls of distal thecal sac compatible with leptomeningeal carcino-matosis.
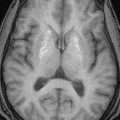
FIGURE 22-12. Axial postcontrast T1, in a different patient, shows thick enhancing nerve roots.
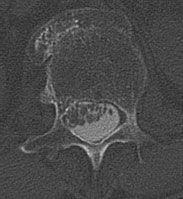
FIGURE 22-13. Axial CT post myelogram, in a different patient, shows thick matted nerve roots.
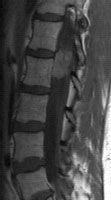
FIGURE 22-14. Midsagittal postcontrast T1, in a different patient, shows ill-defined single, large, and intradural metastasis at L1–L2 level.
SUGGESTED READING
Koeller KK, Rosenblum RS, Morrison AL. Neoplasms of the spinal cord and filum terminale: radiologie-pathologie correlation. RadioGraphics 2000;20:1721–1749.

KEY FACTS
 Of spinal cord astrocytomas, >75% (in both children and adults) are low-grade histologically, and they are found more commonly in males.
 They are the second most common primary spinal cord tumor after ependymoma.
 Most spinal cord astrocytomas involve the cervicothoracic region.
 Most spinal cord astrocytomas are discovered during third to fourth decades of life.
 Early symptoms are nonspecific or nonlocalizing and include pain and scoliosis.
 Spinal cord astrocytomas are slow growing and result in bone changes in 50% of cases.
 Associated cysts are common (40%), and holocord involvement is not rare especially in children.
 About 90% of spinal cord astrocytomas enhance on postcontrast magnetic resonance imaging (MRI).
 Main differential diagnosis: ganglioglioma, ependymoma, lymphoma, transverse myelitis.
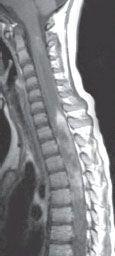
FIGURE 22-15. Midsagittal postcontrast T1 shows expansion of cervicothoracic spinal cord with patchy zones of enhancement.
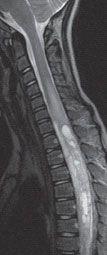
FIGURE 22-16. Corresponding T2 shows high signal and cystlike areas in the expanded cord.
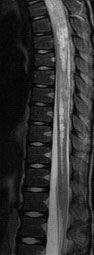
FIGURE 22-17. Misagittal T2, in the same patient, shows that the tumor continuous interiorly to involve the conus medullaris.
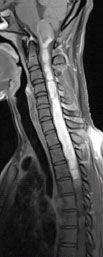
FIGURE 22-18. Midsagittal fat-suppressed post-contrast T1, in a different patient, shows extensively enhancing cord tumor.
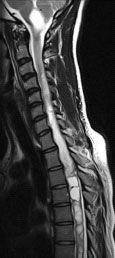
FIGURE 22-19. Corresponding T2 shows that the tumor contains multiple cysts interiorly and has a large component in the medulla.
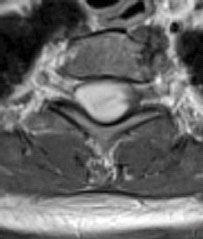
FIGURE 22-20. Axial postcontrast T1, in the same patient, shows enhancing tumor involving the entire transverse cord diameter.
SUGGESTED READING
Pollack IF. Intramedullary spinal cord astrocytomas in children. Pediatr Blood Cancer 2004;43:617–618.
Seo H-S, Kim J-H, Lee DH, Lee YH, Suh S-I, Kim SY, et al. Nonenhancing intramedullary astrocytomas and other MRimaging features: a retrospective study and systematic review. Am J Neuroradiol 2010;31:498–503.

KEY FACTS
 The most common (65%) primary tumor of the spinal cord; increased incidence in patients with NF-2.
 Spinal ependymomas occur predominantly in the lower spinal cord, conus meduHaris, and filum terminale (at this location it is typically of the myxopapillary subtype).
 They are predominantly found during fifth to sixth decades of life with a slight female predominance.
 They present with only back pain, but occasionally, patients have leg weakness and sphincter dysfunction. Occasionally, they present with superficial siderosis and even acute hemorrhage.
 Spinal ependymomas are slow-growing lesions that may produce bone scalloping; widening of the spinal canal is seen in 30% of cases.
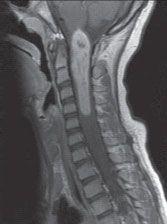
FIGURE 22-21. Midsagittal postcontrast T1 shows enhancing mass in the upper cervical cord and medulla. The spinal canal is slightly expanded.
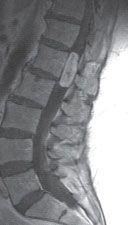
FIGURE 22-22. Midsagittal postcontrast T1, in a different patient, shows typical location and shape of an ependymoma of the myxopapillary type.
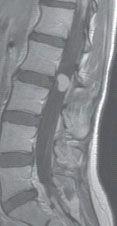
FIGURE 22-23. Midsagittal postcontrast T1, in a different patient, shows small tumor in the region of distal conus.
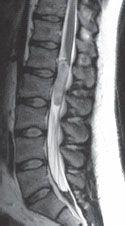
FIGURE 22-24. Midsagittal T2, in a different patient, shows mostly bright ependymoma.
 About 64% of spinal cord ependymomas have evidence of prior hemorrhage by MRI; most show well-defined margins (although occasionally they invade the conus medullaris), T2 signal is variable and may be bright or dark if calcifications and/or hemorrhage are present, and all enhance contrast administration.
 Intratumoral cysts are more common than with astrocytomas.
 Main differential diagnosis: intramedullary lesions— astrocytoma, ganglioglioma, lymphoma, metastasis, hemangioblastoma, transverse myelitis; conal/filum lesions— nerve sheath tumors, meningioma, astrocytoma, paraganglioma.
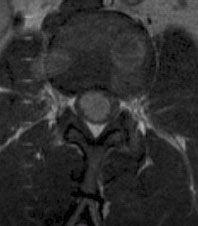
FIGURE 22-25. Axial postcontrast T1, in the same patient, shows that tumor enhances.
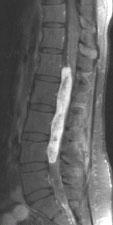
FIGURE 22-26. Midsagittal fat-suppressed post-contrast T1, in a different patient, shows large enhancing ependymoma and prominent veins on the spinal cord superiorly. The distal thecal sac has abnormal signal intensity due to drop metastases.
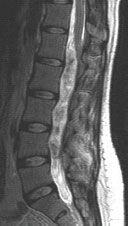
FIGURE 22-27. Corresponding T2 shows the large tumor to be mostly bright. CSF in the distal sac is also bright due to high protein content.
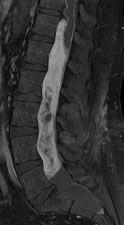
FIGURE 22-28. Midsagittal fat-suppressed post-contrast T1 shows a very large tumor expanding the bony canal. (Case courtesy C. Harr, Spokane, WA.).
SUGGESTED READING
Kahan H, Sklar EM, Post MJD, Bruce JH. MR characteristics of histopathologic subtypes of spinal ependymomas. Am J Neuroradiol 1996;17:143–150.
Related posts:
Stay updated, free articles. Join our Telegram channel

Full access? Get Clinical Tree


