3 Degenerative Diseases
Primary Osteoarthritis
Degeneration of the Knee Joint (Gonarthrosis)
Definition
Primary osteoarthritis occurs in an otherwise intact joint, involving genetically related, age-related, or use-related degeneration with microscopic and macroscopic anatomical changes, which ultimately limit motion in one or more joints. Changes to the joint include increasing cartilage loss and osseous transformation such as sclerosis, osteophyte formation, and cysts as well as potential inflammatory changes in surrounding soft tissue structures.
Pathology
 macroscopic:
– diminution of joint space
– osteophytes
– (ganglionic) cysts
– subchondral sclerosis
– cortical irregularity
– ulcerated cartilage
– joint effusion
– incongruent articular surfaces
– asymmetrical cartilage destruction and softening, especially in main weight-bearing zones
 microscopic:
– cartilage fibrillation
– disruption in vertically oriented collagen fibers
– separation of superficial and deep cartilage layers
– ulcerated cartilage in the joint
– chondrocyte growth
– hyperostotic bone formation
– necrotic bone/geodes
– fibrocartilage replacing hyaline cartilage
– subchondral sclerosis/fibrosis
– hypertrophy or atrophy of synovial villi
– reactive inflammatory changes involving muscle and tendons
 arthroscopic (based on Shahriaree):
– grade I: cartilage softening, disruption in vertically oriented collagen fibers
– grade II: cartilage swelling, dividing of superficial and deep layers of cartilage
– grade III: ulceration and fragmentation of superficial cartilage layers
– grade IV: ulcerations with exposed bone
Clinical Signs
 tension
 joint stiffness
 pain when resting the joint
 stiffness after sitting or lying down, weight-bearing pain
 limited function
 muscular atrophy, contracture
 ligament lesions, including rupture
 audible noise when moving the joint, crepitation
 joint swelling, effusion
 joint malalignment, mutilation
Diagnostic Evaluation (Figs. 3.1, 3.2)
 (→ method of choice)
Recommended Radiography Projections
 standard projections:
– anteroposterior (AP) projection
– lateral projection, mediolateral roentgen ray path
 special projections (depending on clinical findings):
– Tunnel view/Notch view to demonstrate intercondylar fossa and eminence
– axial projection of the patella
– “defilée” views (axial projection with knee bent 30°, 60°, 90°) of the patella to demonstrate the patellofemoral joint
– 45° oblique views for better evaluation of the tibial plateau and proximal fibula
 conventional tomography:
– replaced by multislice computed tomography (CT) and two-dimensional/three-dimensional (2-D/3-D) reconstructions
Findings
 diminution of joint space
 osteophytes
 geodes
 subchondral sclerosis
 cortical irregularity
 effusion
 incongruence of articular surfaces
 old traumatic lesions (bone defects, joint surface irregularity, consolidated fractures)
 intra-articular loose bodies
 capsule, ligament, tendon, and muscle calcifications
 (→ complementary method)
Recommended Imaging Planes
 suprapatellar longitudinal and transverse scan:
– quadriceps tendon
– suprapatellar recess
 infrapatellar longitudinal scan:
– patellar ligament
– inferior patellar pole
– retropatellar fat pad
– tibial plateau
– anterior cruciate ligament (ACL) (oblique)
 medial and lateral imaging plane:
– anterior meniscal components
– femoral condyle contours
– proximal edge of the tibia
– collateral ligaments
 posterior longitudinal plane:
– components of the posterior cruciate ligament (PCL)
– joint effusion
– cyst/tumor development in the popliteal fossa
– regions around the posterior horns of the menisci
Role of Imaging
 demonstration of bony anatomy
 demonstration of relationship between femoral condyles and tibial plateau
 demonstration of relationship between patella and femur
 demonstration of knee joint cavity
 identification of osteophytes
 evaluation of capsule, ligament, tendon, and muscle structures
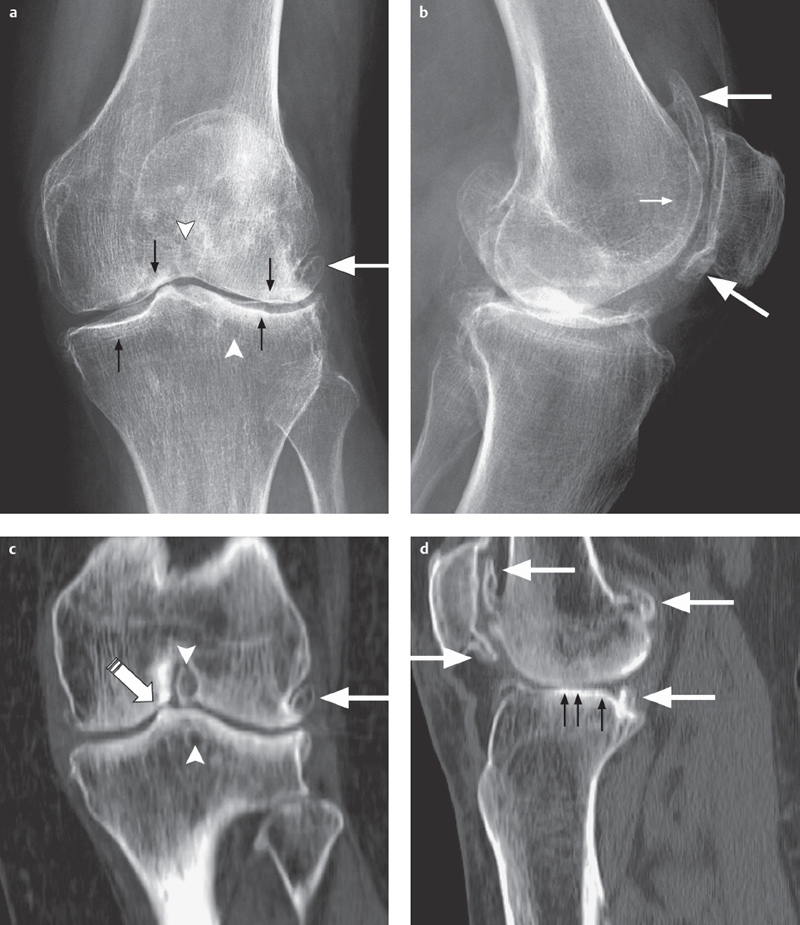
Fig. 3.1 a–d  Pronounced arthritis of the knee.
a, b Conventional radiography in two planes shows large osteophytic outgrowths (large arrows), sub-chondral sclerosis (small arrows), and cystic degeneration in the joint (arrowheads).
c, d The 2-D CT reconstructions (coronal and sagittal) show the size and localization of the osteophytes (large arrows), cysts (arrow-heads), subchondral sclerosis (small arrows), and narrowing of joint space (striped arrow). CT assists primarily in prosthetic reconstruction.
Findings
 diminution of joint space
 osteophytes
 joint effusion
 old traumatic lesions (bone defects or irregularities)
 possible intra-articular loose bodies
 meniscal lesions
 popliteal cysts
 documentation of joint translations
 capsule, ligament, tendon, and muscle calcifications
 (→ complementary method)
Recommended Imaging Mode
 standard CT:
– slice thickness: 1–2 mm
– table increment: 1–2 mm
– 2-D reconstruction (sagittal and coronal): 1–2 mm slice thickness
– 3-D reconstruction; if joint surface involvement, subtraction of uninvolved bones for an unobstructed view of the position of the affected articular surface
 (multislice) spiral CT:
– slice thickness: 0.5–2 mm
– table increment: 2–5 mm/rotation
– increment: 0.5–2 mm
– 2-D reconstruction (sagittal and coronal): 1–2 mm slice thickness
– 3-D reconstruction for end oprosthesis planning, if necessary subtracting overlapping bones for unobscured demonstration of articular surfaces
Findings
 diminution of joint space
 osteophytes
 geodes
 articular surface destruction
 old traumatic lesions (bone defects, joint irregularity, consolidated fractures)
 intra-articular loose bodies
 extent of calcifications of the capsule, ligaments, tendons, and muscle
 (→ complementary method of choice)
Recommended Sequences
 short tau inversion recovery (STIR) sequence
 T1-weighted (T1) and T2-weighted (T2) turbo spin-echo (TSE) or gradient-echo (GE) sequences (possibly fat suppressed)
 contrast enhancement to detect presence and extent of inflammatory changes
 fat-saturated T2*-weighted (T2*) 3-D GE sequences or fat-saturated proton density-weighted (PD) sequences to demonstrate cartilage
Recommended Imaging Planes and Section Thickness
 sagittal:
– menisci, cruciate ligaments, patellofemoral joint, patellar, condylar and tibial cartilage, anterior and posterior joint capsule/synovium
 coronal:
– menisci, cruciate ligaments, collateral ligaments, patellar, condylar and tibial cartilage, medial and lateral joint capsule/synovium
 axial:
– patellofemoral joint, patellar retinaculae, patellar cartilage, joint capsule/synovium
 oblique sagittal section, 15–20° angle:
– depending on angle, complete longitudinal scan of the ACL/PCL including origin and insertion
– section thickness: maximum of 4 mm, optimally 2–3 mm
Findings
 plain T1 sequence:
– demonstration of hypointense osteophytes
– demonstration of hypointense geodes
– demonstration of hypointense intra-articular loose bodies
– demonstration of hypointense calcifications
– demonstration of hyperintense fatty bone or soft tissue
– intermediary to hypointense demonstration of subchondral fibrosis/sclerosis
 STIR/T2-weighted (T2) sequence:
– demonstration of hyperintense geodes
– demonstration of hyperintense inflammatory changes (active arthritis)
– demonstration of hypointense intra-articular loose bodies
– demonstration of hypointense calcifications
– demonstration of hyperintense joint effusion
– demonstration of hyperintense fatty bone or soft tissue
– demonstration of intermediary to hypointense subchondral fibrosis/sclerosis
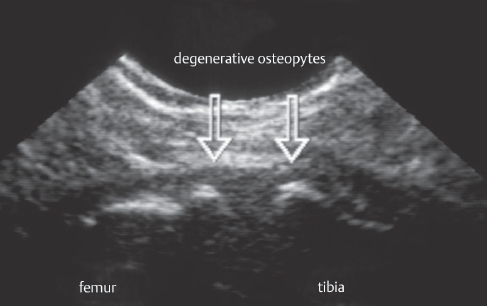
Fig. 3.2  Arthritis of the knee.
Sonography reveals a pair of clearly visible osteophytic spurs, demarcated by an irregular cortical rim (arrows, medial longitudinal scan).
 3-D GE/T2*/PD fast spin (echo) (FS) sequence:
– depending on weighting, signal alteration in zones of softening cartilage
– cartilage narrowing, ulceration, balding
– demonstration of hyperintense fatty bone or soft tissue (hypointense on fat-suppressed views)
 contrast-enhanced T1 sequence:
– demonstration of hypointense osteophytes
– demonstration of hypointense geodes
– demonstration of hyperintense inflammatory changes (active arthritis)
– demonstration of hypointense intra-articular loose bodies
– demonstration of hypointense calcifications
– demonstration of hyperintense fatty bone or soft tissue (hypointense demonstration on fat-suppressed views)
– demonstration of intermediary to hypointense subchondral fibrosis/sclerosis
 (→ complementary method, seldom indicated)
Recommended Imaging Mode
 planar multidetector camera or SPECT multiphase, whole body skeletal nuclear medicine
 i.v. administration of 550–750 MBq 99mTc-MDP
Findings
 increased uptake at arthritic sites (local increase of bone metabolism, transformation processes, inflammatory changes, pattern of joint involvement, activity)
Basic Treatment Strategies
Depending on the patient’s age, severity of arthritis, clinical symptoms
Conservative
 analgesics
 physical therapy
 local/intra-articular injection/infiltration with analgesics/corticosteroids
 intra-articular injection with hyaluronic acid
Operative
 arthroscopy
 meniscal (partial) resection/smoothing
 arthroscopic/open cruciate ligament replacement
 resection of popliteal cysts
 smoothing of cartilage
 Pridie drilling
 microfractures
 osteochondral cylinder
 transplantation (OCT)
 autologous chondrocyte transplantation (ACT)
 lateral release/medial tightening with recurrent patellar luxation
 synovectomy
 displacement osteotomy with varus/valgus malalignment
 endoprosthes is (partial or full prosthesis)
Retropatellar Arthritis
Definition
Primary osteoarthritis of the patellofemoral joint usually occurs in combination with omarthritis. Microscopic and macroscopic changes correspond to the lesions described in the previous section (“Degeneration of the knee joint” p. 65).
Pathology
 macroscopic:
– diminution of joint space
– osteophytes
– geodes uncommon
– joint effusion
– subchondral sclerosis
– cortical irregularity
 microscopic:
– hyperostotic cortical bone transformation
– necrotic bone
– osteochondral lesion
– geodes uncommon
– development of fibrocartilage
– reactive inflammatory or calcifying patellar tendon or ligament changes
Arthroscopic Stages
 stage I: neovascularization and synovial invasion on the medial articular facet stage II: beginning fibrillation of the medial articular facet
– stage III: increasing fibrillation, fissure formation, swelling and softening of central components of the articular surface
 stage IV: lateral articular facet also minimally involved
 stage V: marked additional involvement of the lateral articular facet
Outerbridge Classification
 stage I: cartilage softening
 stage II: additional superficial swelling
 stage III: extensive superficial erosions
 stage IV: deep erosions penetrating the cartilage
Role of Imaging
 demonstration of bony anatomy of the distal femur, patella, and chondral surface of the patella
 demonstration of position of tibial tuberosity
 detection of osteophytes
 evaluation of capsule, ligament, tendon, and muscle structures
Clinical Signs
 morning stiffness, weight-bearing pain, tenderness
 pain when sitting
 limited function
 audible noise when moving the joint, crepitation
 joint swelling, effusion
 patellar malalignment, joint mutilation
Diagnostic Evaluation (Figs. 3.3–3.7)
 (→ method of choice)
Recommended Radiography Projections
 standard projections:
– AP projection
– lateral projection, mediolateral roentgen ray path
 special projections (depending on clinical findings):
– Tunnel view/Notch view to demonstrate intercondylar fossa and eminence
– axial projection of the patella
– “defilée” views (axial projection with knee bent 30°, 60°, 90°) of the patella to demonstrate the patellofemoral joint
– 45° oblique views for better evaluation of the tibial plateau and proximal fibula
 conventional tomography:
– replaced by multislice CT and 2-D/3-D reconstructions
Findings
 diminution of joint space
 osteophytes
 cysts
cysts
 subchondral sclerosis
 cortical irregularity
 old traumatic lesions, old fragments
 tendon or muscle calcifications
 (→ complementary method)
Recommended Imaging Planes
 suprapatellar longitudinal and transverse scan
Findings
 diminution of joint space
 osteophytes
 joint effusion
 possibly old fragments
 possible calcification of tendons and muscle
 (→ complementary method)
Recommended Imaging Mode
 standard CT:
– slice thickness: 1–2 mm
– table increment: 1–2 mm
– 2-D reconstruction (especially sagittal): 1–2 mm slice thickness
– possibly 3-D reconstruction with subtraction of tibia, fibula, and patella
 (multislice) spiral CT:
– slice thickness: 0.5–2 mm
– table increment: 2–5 mm/rotation
– increment: 0.5–2 mm
– 2-D reconstruction (especially sagittal): 1–2 mm slice thickness
Related posts:
Stay updated, free articles. Join our Telegram channel

Full access? Get Clinical Tree


