5 Tumors and Tumorlike Lesions of the Knee Joint
Definition
Bone tumors can be divided into primary and secondary osseous tumors. The knee joint is the most common localization of primary tumors of the bone, occurring as malignant, potentially malignant, benign, or tumorlike lesions. The predilection for the knee joint is perhaps associated with this region having the most marked bone length growth. Prior to modern-day surgical methods and chemotherapy, osteosarcoma, for example, had a mortality rate of 75%, but today more than 75% of patients survive the disease.
Classification
 primary bone tumors:
– malignant tumors
– potentially malignant tumors
– benign tumors
– tumor-simulating diseases of the bone
 secondary bone tumors
Clinical Signs
 pain
pain
 swelling
 pathologic fractures
Diagnostic Evaluation
 (→ method of choice)
 primary method for detecting and diagnosing bone tumors
 allows differential diagnosis (DD) from other diseases of the bone
 allows evaluation of growth rate (aggressiveness) and thus the malignant/benign nature of the tumor according to the following three groups of morphological characteristics (Table 5.1, Fig. 5.1):
– osteolytic lesion form
– osseous reaction
– mineralization of the tumor matrix
 together with tumor localization and patient age (Tables 5.2, 5.3) can in most cases enable specific tumor diagnosis
 provides the basis for determining practical procedure:
– NOF (= don’t touch me lesion) no further diagnosis or therapy
– enchondroma or fibrous dysplasia: radiography and clinical surveillance
– other tumors: additional diagnostic imaging followed by histological evaluation
 bone tumors are only rarely undetectable on radiographs
Role of Imaging
 demonstration of osteolytic or osteoblastic lesions
 detection of matrix changes
 demonstration of periosteal reactions
 detection of cortical bone destruction
 demonstration of soft tissue components of the tumor
 relation of tumor to the joint, i.e., possible detection of infiltration
Table 5.1  Important radiographic signs of bone tumor for evaluating rate of growth (from lowest to highest-IA to III) or benign/malignant nature (IA= benign to III = malignant) based on Lodwick
Lodwick grading system | Lesion form | Bone reaction |
|---|---|---|
IA | geographic osteolytic lesion (A–C), sclerotic rim, intact compact bone | solid with sharp, smooth contour (A–C) |
IB | narrowing of compact bone, shell-like ballooning | |
IC | complete penetration of compact bone | |
II | geographic and moth-eaten lesion | lamellar, onionskin appearance |
III | moth-eaten and permeative destruction without geographic component | radial, spicular |
Table 5.2  Age distribution of malignant bone tumors
Age in years | Entity |
|---|---|
1 | neuroblastoma |
1–10 | Ewing sarcoma |
10–30 | osteosarcoma, Ewing sarcoma |
30–40 | parosteal osteosarcoma, myeloma, fibrosarcoma |
> 40 | metastases, myeloma, chondrosarcoma |
Table 5.3  Sites of predilection of primary bone tumors
Localization | Entity |
|---|---|
epiphysis | giant cell tumor, chondroblastoma |
metaphysis | chondrogenic tumors (chondroma, chondromyxoidfibroma, chondrosarcoma) osteogenic tumors (osteoid osteoma, osteosarcoma) |
diaphysis | medullary tumors (Ewing sarcoma, reticulosarcoma, myeloma) |
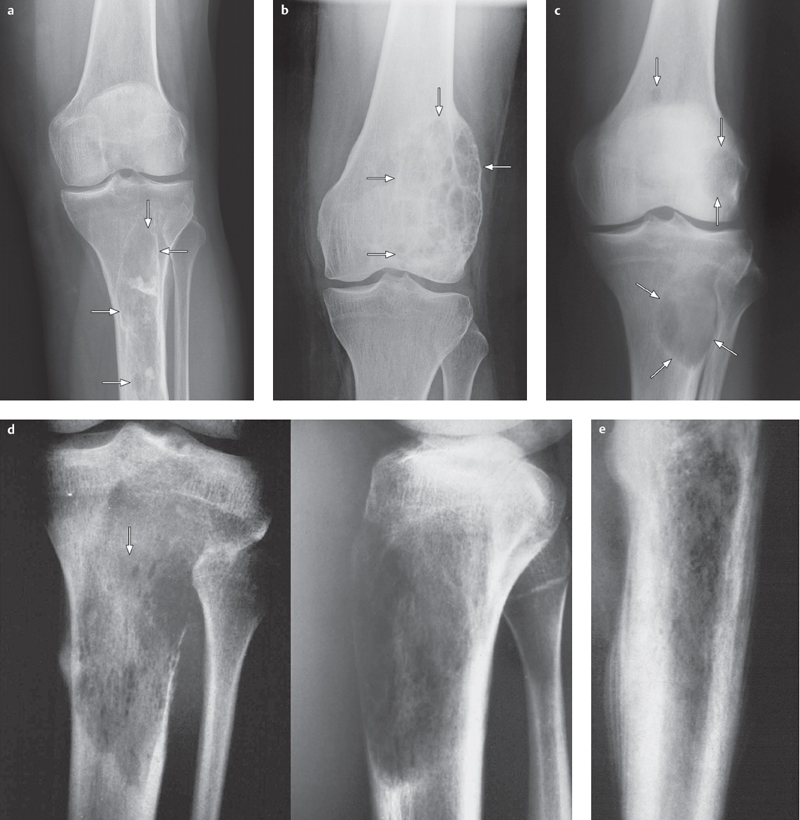
Fig. 5.1 a–e  Typical osseous changes associated with bone tumors, classification based on Lodwick.
The images illustrate the stages in osseous destruction, corresponding to the rate of tumor growth and thus its benign/malignant nature.
a Example of Lodwick grade IA: circumscribed, well defined osteolytic lesion with sclerotic rim and unremarkable cortical bone, corresponding to absence of growth and therefore a benign lesion. This example shows fibrous dysplasia of the proximal tibia.
b Example of Lodwick grade IB: geographic osteolytic lesion with circumscribed narrowing of compact bone and shell-like expansion as a sign of a slow-growing lesion, primarily a sign of a benign lesion. The lesion shown here is an aneurysmal bone cyst (ABC) of the distal femur.
c Example of Lodwick grade IC: geographic osteolytic lesion with complete penetration of compact bone as a sign of medium-grade tumor growth. This may be a sign of either a benign or malignant bone tumor. The lesion shown here is a myeloma in the proximal tibia with an infection focus there and two in the distal femur.
d Example of Lodwick grade II: moth-eaten osteolytic lesion with geographic destruction and lamellar or onion-skin periosteal as a sign of rapid and aggressive growth. The lesion shown here is a fibrosarcoma of the proximal tibia.
e Example of Lodwick grade III: moth-eaten osteolytic lesion with no geographic destruction, but with a radial and spicular periosteal reaction, features of a rapidly growing, highly aggressive, and malignant lesion. This image shows an osteosarcoma in the distal femur.
 (→ complementary method of choice)
 second diagnostic step in diagnostic imaging evaluation, supplementary diagnosis, and differential diagnosis
 definitive differential diagnosis of stress fractures and osteonecroses/bone infarction where radiological findings are uncharacteristic or where there is clinical suspicion of a tumor
 can differentiate between solid, cystic, and fatty tissue
 method of choice for locoregional staging (essential for the type of surgical approach and biopsy planning):
– exact tumor infiltration of bone and bone marrow
– joint infiltration with evaluation of joint capsule, ligaments, cartilage, and effusion
– involvement of vessel-nerve bundle
– spread of soft tissue tumor component and infiltration of adjacent soft tissue
 suitable for follow-up with some limitations

 reserved for specific indications
 important for diagnosing osteoid osteoma as the nidus is best demonstrated on CT
 valuable complementary examination of tumors in the pelvis, scapula, sternum (flat bones), and spine, lesions may be better detected and visualized
 back-up method if radiography and MRI do not produce a diagnosis

 detection of multifocal lesions such as metastases, multiple myeloma, skip lesions, or multiple manifestations of a primary bone tumor (e.g., Ewing sarcoma)
 benign lesion activity (e.g., enchondroma)
Angiography
 surgical planning, identification of anatomical variants and detection of tumor-related vessel displacement, compression, and stenosis
 previously important evaluation of vascular tumors (demonstration of vascular malignancy with corkscrew vessels and vascular disruption) is being replaced by sectional imaging modalities
 conventional catheter angiography currently being replaced by noncatheter MR angiography
Basic Treatment Strategies
surgical terminology (based on Enneking)
1 intralesional:
biopsy, curettage
2 marginal:
resection with a margin around the tumor capsule with out opening it
3 wide:
the tumor is completely covered with a margin of healthy tissue
4 radical:
excision of the tumor-containing compartment, often exarticulation
1 = with out a healthy margin
2–4= with a healthy margin
Malignant Bone Tumors
Osteosarcoma
Definition
 most common primary bone tumor of the knee joint
 knee joint (distal femur and proximal tibia) is the most common localization of osteosarcoma
 manifestation typically in the second and third decades of life; second, smaller age peak in old age
Pathology
 tumor cells characteristically produce osteoid
 tumor cells are pleomorph, sometimes resembling osteoblasts, and often demonstrate mitoses
Rare forms:
 telangiectatic osteosarcoma
– particularly aggressive form of osteosarcoma
– characterized by large blood-filled cavities separated by septa and only minimal osteoid formation
 parosteal osteosarcoma (Figs. 5.5, 5.6)
– superficial osteosarcoma
– 5% of osteosarcomas
– osteoblastic lesion, sitting on the cortical bone surface
– histologically high level of structural differentiation
– better prognosis than the other osteosarcomas
– somewhat older patient age compared to other osteosarcomas
 secondary osteosarcomas
– with underlying Paget disease
– with prior radiation treatment
Clinical Signs
 increasing pain over weeks and months
 pain projection and transmission
 soft tissue swelling
 pathologic fractures are uncommon
Diagnostic Evaluation (Figs. 5.2–5.6)

Recommended Radiography Views
 important: long format with clinical suspicion of tumor to avoid “cutting off” tumor
Findings
 diagnosis usually made on the basis of radiography; staging using MRI
 typical radiography view demonstrates mixture of osteoblastic and osteolytic lesions
 osteoblastic components are usually so characteristic that they lead to diagnosis
 cortex destruction
 periosteal reaction with lamellar pattern or, more commonly, radial periosteal reactions-with spicular or “sun-burst” outgrowths-marking aggressive, rapid tumor growth
 metaphyseal localization
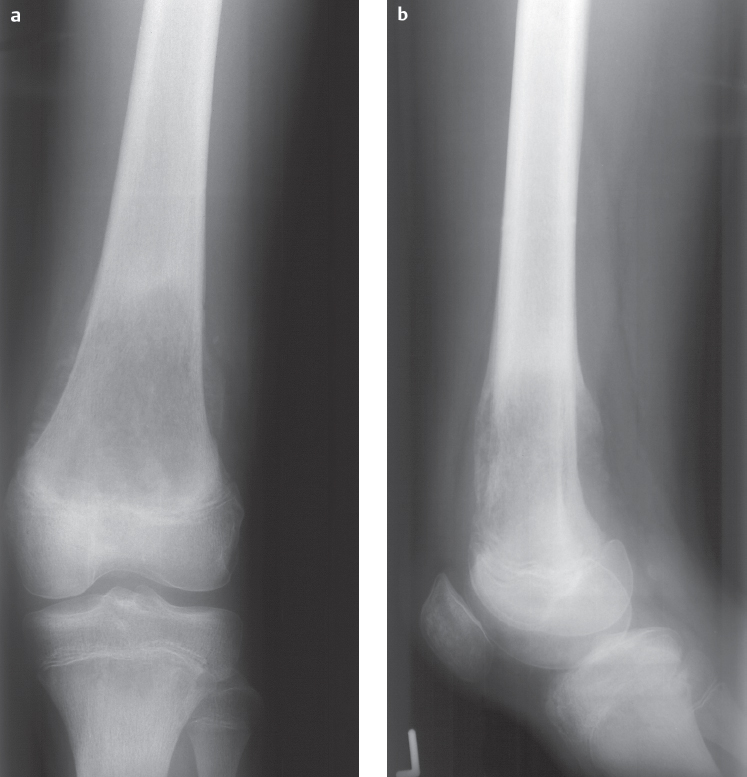
Fig. 5.2a, b  Osteosarcoma on conventional radiographs.
Osteolysis in the metaphysic of the distal femur. The lesion border is not clearly demarcated and there is a mixed lamellar and spicular periosteal reaction.
Basic Treatment Strategies
 preoperative and post-operative chemotherapy (= neoadjuvant chemotherapy) with the aim of the highest degree of tumor necrosis possible
 wide or radical resection if needed with joint resection and replacement (tumor must be covered with healthy tissue all the way around, intraosseous safe zone ca. 5 cm)
 use of modular prostheses or biological reconstructions
 amputation rarely necessary these days and no more certain oncologically

Indications
 best method for staging
 evaluation of intraosseous infiltration based on sharp line between bone tumor and normal bone marrow
 detection of soft tissue tumor component that can displace or even infiltrate adjacent soft tissue structures
 infiltration of the joint:
– joint effusion is an inconclusive sign as this can also be present without infiltration
– joint infiltration typically occurs via the joint capsule and ligament apparatus
 preoperative evaluation (especially important for the surgeon) of infiltration of the vessel-nerve bundle possible:
– decision to retain or replace nerve and vessels
– important: MRI can potentially overstage in this case
Recommended Sequences
 axial view is most important for evaluating the vessel-nerve bundle because it allows for vertical orientation to the anatomical structures
 T1-weighted spin-echo (T1 SE) sequence
 T2-weighted (T2) SE sequence
 contrast enhancement
 short tau inversion recovery (STIR) or T1 SE sequences
Findings
 T1 SE sequence:
– evaluation of the border between tumor and healthy bone marrow
 T2 SE sequence:
– tumor characterization
 contrast enhancement:
– detection of enhancing tumor vs. nonenhancing necrotic or cystic tumors
 STIR or T1 SE sequences:
– exclusion of skip lesions (tumor manifestations near the tumor) in entire affected compartment
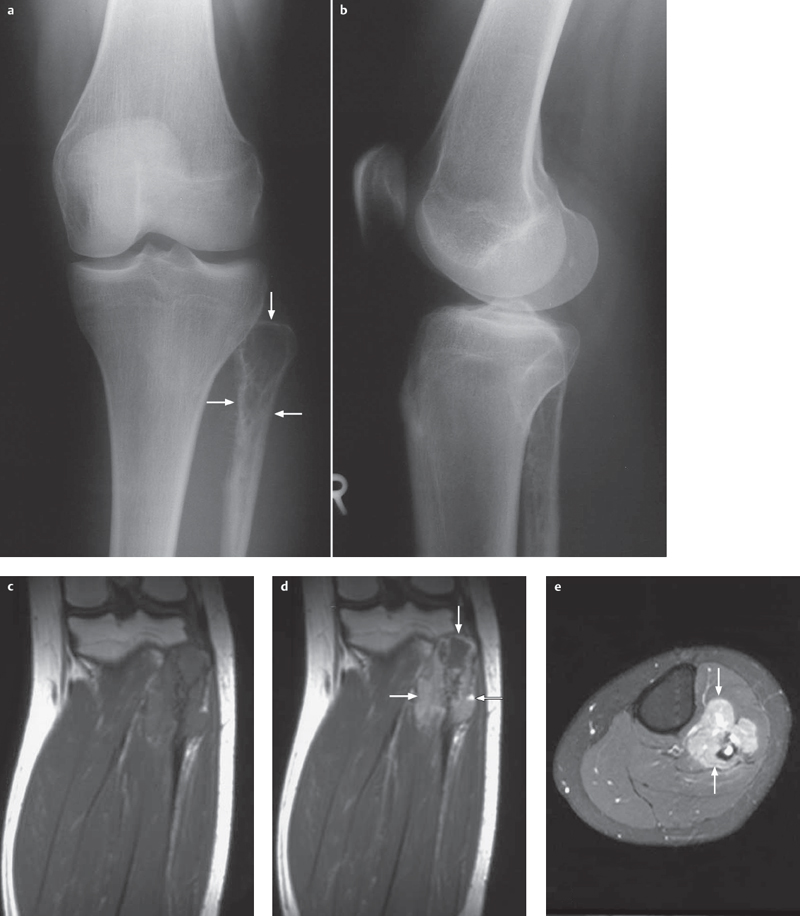
Fig. 5.3 a–e  Osteosarcoma, radiography, and MRI.
a, b AP and lateral radiographs show a discrete osteolytic lesion in the proximal fibular metaphysis and epiphysis as well as a spicular periosteal reaction.
c–e MRI views, coronal T1 (c), coronal contrast-enhanced sequence (d) and axial fat-suppressed (e), show in addition to the radiographic image a clearly visible soft tissue tumor component, separated by a well defined border from the normal musculature of the lower leg.
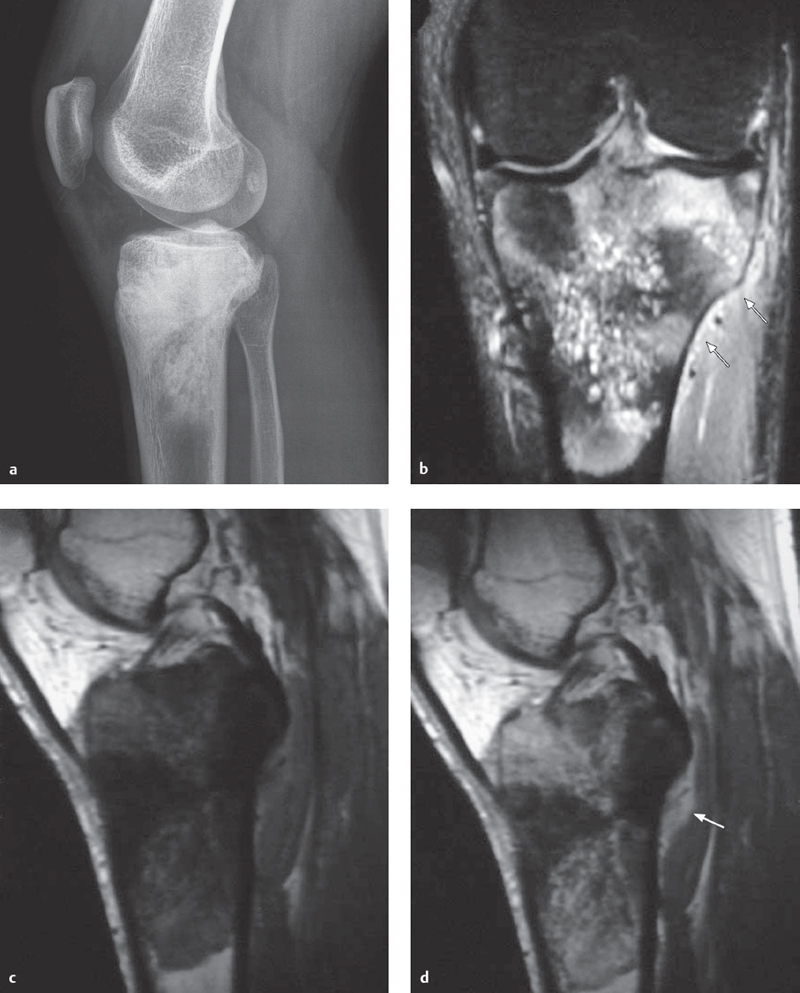
Fig. 5.4 a–d  Osteosarcoma, radiography, and MRI.
a A lateral X-ray projection shows marked ossifications in the proximal tibial metaphysis and epiphysis, typical signs of osteosarcoma.
b–d An MRI-coronal STIR sequence (b), sagittal T1 SE sequence (c) and sagittal contrast-enhanced sequence (d)–shows low signal areas in the bone marrow on T1 and T2, which correspond to sclerosis. At the same time, selected areas demonstrate with low signal on T1, high signal on T2, and are contrast-enhancing. There is only a tiny soft tissue tumor component, though there is intra-articular tumor infiltration near the anterior cruciate ligament.
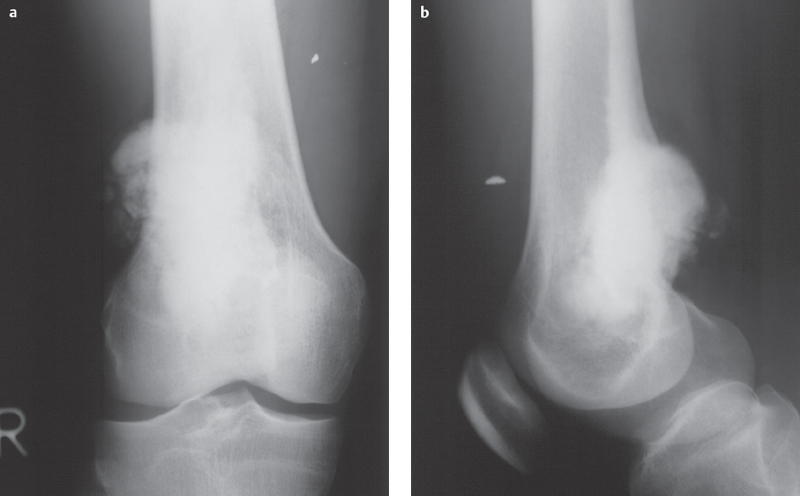
Fig. 5.5a, b  Parosteal osteosarcoma.
Pronounced and easily distinguishable extraosseous sclerosis on the dorsal aspect of the distal femoral metaphysic can be seen on AP (a) and lateral (b) projections with a wide area of contact with the cortical bone. The radiograph shows almost no destruction.
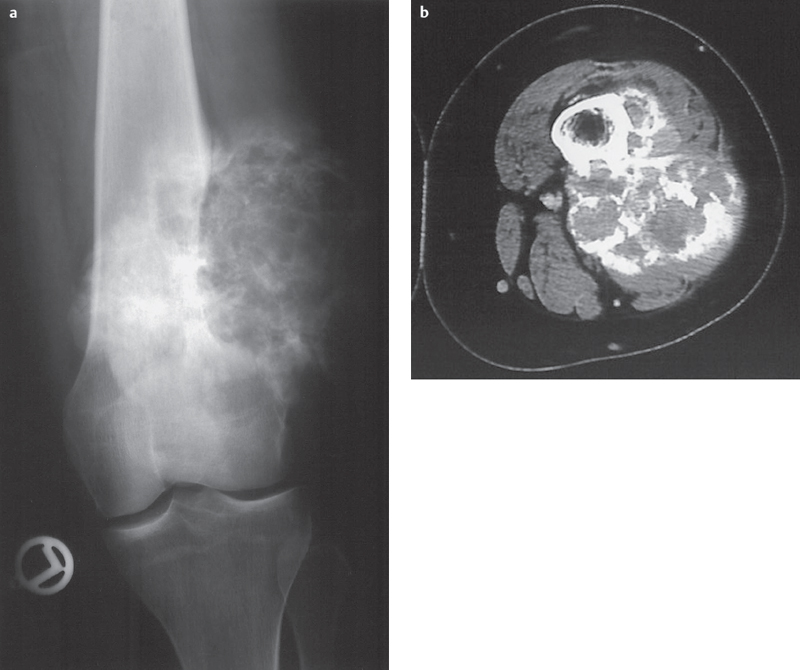
Fig. 5.6 a,b  Parosteal osteosarcoma.
Calcifications and ossifications sitting on the distal femur, demonstrating an irregular shell-like structure, and causing uneven narrowing of cortical bone.
a radiograph.
b CT.
Chondrosarcoma
Definition
 second most common primary malignant bone tumor
 most commonly localized in the pelvis, though knee joint localization possible
 average patient age is in middle to upper age ranges
Basic Treatment Strategies
 does not respond to chemotherapy or radiation treatment
 therapy based on histological grade
 low-grade chondrosarcoma: intralesional curettage or resection with a healthy margin
 higher-grade malignancies: wide resection with a healthy margin, possibly with joint resection and replacement
 amputation if widespread infiltration
Pathology
 hyaline cartilage structure with a myxoid matrix
 number of cells as well as nuclear atypia increases with histological grades I–III
 histological grading is problematic, however, and must be correlated with clinical and radiological criteria
 histological differentiation between “low-grade” chondrosarcomas (grade I) and enchondromas can be extremely difficult and even impossible
 malignant transformation must be assumed in the case of radiologically demonstrated cortical destruction and clinical pain symptoms
Clinical Signs
 usually gradual development of pain symptoms
 sometimes only soft tissue swelling without pain
 pathologic fracture uncommon
 often enormous tumor size with pelvic localization
Diagnostic Evaluation (Fig. 5.7)

Findings
 intramedullary chondrosarcoma:
– cortical destruction
– matrix calcifications in 60–70%, characteristically nodular or popcornlike (Fig. 5.14)
 DD enchondroma:
– intramedullary chondrosarcomas can arise from enchondromas
– differentiation based on size:
– enchondromas are usually small, chondrosarcomas large

Indications
 exact demonstration of noncalcified tumor components and thus exact tumor infiltration
 preoperative staging:
– joint infiltration
– infiltration of neurovascular structures
Findings
 T2 sequences:
– noncalcified tumor components: characteristically signal intense, white
– calcified areas without signal, black
Stay updated, free articles. Join our Telegram channel

Full access? Get Clinical Tree


