6 Endocrine/Metabolic Disorders and Crystal-induced Diseases
Osteomalacia and Rickets
Definition
Osteomalacia and rickets both are characterized by inadequate calcification of newly formed bone matrix with accumulation of osteoid. In rickets, there is additional involvement of the growth plate.
Pathology
 causes:
– deficiency in active form of vitamin
– impaired vitamin D metabolism
– calcium deficiency
– impaired phosphate metabolism
– gastrointestinal malabsorption
 inadequate or delayed osteoid mineralization in compact and cancellous bone
 rickets: disorganization in the growth plate and adjacent metaphysis
Clinical Signs
 bone pain
 muscular weakness and adynamia
 skeletal deformity (bellshaped thorax, fish vertebrae, rachitic rosary, varus or valgus deformity of knee)
Diagnostic Evaluation
 (→ primary method of choice)
Recommended Radiography Projections
 standard projections of the knee joint in two planes
Findings
 rickets:
– widening of the growth plate
– diminished density on the metaphyseal side of the growth plate
– widening and “cupping” of the metaphysis
– disorganization and fraying of metaphyseal cancellous bone
– deossification and indistinct margin of epiphyseal ossification centers
– abnormal curvatures (saber tibia)
 osteomalacia:
– diminished bone density and indistinct fine bone structure (ground-glass appearance), thinning of compact bone
– thickening of long tubular bones from sub periosteal osteoid deposition
– Looser zones of transformation
 (→ complementary method for osteomalacia)
 99mTc whole body scan is positive at typical (osteomalacia) Looser zones
Role of Imaging
 identification of abnormal bone density and structure
 identification of Looser zones
 demonstrate typical changes in rickets involving the growth plate, metaphysis, and ossification centers
Basic Treatment Strategies
 vitamin D replacement
 UV irradiation
 normalization of serum phosphate and serum calcium levels
Osteoporosis
Definition
Osteoporosis involves a decrease in bone mass, structural changes to bone tissue and deteriorating osseous functions that lead to an increased risk of fracture.
Pathology
 bone atrophy, predominantly caused by pathologically increasing bone loss with normal new bone formation (exception: senile osteoporosis)
 thinning and rarification of trabeculae
 thinning of cortical bone
Generalized Osteoporosis
Role of Imaging
 identification of abnormal bone density and structure
 identification of pathologic fractures
Pathology
 primary osteoporosis:
– type I osteoporosis:
postmenopausal osteoporosis
– type II osteoporosis:
senile osteoporosis
– idiopathic osteoporosis:
juvenile, presenile
 secondary osteoporosis:
– endocrine
– calcium deficiency related to malabsorption
– inactivity induced atrophy
– hereditary disorders (e.g., osteogenesis imperfecta)
– rheumatic diseases
– drug-induced (cortisone, antacids)
Clinical Signs
 pain only with fracture (trauma usually inadequate)
Diagnostic Evaluation

Recommended Radiography Projections
 standard projections
Findings
 more prominent trabecular pattern due to loss of cancellous bone
 thinning of cortical bone
 muscle and ligament insertions clearly standing out
 important: impossible to quantify osteoporosis

 only as supplementary diagnostic procedure for complicated or occult fractures
Basic Treatment Strategies
 drug therapy depending on cause of osteoporosis
 avoid trauma
 minimization of risk factors (poor diet, nicotine, lack of activity)
Regional Osteoporosis
Inactivity-induced Osteoporosis
Pathology
 venous stasis due to failure of muscle pump
 active hyperemia from nerve damage
Diagnostic Evaluation (Figs. 6.1, 6.2)
 (→ method of choice)
Findings
 homogenous or bandlike decreases in bone density affecting the metaphysis or appearing in patches
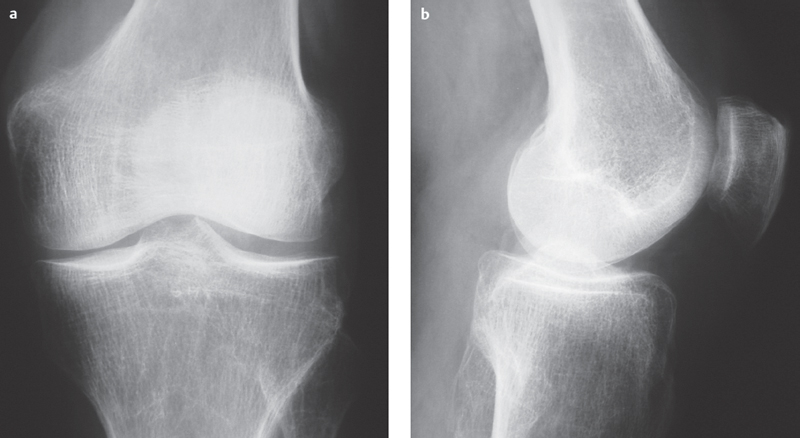
Fig. 6.1a,b  Inactivity-induced osteoporosis.
Conventional radiograph, AP, and lateral: mixed homogeneous and patchy decreases in bone density with clear trabecular pattern and cortical thinning as a result of inactivity following trauma.
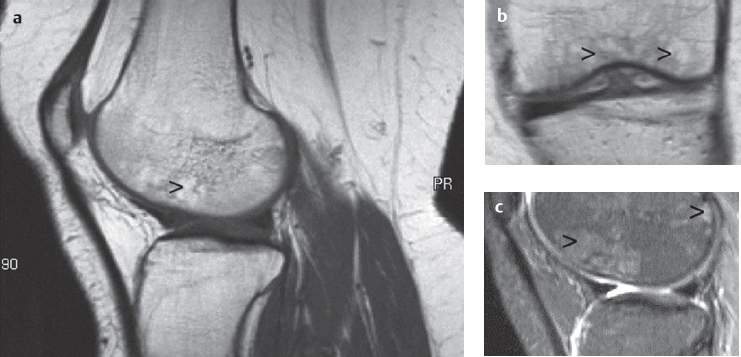
Fig. 6.2 a–c  Inactivity-induced osteoporosis.
Coarse, strandlike subchondral bone structure and patchy areas of high signal.
a MRI sagittal section, T1.
b MRI coronal section, T1.
c MRI sagittal section, STIR.
Regional Migratory (Transient) Osteoporosis
Pathology
 very rapidly developing osteoporosis of the joint
 self-limiting and reversible
 migratory character: after abatement, attack of further joints, generally next closest
 no history of trauma or immobilization
Clinical Signs
 localized pain and swelling
Diagnostic Evaluation

Findings
 moderate osteopenia
 certain segments may be more heavily involved (e.g., medial femoral condyle)

Recommended Sequences
 short tau inversion recovery (STIR)
Findings
 high-signal bone marrow edema (Fig. 6.3)
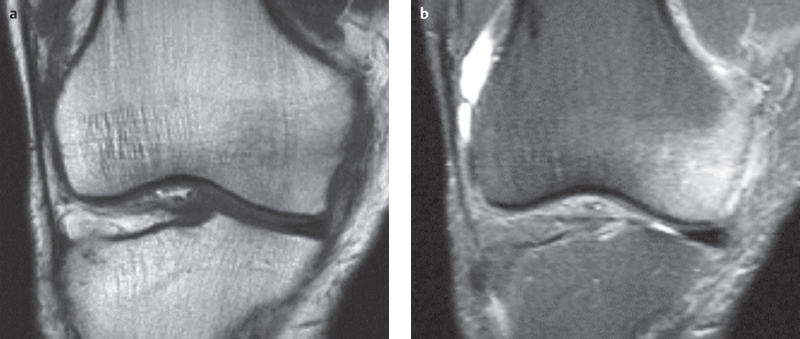
Fig. 6.3a,b  Transient regional osteoporosis.
a MRI coronal section, T1 SE: diffuse hypointensity in the medial femoral condyle.
b MRI coronal section, STIR sequence: diffuse high signal bone marrow edema in the medial femoral condyle.
Aggressive Regional Osteoporosis
Pathology
 rapidly progressing patchy osteoporosis
 osteoclastic bone resorption caused by active or passive hyperemia
Clinical Signs
 nonspecific pain
 posttraumatic or with trophic disorders (e.g., lymphedema)
Diagnostic Evaluation
 (→ method of choice)
Recommended Radiography Projections
 knee joint in two planes with adjacent parts of lower and upper leg
Findings
 frayed cortical bone with subperiosteal and endosteal osteolytic lesions (appearance comparable to metastasis)

 only as a supplemental procedure to exclude presence of blastoma
Sudeck Atrophy (Reflex Sympathetic Dystrophy Syndrome)
Role of Imaging
 identification of abnormal density and structure of cortical and cancellous bone
 exclusion of arthritis if intra-articular erosions absent
 in Sudeck atrophy, evaluation of soft tissue changes according to stage
Pathology
 microcirculation disorder resulting from dysfunctional sympathetic vasoconstrictor neurons
 trophic disorder involving bone and periarticular soft tissue structures
 stages in disease course:
– stage I-early stage: soft tissue edema
– stage II-acute stage: decrease in bone density, bone resorption in cortical and cancellous bone, marked inflammatory dystrophic soft tissue swelling
– stage III-healing stage: resolution of soft tissue swelling and decrease in bone density with coarse strandlike cancellous bone structure
– stage IV-defect stage: soft tissue atrophy and moderate loss of bone density with coarsening of cancellous architecture
Clinical Signs
 painful swelling and hypersensitivity
 livid skin coloration
 functional limitation
Diagnostic Evaluation
 (→ method of choice)
Recommended Radiography Projections
 standard projections
Stay updated, free articles. Join our Telegram channel

Full access? Get Clinical Tree


