4 Inflammatory Diseases
Infectious Diseases of the Joint
Septic Arthritis
Septic arthritis is an infection of the joint and periarticular tissues that is caused by microorganisms. The causes of suppurative arthritis may be endogenous (uncommon) or exogenous (direct tissue inoculation with a pathogen, common). In endogenous infection, the pathogen enters the joint either by hematogenous spread or from a contiguous infection focus (osteomyelitis). Infectious arthritis of exogenous origin arises from trauma (open wound involving the joint) or iatrogenically from injection, puncture, open surgery, or arthroscopy.
Pathology
 purulent joint effusion
 para-articular tissue is involved in the inflammatory process (capsule phlegmona)
 enzymatic destruction of articular surfaces (cartilage and bones), panarthritis
 defect healing with tissue atrophy and secondary degenerative disease
 fibrotic or bony ankylosis
Clinical Signs
 acute emergency situation
 immediate diagnosis and therapy essential to avoid permanent damage
 sites of predilection: knee, hip
 usually pronounced localized signs of inflammation (heat, pain, redness, swelling, functional loss)
 serous, serofibrous, or suppurative effusion
 evidence of organisms in effusion (confirm diagnosis, antibiogram)
 common organisms: Staphylococcus, Streptococcus, Pneumococcus, E. coli, Salmonella, Klebsiella, possibly Gonococcus
 possible general signs of inflammation:
– fever, chills
– leukocytosis, elevated erythrocyte sedimentation rate (ESR), elevated C-reactive protein (CRP) levels
– clinical picture of septic spread (e.g., pneumonia)
 atypical presentation with insidious onset:
– immunosuppressed patients
– elderly patients
– treated infections
– specific pathogens
Diagnostic Evaluation
 (→ method of choice, no early diagnosis)
Recommended Radiography Projections
 standard projections: anteroposterior (AP) projection and lateral projection with the patient recumbent
Findings
 unremarkable early stages
 joint effusion:
– early sign: poorly defined posterior contour of the rectus femoris tendon
– patellofemoral distance > 5 mm
– swelling of the suprapatellar bursa: lateral projection: tongueshaped, smoothly bordered,
soft-tissue obstruction arising from the patellofemoral joint space, located between the femoral metaphysis and rectus femoris tendon
AP projection: with vast joint effusion, sharply contoured, large arclike soft tissue attenuation overlapping but not obscuring the vastus muscle shadow
– dorsal: displacement of the physiological fatty layers (in the shape of a “3”), the contours of the femoral condyles and tibia normally conform to each other at a distance of 1–2 mm, displacement of the fabella or calcified popliteal artery
– important: excessive flexion on lateral views: effusion may be pressed into posterior joint regions, making it much more difficult to identify
 periarticular edema:
– fluid-filled infrapatellar fat pad
 periarticular demineralization (Fig. 4.1):
– nonspecific early sign (e.g., with inactivity or inflammatory processes) so-called subchondral femur band: demineralization of a narrow subchondral band on both femoral condyles
– spotty demineralization of the patella
– bandlike metaphyseal demineralization of the femur and tibia (with inactivity or inflammatory processes)
– later markedly unharmonious patchy demineralization (Fig. 4.2)
 signs of cartilage destruction (narrowing of joint space)
 osseous destruction (Fig. 4.2):
– poorly defined subchondral bone
– erosions initially on the joint margins
– often predominantly focal, rapidly progressing, deep destruction compared to rheumatic arthritis of variable morphology and pattern of involvement
– sclerosis in regions of destruction and adjacent areas
– progression of destruction may initially continue with therapy despite clinical response (removal of debris)
 subluxation (especially dorsolateral rotational subluxation)
 findings after previous infectious arthritis:
– ankylosis
– arthritic deformity with defect healing
Role of Imaging
 diagnosis of arthritis
 DD: osteomyelitis, rheumatoid arthritis, allergic arthritis, crystal-induced arthritis, trauma, tumor, arthrosis
 assessment of disease activity and severity evaluation of healing processes or progression
 exclusion of complications
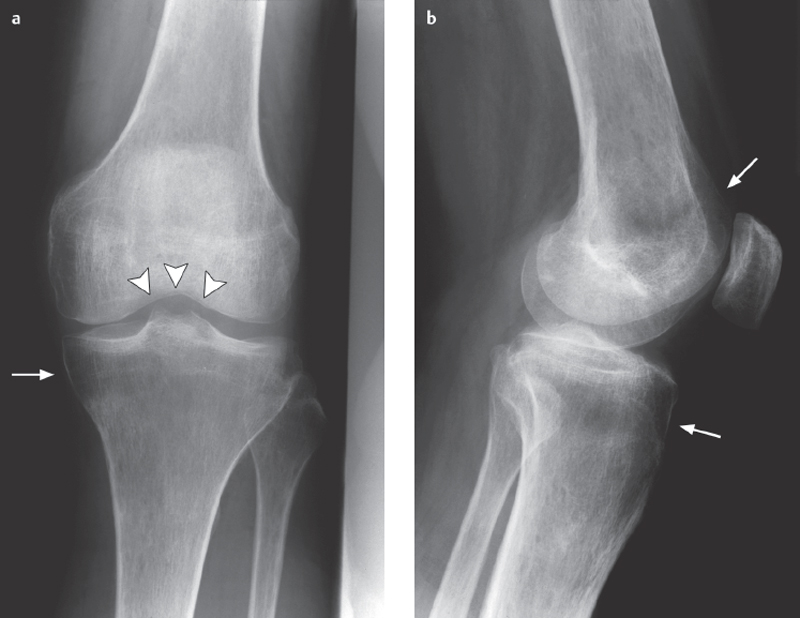
Fig. 4.1 a, b  Juxta-articular osteoporosis.
Nonspecific finding of demineralization near the joint that may be caused by inactivity or an inflammatory involvement of the joint.
a The subchondral femur band (arrowheads) is an early sign.
b There is also a band of demineralization in the tibial and femoral metaphyses (arrows).
Basic Treatment Strategies
Early, aggressive, interdisciplinary therapy is necessary to prevent joint destruction
Antibiosis
 after analysis of synovial fluid (cell count), Cram stain, culture, i.v. empiric antibiotics
 depending on origin (out-patient, nosocomial), Gramstain, patientage, e.g., cefuroxime or cefotaxime plus flucloxacillin
 targeted continued therapy after antibiogram
Local therapy
 complementary therapy: needle decompression with irrigation
 possible attachment of a suction-irrigation tube
 local cryotherapy
 only short-term immobilization, early movement therapy
 (→ method of choice)
Recommended Imaging Planes
 standard projections:
– suprapatellar transverse, longitudinal
– parapatellar
– longitudinal infrapatellar
– medial and lateral longitudinal
– dorsal transverse and longitudinal
 depending on local findings
Findings
 joint effusion
 hypoechoic distention of the synovial tissue
 edematous fluid accumulation in soft tissues
 narrowing of joint space
 possible marginal erosions

 only addressing specific clinical questions
 if magnetic resonance imaging (MRI) contraindicated
 (→ complementary method)
Recommended Sequences
 coronal short tau inversion recovery (STIR) sequence
 T1-weighted spin-echo (T1 SE), sagittal T2-weighted turbo spin-echo (T2 TSE)
 contrast-enhanced T1 SE fast spin (echo) (FS), sagittal or coronal, transversal
Findings (Fig. 4.2)
 effusion (nearly always present):
– fluid signal
– with high protein or cell content slight signal increase on T1 sequences, possible sedimentation effects
– late (> 10 minutes post injection), possible enhancement from diffusion caused by inflammatory changes in the synovial lining
 synovitis (early detection):
– bandlike diffuse distention of synovial membrane
– T1: intermediary, T2: slightly hyperintense
– marked bandlike enhancement
 bone marrow edema:
– initially marginal (joint margin, capsular attachment)
– later epiphyseal, irregular, poorly demarcated toward diaphysis
 erosion of articular surface:
– focal and/or diffuse cartilage erosion
– osseous erosions initially marginal (T2: hyperintense, enhancing)
– later deep, irregular, enhancing erosions surrounded by marked bone marrow edema
 periarticular involvement:
– abscess
– phlegmon of muscle canals
– bursitis

Recommended Imaging Mode
 three-phase bone scan
 leukocyte nuclear medicine
Findings (Fig. 4.2)
 three-phase bone scan:
– considerably earlier positive findings than radiograph, sensitivity comparable to MRI
– increased uptake on perfusion and blood pool phases, on all three phases with osseous destruction
 leukocyte nuclear medicine:
– increased uptake at infection site
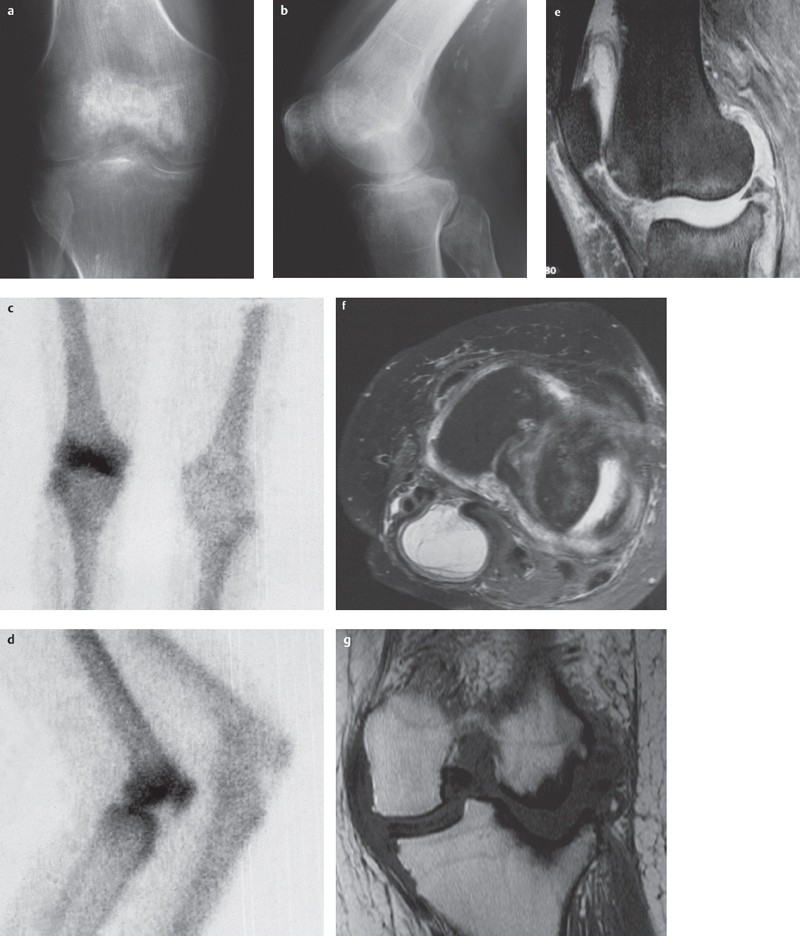
Fig. 4.2a–g  Septic arthritis (Stophylococcus aureus).
a, b Severe, unharmonious patchy periarticular demineralization. Narrowing of joint space due to cartilage destruction. Focal erosion of subchondral bone and osseous destruction, especially on the lateral tibial plateau.
c, d Bone scan shows hot spots at the patella, tibial plateau, and femoral condyles.
e–g T2 TSE FS sagittal (e) and transversal (f), T1 SE coronal (g) views in a patient with staphylococcal arthritis: joint effusion and synovial swelling, Baker cyst, in this patient with only mild bone marrow edema, deep destruction of articular surfaces especially in the lateral compartment with signs of perifocal sclerosis (courtesy of Prof. Dr. J. Maeurer, Munich).
Diagnostic Outline for Evaluating Septic Arthritis
1. Radiography (basic diagnosis)
Indications
 often no specific findings in early phase, however indicated for exclusion of other pathological findings and as a basis for follow-up examinations
 specific diagnosis possible later, estimate of extent of cartilage and osseous destruction
 exclusion of complications
 documentation of progression
2. US
Indications
 documentation of effusion
 differentiation between intra-articular effusion and bursitis or other soft tissue swelling
 synovial cysts
3. CT
Indications
 reserved for specific clinical questions
 if cross-sectional imaging is required but MRI is contraindicated
4. MRI
Indications
 supplementary, especially for severe disease courses
 best method for morphological demonstration of bone and soft tissue involvement
5. NM
Indications
 search for septic infection foci
 exclusion of multifocal infection
Osteomyelitis
Classification According to Etiology and Course
 acute hematogenous osteomyelitis
 subacute osteomyelitis
 chronic osteomyelitis
 posttraumatic osteomyelitis
 special forms (developing into rheumatic disease):
– sclerosing osteomyelitis of Garré
– chronic recurrent multifocal osteomyelitis
Acute Hematogenous Osteomyelitis
Definition
Acute hematogenous osteomyelitis is an acute suppurative inflammation of the bone marrow caused by remote infection leading to bacteremia and which may spread to joints and soft tissues.
Role of Imaging
 diagnosis of osteomyelitis
 DD: bone tumor, leukemia, possible joint involvement
 evaluation of activity and involvement of bone and soft tissue structures
 determination of progression or healing processes
 recognition of complications
Clinical Signs
 children:
– sudden high fever
– localized signs of inflammation
– possible clinical signs of toxicity
– site of predilection: metaphysis of long bones
– organisms: Staphylococcus aureus, Streptococcus, E. coli, Hemophilus influenzae
 adults:
– less dramatic clinical picture, may be insidious
– local signs of inflammation
– fever
– site of predilection: axial skeleton
– Gram-negative organisms, Staphylococcus aureus
Diagnostic Evaluation
 (→ method of choice)
Recommended Radiography Projections
 standard projections
Findings
 generally lags behind clinical signs
 infant up to one year of age:
– regions of metaphyseal lucency
– unharmonious demineralization
– periosteal reaction
– joint effusion
– relatively rapid spread to adjacent joint
 child:
– metaphysis most common localization
– epiphyseal plate acts as barrier to involvement of epiphysis and joint
– soft tissue swelling
– unharmonious demineralization
– lamellar periosteal reaction
– osseous destruction with lucency in cancellous bone occurring after days or weeks
– late cortical defects
 adults:
– unharmonious, patchy demineralization
– lamellar periosteal reactions
– poorly defined areas of lucency in cancellous bone
– cortical destruction:
– tunneling, endosteal cortical thinning, subperiosteal defects
– sequestra (necrotic bone in demarcation cavity), indication for surgery
 (→ with children)
Recommended Imaging Planes
 standard imaging planes
 depending on findings
Findings
 soft tissue edema
 periosteal elevations
 fluid collections in soft tissue structures
 effusion in adjacent joint
 (→ if clinical suspicion of sequestra)
Recommended Imaging Mode
 bone algorithm/soft tissue algorithm
 standard CT:
– slice thickness: 1–3 mm
– table increment: 1–3 mm
 spiral CT:
– slice thickness: 1–3 mm
– table increment: 2–5 mm
– increment: 1–3 mm
 sagittal and coronal two-dimensional (2-D) reconstructions
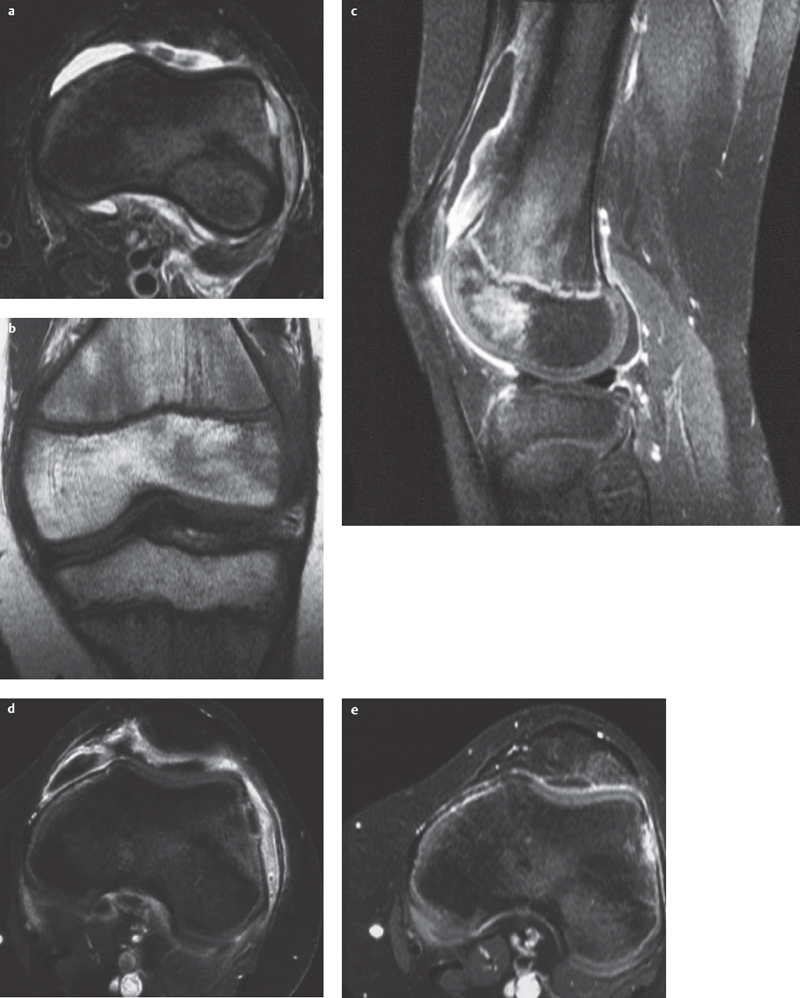
Fig. 4.3a–e  Acute hematogenous osteomyelitis.
a–d A basically monotone image. Mild, circum-scribed epiphyseal bone marrow edema with partial fat signal loss and poor demarcation. Small cortical defect and subperiosteal fluid collection (pus) and surrounding bandlike contrast enhancement. Synovitis and knee joint effusion.
a STIR, transversal.
b T1 SE, coronal.
c T1 SE FS + contrast enhancement, sagittal.
d T1 SE FS + contrast enhancement, transversal.
e STIR. Resolution of bone marrow edema and effusion after antibiotic therapy (courtesy of Dr. J. Zander, Dr. St. Kessler, Bad Kreuznach)
Findings
 soft tissue swelling and fatty tissue masking
 fluid collections
 obliteration of fatty marrow in the marrow cavity
 destruction of cancellous and cortical bone
 sequestra:
– usually intracancellous localization
– sclerotic bone within osseous defect
Basic Treatment Strategies
Antibiosis
 early pathogen detection (blood culture, subperiosteal fluid) and evaluation of resistance
 always initial parenteral nutritional support
 choice of antibiotic based on presumed pathogens

Recommended Sequences
 coronal STIR sequence
 T1 SE, coronal or transverse
 contrast-enhanced T1 SE FS, coronal and sagittal or transverse
Findings (Fig. 4.3)
 inflammatory bone marrow change:
– poorly defined bone marrow edema with partial loss of fat signal
– large area of acute inflammation (as opposed to chronic process in which the area is relatively circumscribed)
 inflammatory periosteal and soft tissue changes:
– periosteal expansion, T2: hyperintense, T1: hypointense, enhancing
– edema and hypervascularization of the adjacent fatty tissue, poorly demarcated
 cortical disruptions
 bone necrosis:
– early: gaps in enhancing areas
– late: demarcation border
 bone abscess:
– central fluid collection, T2: hyperintense, T1 hypointense, intermediate or slightly hyperintense (protein), nonenhancing
– marked enhancement of surrounding abscess capsule
– late: peripheral low signal area of fibrosis and sclerosis (developing into subacute osteomyelitis)
 soft tissue abscess or sinus:
– fluid-filled infection focus or passage
– enhancing margin
– surrounding reaction of fatty tissue with edema and hypervascularization
 late findings:
– sclerosis (no signal on T1 and T2)
– fibrosis (low signal on T1 and T2)
– intraosseous cysts (fluid signal)
 (→ to detect foci)
Recommended Imaging Mode
 three-phase bone scan
 leukocyte nuclear medicine
Findings
 three-phase bone scan (especially for multiple infection foci):
– highly sensitive, days or weeks ahead of radiographic manifestation
– nonspecific: increase in bone resorption in various diseases
– hot-spot in all three phases
 leukocyte nuclear medicine:
– less sensitive for osseous infection than soft tissue infection
– more specific than three-phase skeletal nuclear medicine
Subacute Osteomyelitis, Brodie Abscess
Definition
Subacute osteomyelitis is a primary sub-acute infection of the bone. If a Brodie abscess is present, it manifests as an intraosseous, round abscess cavity with a tendency to form sinus tracts.
Clinical Signs
 symptoms are less severe than acute osteomyelitis, circumscribed morphological changes
 typical sign: Brodie abscess:
– predilection for tibial and distal femoral metaphyses
– peak incidence in childhood
Role of Imaging
 diagnosis of osteomyelitis
 demonstration of localization and pattern of involvement
 DD: bone tumors, osteoid osteoma, stress fracture
 detection of complications
 determination of progression or healing processes
Diagnostic Evaluation
 (→ method of choice)
Recommended Radiography Projections
 standard projections
Findings (Fig. 4.4)
 more varied picture than acute osteomyelitis
 osteolytic, destructive changes to cancellous and cortical bone
 cortical expansion (periosteal new bone formation)
 sclerosis
 sequestra
 architectural destruction of cancellous and cortical bone
 Brodie abscess:
– metaphyseal localization adjacent to epiphyseal plate
– relatively clearly bordered lucency in cancellous bone, central or subcortical
– faint surrounding sclerosis
– tortuous passage leading to the epiphyseal plate (diagnostic proof)
– faint periosteal reaction

Recommended Sequences
 coronal STIR
 coronal T1 SE
 contrast-enhanced T1 SE FS, coronal and sagittal
Findings
 more varied picture than acute osteomyelitis with signs of fibrosis and sclerosis
 cortical expansion due to periosteal new bone formation
 possible marked inflammatory soft tissue reactions
 Brodie abscess:
– metaphyseal, near epiphyseal plate infection focus with fluid signal
– demarcation of the infection focus with a double rim: inside contrast-enhancing abscess capsule, outside faint sclerosis (T2: low signal)
– surrounding bone marrow edema
– mild perifocal periosteal and soft tissue reaction with poorly defined contours
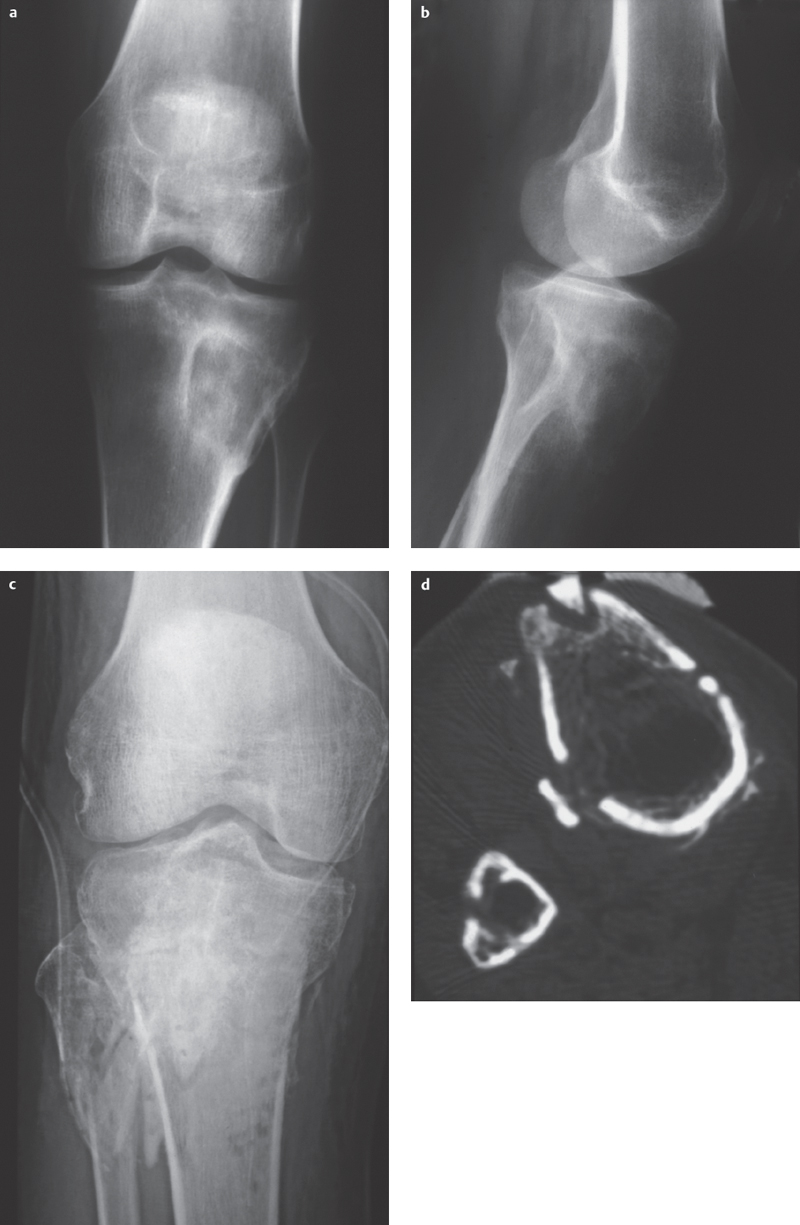
Fig. 4.4 a–d  Two forms of subacute osteomyelitis: Brodie abscess and sequestration with an open tibial plateau fracture, respectively.
a, b Brodie abscess: Eccentric osteolytic lesion in the proximal tibial metaphysis with destruction of the lateral cortical bone with sclerotic rim and periosteal reaction.
c Conventional X-ray imaging following tibial plateau fracture with local signs of infection shows a barely recognizable sclerotic bone fragment on a view of the tibial tuberosity.
d CT: confirmation of a sequestrum with osteolytic demarcation (courtesy of Prof. Dr. J. Maeurer, Munich).
Chronic and Chronic Recurrent Osteomyelitis
Definition
Chronic osteomyelitis (or chronic recurrent osteomyelitis) is a chronic infection of the bone that tends to be resistant to therapy and to have a relapsing course.
Clinical Signs
 secondary to acute endogenous or exogenous osteomyelitis
 frequent remission and relapse with acute signs of inflammation
 recurrent sinus tract formation
 induration of soft tissue structures after multiple inflammation episodes
Diagnostic Evaluation
 (→ method of choice)
Recommended Radiography Projections
 standard projections
 sinogram following the injection of a radiopaque medium
Findings
 Plain radiographs:
– sclerosing and osteolytic changes adjacent to one another
– solid and lamellar periosteal reactions (new appearance as a sign of reactivation)
– irregular cortical thickening due to periosteal and endosteal new bone formation
– absent trabecular architecture and strandlike transformation of the marrow cavity
– osteolytic defects of varying size (new appearance as a sign of reactivation)
– sequestrum: necrotic sclerotic bone in a region of lucency (sign of reactivation)
– possible bone deformity
 Sinogram:
– demonstration of foxholelike sinus tracts and abscess cavities in the soft tissues leading to osteolytic infection foci in the bone
Role of Imaging
 diagnosis of chronic osteomyelitis
 identify reactivation (previous films essential)
 demonstration of extent of intraosseous and soft tissue involvement
 DD: bone tumors
 detection of complications
 (→ to identify fluid collection in the soft tissues)
Recommended Imaging Planes
 depending on localized findings in two planes
Findings
 possible fluid accumulation in the soft tissues
 periosteal reaction (especially in children)

Recommended Sequences
 coronal STIR
 coronal T1 SE
 contrast-enhanced T1 SE FS, coronal and sagittal
Findings (Fig. 4.5)
 inflammatory changes to the bone marrow:
– bone marrow edema with partial fat signal loss (in contrast to tumor infiltration, which results in complete fat signal loss)
– irregular distribution, relatively circumscribed
 inflammatory periosteal and soft tissue changes:
– periosteal expansion, may be hypointense on all sequences (new bone formation) or moderately hypointense (fibrosis), sometimes T2 hyperintensity and T1 hypointensity with contrast enhancement (inflammatory tissue) or fluid signal (subperiosteal pus collection)
– edema and hypervascularization of adjacent fatty tissue, poorly defined and irregularly arranged
 cortical disruptions and coarse defects
 necrotic bone
 bone abscesses:
– central fluid, possible slight hyperintensity on T1 sequences (protein), no contrast enhancement
– marked contrast enhancement in surrounding abscess capsule
– pronounced peripheral low signal zone of fibrosis and sclerosis
 sclerosis (no signal on T1 and T2 sequences):
– cortical sclerosis
– periosteal new bone formation
– cancellous sclerosis
 intraosseous areas of fibrosis (low signal on T1 and T2 sequences)
 intraosseous cysts (fluid signal)
 soft tissue sinus tracts:
– fluid-filled infection focus or passage with marked contrast collection
– surrounding reaction of fatty tissue with edema and hypervascularization
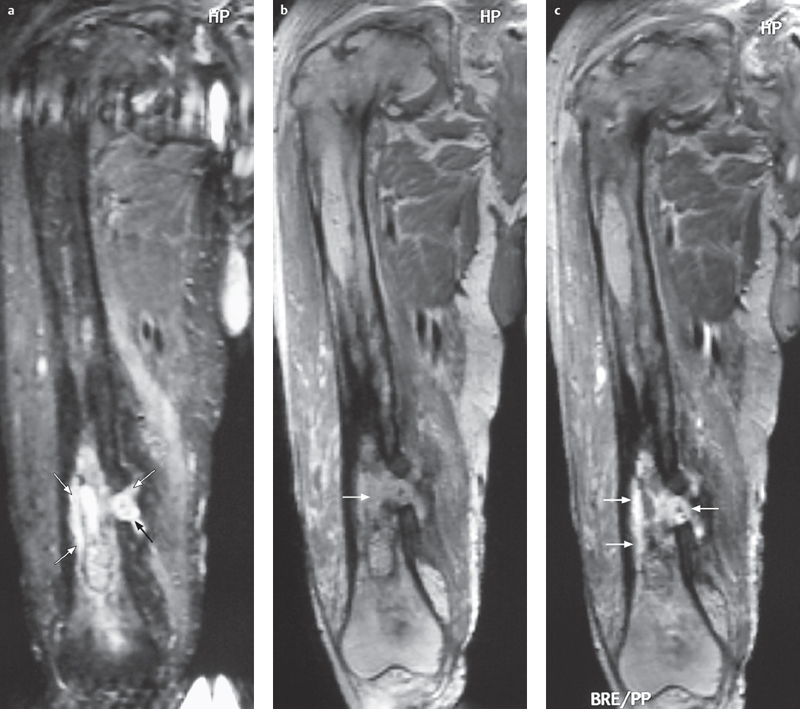
Fig. 4.5a–c  Chronic osteomyelitis.
a–c STIR, T1 SE, and contrast-enhanced T1 SE FS show a heterogeneous image with destruction of the cancellous architecture, cortical thickening, signs of sclerosis (hypointensity on all sequences), along with patchy zones of edema, fluid accumulation, and enhancing foci (arrows). Medially there is a cortical defect with sinus tracts in the soft tissues (arrows) (in: Breitenseher M. MR-Imaging Strategies for the Lower Extremities, Thieme 2005).
Sclerosing Osteomyelitis of Garré
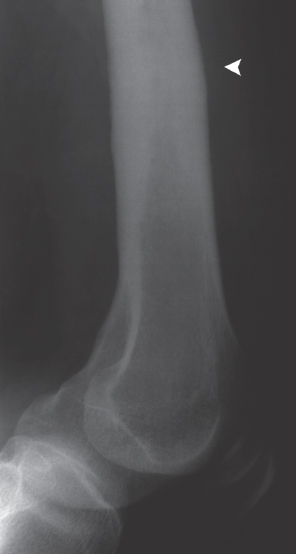
Fig. 4.6  Sclerosing osteomyelitis of Garré.
Endosteal and periosteal cortical thickening and sclerosis of the distal femoral metadiaphysis. No detection of osteolytic lucencies or sequestra.
Role of Imaging
 exclusion of DD (bone tumors, chronic purulent osteomyelitis)
 demonstration of localizations and disease activity and severity
Definition
Sclerosing osteomyelitis of Garré is a chronic, sterile osteomyelitis involving plasmacellular inflammation of bone and bone marrow. The infection develops into a noninflammatory hyperostotic osteosclerosis with oligofocal appearances. In recent years, it has been categorized as a late stage of chronic recurrent multifocal osteomyelitis (CRMO).
Clinical Signs
 patient history may include prior sepsis
 sites of predilection:
– clavicular, sternopelvic, sternofemoral
– metadiaphyses and diaphyses of the long bones (unlike childhood metaphyseal CRMO)
 possible pustular psoriasis
Diagnostic Evaluation
 (→ method of choice)
Recommended Radiography Projections
 standard projections
Findings (Fig. 4.6)
 metadiaphyseal or diaphyseal endosteal and cortical hyperostosis
 periostitis, subperiosteal new bone formation, periosteal hyperostosis
 no osteolytic lesions, no sequestra
Chronic Recurrent Multifocal Osteomyelitis (CRMO)
Definition
CRMO, a disease affiliated with SAPHO (synovitis, acne, pustulosis, hyperostosis, osteitis) syndrome, is a sterile, nonpurulent primary chronic multifocal osteomyelitis. It presumablyarises from an immunopathological reaction to bacteria found in pustular skin lesions, a view which is supported by its occurrence in association with psoriasis, acne, or palmoplantar pustulosis in 25% of cases among children and 50% among adults. The adjacent joint may demonstrate “sympathetic” arthritis.
Pathology
 aggressive lymphogranulocytic early phase
 long-lasting lymphoplasmacellular middle phase
 chronic sclerosing osteoblastic osteomyelitis (Garré)
Clinical Signs
 women are more often affected than men
 peak incidence at 12 years of age, range: two years to adulthood
 pain, limping, favoring
Diagnostic Evaluation

Recommended Radiography Projections
 standard projections
Findings (Fig. 4.7)
 may be silent in early stages
 primary infection: metaphyseal lytic focus adjacent to epiphyseal growth plate
 later development of faint, increasingly pronounced, and poorly defined sclerosis near the lysis, ultimately masking it
 effusion with “sympathetic” arthritis
 complications: possible growth disturbance
 (→ method of choice)
Stay updated, free articles. Join our Telegram channel

Full access? Get Clinical Tree


