Dementia and Degenerative Diseases
Norbert Schuff
Dementias, such as such as Alzheimer disease (AD), frontotemporal lobar degeneration (FTLD), and Lewy body dementia (LBD) as well as other forms of neurodegenerative diseases, including Parkinson disease (PD), are characterized pathologically by slowly progressive dysfunction and loss of neurons. For most neurodegenerative diseases, the cause is unknown and effective treatment is lacking, although a common neuropathology shared by many of these conditions is the malicious accumulation of misfolded protein aggregates within the brain.1
Clinically, a major problem is the lack of reliable biomarkers of these conditions, leaving patients without a definite diagnosis until brain autopsy. Most neurodegenerative diseases also lack characteristic lesions on conventional magnetic resonance imaging (MRI) that are readily identifiable by a radiologist’s eye. Accordingly, conventional MRI has been of limited diagnostic value for these conditions (except to rule out the presence of other brain pathologies, such as tumors and stroke). on the other hand, the importance of cerebral blood flow to maintain brain viability is well documented,2 and there is substantial evidence of abnormal brain perfusion in neurodegenerative diseases from radioactive labeled tracer studies using positron emission tomography (PET) or single-photon emission computed tomography (SPECT).3 It has also been hypothesized that physiologic and functional brain changes precede the development of structural changes.4 Accordingly, perfusion imaging in general holds great promise for detecting neurodegeneration at an early stage before major neuron loss. Furthermore, by mapping regional perfusion variations in the brain, which are usually tightly coupled to metabolic changes, researchers hope to learn more about the physiologic and functional underpinnings of these devastating conditions.
Arterial spin labeling (ASL) MRI, as described eloquently in other chapters in this book, has gained particular interest for studying brain perfusion in neurodegenerative disease, largely for reasons related to its complete noninvasiveness. ASL-MRI also has an edge over PET and SPECT studies owing to quicker examinations. The goal of this chapter is to provide an update of ASL-MRI findings in dementia and neurodegenerative diseases and to discuss the potential clinical application of this relatively new MRI modality. Other considerations, such as the added value of ASL-MRI for studies of neurodegenerative diseases, limitations, and pitfalls, will also be addressed.
Applications
Alzheimer Disease
AD is associated with progressive decline of cognitive functions, in particular memory, attention, and visuospatial orientation, resulting ultimately in dementia. AD is also by far the most frequent cause of age-related neurodegeneration, affecting about 20% of the population over 80 years old.5 Because people around the globe are living longer, the impact of the disease is expected to increase further with dire social and economical consequences for societies if no effective treatment is developed soon. There is also growing concern that once individuals show clinical symptoms of AD, it could be too late for effective treatment because neuronal damage could already be at an advanced stage. An early detection of the disease and a better understanding of the natural course of progression are therefore paramount for early interventions when treatment is likely most effective. In this context, perfusion imaging holds considerable promise as a sensitive marker of AD.
Several ASL-MRI studies have measures regional alterations in AD. In one of the first of these studies, Sandson et al.6 found AD patients had a significantly lower ASL signal in parietal and temporal lobe regions than cognitive normal elderly, implying the regions are hypoperfused. Later, Alsop et al.7 demonstrated that ASL-MRI captures a characteristic profile of regional hypoperfusion in AD that includes primarily the temporal, parietal, and posterior cingulate cortices. This profile also largely mirrors the pattern of hypoperfusion and hypometabolism seen in SPECT and PET studies. They also found that hypoperfusion becomes more prominent with increasing severity of AD symptoms, implying that ASL-MRI also captures the disease stage. Nevertheless, the interpretation of these initial ASL-MRI findings was not without problem, because potential variations of the ASL signal caused by structural alterations, such as brain atrophy and partial volume effects of gray
and white matter, were ignored. In particular, because AD is also associated with substantial cortical atrophy, the concern is that alterations of the ASL signal might simply be an artifact of underlying structural variations of the brain, thereby mimicking perfusion changes.
and white matter, were ignored. In particular, because AD is also associated with substantial cortical atrophy, the concern is that alterations of the ASL signal might simply be an artifact of underlying structural variations of the brain, thereby mimicking perfusion changes.
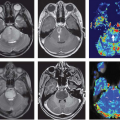
 FIGURE 71.1. Representative arterial spin labeling magnetic resonance imaging (ASL-MRI) perfusion maps from individuals with various neurodegenerative conditions: mild cognitive impairment (MCI), Alzheimer disease (AD), and behavioral variant of frontotemporal dementia (FTD). A perfusion map of a cognitively intact older subject (CN) is also shown for comparison. The white arrows point to brain regions that are typically hypoperfused in each of these brain conditions. The perfusion maps have been interpolated to the resolution of anatomical MRI for better anatomical clarity and are corrected for gray matter density. ASL-MRI data were acquired at 4T whole-body magnet (Bruker Biospec, Germany) using a pseudo-continuous ASL sequence as described in (Nezamzadeh M, Matson GB, Young K, et al. Improved pseudo-continuous arterial spin labeling for mapping brain perfusion. J Magn Reson Imaging. 2010;31:1419–1427.) |
In a subsequent ASL-MRI study, Johnson et al.8 addressed this issue by correcting ASL-MRI data for atrophy and partial volume variations. They showed hypoperfusion remained a prominent feature in AD after the corrections. In addition, Johnson et al. found hypoperfusion in AD is not limited to temporal and parietal brain regions but can extend into the frontal lobe. The disentanglement of regional variations in cerebral perfusion from underlying structural changes is important for a better understanding of the onset and progression of dementia, because structural and perfusion processes can differ in the temporal as well as spatial extent. Nevertheless, a major technical limitation of the ASL-MRI study by Johnson et al. was that prominent brain regions of AD pathology, especially the inferior and mesial temporal lobe with the hippocampus, were not sampled. Full brain coverage of perfusion measurements was accomplished subsequently by several ASL-MRI studies, which used improved ASL methodology and modern high magnetic field strength (3T) MRI systems.9,10,11 In particular, a study by Asllani et al.11 replicated previous ASL findings in AD and found systematic hypoperfusion in additional brain regions, including the superior temporal, parahippocampal, and fusiform gyri, as well as the thalamus, insula cortex, and hippocampus. Moreover, evaluating perfusion across brain regions simultaneously with a multivariate statistic, Asllani et al. were able to show that the perfusion differences between AD patients and control subjects are robust not only at the group level but also on a subject-by-subject basis. In a more recent ASL-MRI study, Hu et al.12 linked the profile of temporal and parietal hypoperfusion more firmly to AD pathology by replicating these ASL findings in patients with abnormal levels of the cerebrospinal fluid–based AD biomarkers, such as tau and β-amyloid.12
Representative ASL-MRI perfusion maps from individuals with various neurodegenerative diseases, including AD and other conditions discussed later in this chapter, are shown in Figure 71.1. The perfusion maps are interpolated to higher spatial resolution for better anatomical clarity and are corrected for gray matter density. In the case of the AD patient, hypoperfusion can clearly be seen bilaterally in the parietal cortex. For comparison, the perfusion map from a cognitively intact older subject is also shown in Figure 71.1.
Interestingly, several ASL-MRI studies found also increased perfusion in AD, involving the hippocampus,9 the anterior cingulate cortex,10 and other frontal lobe areas.12 Although the phenomenon of increased perfusion in AD has rarely been observed with other imaging modalities, the finding is not irreconcilable. Hyperperfusion is consistent with functional MRI data in AD that revealed increased brain activation in the mesial temporal lobe with advancing cognitive impairment.13 The observation that hyperperfusion and hypoperfusion coexist in AD has been interpreted as a compensatory response to local neuronal damage that leads elsewhere in the brain to increased neuronal activity, causing increased perfusion.9 Hu et al.12 argued that another potential mechanism for cortical hyperperfusion is diminished neuronal inhibition secondary to partial deafferentation of the cortex owing to degraded white matter projections. Nevertheless, observations of hyperperfusion in AD are not entirely consistent across ASL-MRI studies. Although one study reported hyperperfusion in the hippocampus9 without alterations in the frontal cortex, other studies found hyperperfusion in frontal cortex but without changes in the hippocampus.10,12
The coexistence of hypo- and hyperperfusion in AD is also interesting from the perspective of cause and effect of perfusion changes. It is generally thought that hypoperfusion is a consequence of reduced energy demand of the brain due to diminished brain function.14 Likewise, hyperperfusion might indicate compensatory neuronal hyperactivity.9,12 An alternative view is that perfusion alterations in AD might reflect cerebrovascular aberrations. From this perspective, brain activity is curtailed by
limited blood supply, while the reverse that hyperactivity results from too much blood supply is not expected.
limited blood supply, while the reverse that hyperactivity results from too much blood supply is not expected.
It should be noted that ASL measurements can be confounded by perfusion dynamic, which is not yet fully understood in AD. To explore whether ASL-MRI studies in AD are biased by dynamics aspects, especially variations in blood volume and bolus transit time (pulsed ASL should be more affected than continuous ASL), Yoshiura et al.15 studied cerebral blood flow in AD patients and control subjects using ASL-MRI with variable postlabeling delay times. They found neither blood volume nor transit time of the spin labels differed significantly between the groups, despite substantial hypoperfusion in AD patients. Yoshiura et al. concluded that ASL-MRI findings of hyperperfusion in AD are unlikely an artifact of perfusion dynamics. Nevertheless, in another ASL-MRI study, Liu et al.16 cautioned to ignore variations in transit time in general. Adapting a dual-compartment, distributed perfusion model for ASL, Liu et al. found an age-related increase in regional blood circulation, reflected by longer transit delays of the spin labels through small arterioles, aside from cerebral blood flow reductions. According to these results, variations in blood circulation can bias ASL measurements. on the other hand, ASL techniques designed to eliminate or compensate for spin-transit effects might miss potentially important information, although it is recognized that measuring the hemodynamic can be very time-consuming with ASL-MRI.
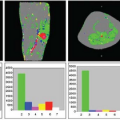
 FIGURE 71.2. Results of a quantitative comparison between the distributions of Alzheimer disease–related hypoperfusion (using arterial spin labeling magnetic resonance imaging) and hypometabolism (using fluorodeoxyglucose positron emission tomography) from a group analysis of Alzheimer disease patients versus control subject. Shown in red are regions of significant gray matter atrophy (A), hypoperfusion (B), and hypometabolism (C) rendered on a three-dimensional brain. (D–F) Shows representative slices of each feature with a color bar representing the t statistic. (G) Areas of significant overlap between hypoperfusion and hypometabolism. CBF, cerebral blood flow; CMRGic, cerebral metabolic rate of glucose. (Reproduced with permission from Chen Y, Wolk DA, Reddin JS, et al. Voxel-level comparison of arterial spin-labeled perfusion MRI and FDG-PET in Alzheimer disease. Neurology. 2011;77:1977–1985.) |
Direct comparisons between fluorodeoxyglucose (FDG) PET, the gold standard of functional imaging, and ASL-MRI in AD have recently been reported.17 Both imaging modalities revealed similar regional abnormalities in AD. Moreover, FDG-PET and ASL-MRI were similarly effective in separating AD patients from cognitively normal elderly based on reading scores by radiology experts. Remarkably, a quantitative voxel-by-voxel comparison between ASL-MRI and FDG-PET data showed substantial overlap between regions of hypoperfusion and
hypometabolism.18 Results of a quantitative ASL-MRI to FDG-PET comparison are presented in Figure 71.2, showing in red significant patterns of gray matter atrophy (Fig. 71.2A), hypoperfusion (Fig. 71.2B), and hypometabolism (Fig. 71.2C) rendered on a three-dimensional brain. Figure 71.2D–F show representative slices for each pattern with a color bar representing the t statistic. Regions of significant overlap between hypoperfusion and hypometabolism are shown in Figure 71.2G. The excellent match between ASL-MRI and FDG-PET implies that cerebral blood flow and metabolism remain tightly coupled in AD. This also suggests that hypoperfusion in AD is more likely the result of diminished demand than reduced blood supply. Although these findings are promising and further support the use of ASL-MRI in dementia diagnosis, more studies involving larger patient populations are required before the full clinical potential of ASL-MRI can be determined.
hypometabolism.18 Results of a quantitative ASL-MRI to FDG-PET comparison are presented in Figure 71.2, showing in red significant patterns of gray matter atrophy (Fig. 71.2A), hypoperfusion (Fig. 71.2B), and hypometabolism (Fig. 71.2C) rendered on a three-dimensional brain. Figure 71.2D–F show representative slices for each pattern with a color bar representing the t statistic. Regions of significant overlap between hypoperfusion and hypometabolism are shown in Figure 71.2G. The excellent match between ASL-MRI and FDG-PET implies that cerebral blood flow and metabolism remain tightly coupled in AD. This also suggests that hypoperfusion in AD is more likely the result of diminished demand than reduced blood supply. Although these findings are promising and further support the use of ASL-MRI in dementia diagnosis, more studies involving larger patient populations are required before the full clinical potential of ASL-MRI can be determined.
Related posts:
 Dose Considerations in CT Perfusion
 Confounding Effects in Arterial Spin Labeling
 Arterial Spin Labeling Acquisition Protocols
 Pediatric Stroke and Congenital Disease
 Clinical Applications of Dynamic Contrast-Enhanced Magnetic Resonance Imaging in Musculoskeletal Tumors
 Cerebral Perfusion Studies in Substance Abuse and Dependence
Stay updated, free articles. Join our Telegram channel

Full access? Get Clinical Tree


