Fig. 24.1
Coronal oblique (perpendicular to the axis of the hippocampus) T1-weighted MRI (top row) and CT (bottom row) of the same patient demonstrating different degrees of medial temporal lobe atrophy (MTA) according to the Scheltens rating scale. (a) Grade 1 on both sides, (b) grade 2 on both sides, (c) grade 2 on both sides, and (d) grade 3 on the right side and grade 4 on the left side. Note that visual rating of the hippocampus also can be easily performed on CT (Modified from Wattjes et al. 2009 and reprinted with permission from the Radiological Society of North America)
CT has been traditionally used as a screening method to exclude possible treatable causes of dementia. However, the benefit of CT goes far beyond this. Using spiral CT with adequate MPR, global cortical atrophy (GCA) as well as medial temporal lobe atrophy (MTA) can be assessed and quantified according to visual rating scales. Compared to MRI, rating of GCA and MTA on CT shows similar results with a high inter-rater and inter-modality agreement (Figs. 24.1 and 24.2). The sensitivity of CT in the detection of vascular changes in terms of small-vessel disease is lower than MRI. However, clinically relevant vascular pathology (starting confluent and confluent white matter changes, large-vessel disease) which might lead to the diagnosis of vascular dementia (VaD) can also sensitively be detected on CT (Fig. 24.3). In addition, distinct focal atrophy patterns supporting the clinical diagnosis of certain neurodegenerative diseases associated with dementia can easily be detected by CT (Fig. 24.4) (Wattjes et al. 2009).
Fig. 24.2
Axial FLAIR MRI (top row) and CT (bottom row) obtained from the same patient demonstrating different degrees of global cortical atrophy according to the Pasquier scale. Left, grade 0; middle, grade 1; and right, grade 2 (Reprinted from Wattjes et al. 2009 with permission from the Radiological Society of North America)
Fig. 24.3
Axial FLAIR MRI (top row) and CT (bottom row) from the same patient demonstrating different degrees of white matter pathology assessed according to the Fazekas scale. Left, grade 1 (punctiform lesions); middle, grade 2 (early confluent lesions); and right, confluent lesions. Small punctiform lesion can be missed on CT. Clinically relevant early confluent and confluent vascular white matter lesions also can be detected on CT images (Reprinted from Wattjes et al. 2009 with permission from the Radiological Society of North America)
Fig. 24.4
Examples of focal atrophy patterns in patients presenting with cognitive decline can be easily seen on CT. Top row: oblique coronal CT (left) and T1-weighted MRI (right) of a patient presenting with a right temporal variant of frontal temporal lobe degeneration with asymmetric atrophy of the right temporal lobe, (arrow) including the medial temporal lobe structures. Bottom row: axial FLAIR MRIs (left) and CT image of a patient presenting with severe cerebellar atrophy. The focal atrophy pattern in the posterior fossa can also be identified on CT images (arrow) (Modified from Wattjes et al. 2009 and reprinted with permission from the Radiological Society of North America)
24.2.2 Magnetic Resonance Imaging
MRI is the most important and most frequently used imaging modality in memory clinic patients. It has several relevant advantages over CT such as the lack of radiation, higher spatial resolution, superior white matter/gray matter contrast, and the ability to improve tissue contrast by choosing different pulse sequences. MRI in dementia is performed as a multi-sequence protocol including T1-weighted, T2-weighted, fluid-attenuated inversion recovery (FLAIR), and diffusion-weighted images (DWI) (Table 24.1, Fig. 24.5). Assessment of the medial temporal lobe structures should be performed on the oblique coronal T1-weighted images perpendicular to the axis of the hippocampus. FLAIR sequences (preferably 3-D acquisition) are well suited for the rating of cortical atrophy (globally or focally) and vascular white matter pathology. However, the conventional T2-weighted turbo (fast) spin echo is still mandatory since this sequence shows a higher sensitivity in the detection of vascular pathology in the posterior fossa and in deep gray matter structures, particularly in the thalamus (Bastos-Leite et al. 2004) (Fig. 24.6). T2-weighted gradient echo (GE) or alternatively susceptibility-weighted imaging (SWI) is suited for sensitive detection of cerebral microbleeds (MBs), superficial siderosis, or macrohemorrhages. DWI is particularly helpful in the detection of acute and early subacute infarctions but also in supporting the diagnosis of certain inflammatory diseases such as prion diseases or herpes encephalitis.
Table 24.1
Example of a multi-sequence MRI protocol for patients presenting to a memory clinic
Coronal T1 (preferably 3-D ) | Assessment of the medial temporal lobe on oblique coronal reconstructions perpendicular to the axis of the hippocampus |
Axial FLAIR (preferably 3-D) | Assessment of vascular white matter changes, global and focal cortical atrophy, inflammation |
Axial T2 (T)SE | Assessment of vascular changes in deep gray matter structures (e.g., thalamus lesions) |
Axial T2* GE or SWI | Detection of MBs, superficial siderosis, macrohemorrhages, iron accumulation |
Axial DWI | Detection of areas with restricted diffusion (e.g., acute stroke, Creutzfeldt-Jakob disease, herpes encephalitis) |
Fig. 24.5
Figure summarizing the roles of different pulse sequences in a multi-sequence MRI protocol for the diagnostic work-up of patients presenting to a memory clinic. The oblique T1-weighted images (a) are well suited for the evaluation of the medial temporal lobe structures; (arrows) the axial FLAIR (b) images are the most sensitive sequence for the detection of white matter vascular pathology (arrows) but are also suited for visual rating of global cortical atrophy. Conventional T2-weighted images (c) are still necessary for the detection of white matter lesions in the thalamus such as lacunar infarcts (arrows). T2-gradient echo or susceptibility-weighted images (d) are highly sensitive for detection of MBs (arrows)
Fig. 24.6
Different sensitivities of FLAIR and conventional T2-weighted sequences in the detection of vascular changes in the thalamus such as thalamus lacunes. Axial T2-weighted (left) and FLAIR (right) MRI of a patient presenting with VaD. A lacunar infarct in the left thalamus is easily depicted on the T2-weighted but not on the FLAIR MR image (arrow)
Advanced MRI techniques such as diffusion tensor imaging, perfusion MRI, and MR spectroscopy are not used in the clinical routine setting. However, some of them can further aid in the diagnosis of dementia.
Arterial spin labeling is a modern perfusion MRI technique that does not require any exogenous contrast media. The perfusion values (regional cerebral blood flow) correlate well with perfusion SPECT and FDG-PET (Yoshiura et al. 2009) (Fig. 24.7). MR spectroscopy allows in-vivo assessment and quantification of metabolites in the brain tissue. In dementia patients, neurodegenerative changes with decreased concentrations of N-acetylaspartate indicating neuronal damage and/or loss and an increase of (myo)inositol concentrations indicating increased glial cell activity can be observed. In AD patients for instance, these metabolic changes can be observed particularly in the parieto-occipital regions (e.g., posterior cingulate). A neurodegenerative metabolite profile can be found in the basal ganglia. However, these findings are not specific for a certain disease entity, limiting their use in a memory clinic setting (Firbank et al. 2002).
Fig. 24.7
Axial arterial spin-labeled perfusion maps of the cerebral blood flow in a healthy control subject and an AD patient. Note the global cortical hypoperfusion of the entire neocortex particularly involving the parietal regions in the AD patient when compared to the healthy control subject (Figure kindly provided by Dr. Maja Binnenwijzend, Alzheimer Center Amsterdam)
24.2.3 Positron Emission Tomography and Single-Photon Emission Computed Tomography
PET and SPECT imaging are increasingly being used in a memory clinic setting and have substantial added value in the early diagnosis of cognitive decline.
FDG-PET is a well-established method for the assessment of brain metabolism. The uptake of FDG into the brain corresponds proportionally to the cerebral glucose metabolism, and the glucose metabolism correlates well with the neuronal function. As a consequence, a decline in neuronal function results in a reduction of glucose metabolism and therefore reduced FDG uptake. In dementia patients, regional differences in FDG uptake among different disease entities can be observed and are of special value in the diagnosis of dementia in an early disease stage (e.g., differentiation between AD and FTD) (Figs. 24.8 and 24.9).
Fig. 24.8
Coronal FDG-PET images of a healthy control subject (left) and FTD patient (right) demonstrating the pattern of hypometabolism in FTD patients involving in the frontal (arrows) and temporal areas (Figure kindly provided by Dr. Rik Ossenkoppele, Alzheimer Center Amsterdam)
Fig. 24.9
FDG-PET (upper row) and amyloid PET using PiB (bottom row) of AD patients. On FDG-PET hypometabolism of the parietal cortex, particularly in the posterior cortex and precuneus (arrows). The amyloid binding of PiB is most obvious in the frontal lobes and the parietal cortical areas (arrows)
Results similar to those obtained with FDG-PET can be obtained with perfusion SPECT. The most established tracers for these purposes are 99mTc-hexamethyl propylene amine oxime and 99mTc-cysteinate dimer. After intravenous administration of these tracers, the distribution corresponds well with the regional cerebral blood flow. Areas of decreased blood flow in dementia patients (e.g., AD) are strongly correlated with areas of hypometabolism (Devous 2002).
Amyloid PET imaging allows the specific detection of amyloid deposition in the brain. Several tracers binding to amyloid have been developed. The most established and investigated is 11C-PiB (“Pittsburgh Compound-B”) binding to fibrillar amyloid-β. Nonspecific binding of 11C-PiB can be observed in the white matter. In AD patients, the cortical binding of 11C-PiB shows a distribution pattern that reflects the amyloid-β deposition pattern on histopathology (Fig. 24.9). 11C-PiB retention in the brain is not specific to AD and can also be observed in DLB and CAA patients as well as in a substantial proportion of healthy elderly persons who are not cognitively impaired.
The relatively short physical half-life (20 min) of 11C requires an on-site cyclotron. Therefore, several 18F-labeled tracers (physical half-life of 110 min) binding to amyloid have been developed and are currently under investigation in clinical trials. 18F-amyloid tracers show similar retention patterns in AD with the exception of 18F-FDDNP 2-(1-{6-[(2-[fluorine-18]fluoroethyl) (methyl)amino]-2-naphthyl}-ethylidene) malononitrile) which shows a high retention of the tracer in the medial temporal lobe structures (Villemagne and Rowe 2011; Tolboom et al. 2010).
Another important application of functional imaging with SPECT is “dopaminergic imaging.” Several SPECT tracers have been introduced to assess the dopaminergic neurotransmission. [123I]FB-CIT-SPECT (I123-radiolabelled 2-carbomethoxy-3-(4-iodophenyl)-N-(3fluoropropyl) nortropane) and DaTSCAN (123I-ioflupane) focusing on the presynaptic dopamine transporter are the most established tracers for these purposes and are very helpful in the diagnosis of dementia associated with extrapyramidal parkinsonian symptoms (Walker and Rodda 2011).
24.3 Image Analysis of Structural Neuroimaging
CT and MRI scans in a memory clinic setting should be analyzed in a fast, structured, and reproducible way. For the assessment of cortical atrophy, MTA, and vascular pathology, visual rating scales have been established. Several studies have conclusively demonstrated their robustness in terms of reproducibility, inter-rater agreement, and their good correlation with more sophisticated volumetric measurements and histopathology. Table 24.2 gives an overview of the most established visual ration scales for cortical atrophy, MTA, and vascular changes.
Table 24.2
Overview of the most established visual rating scales for the assessment of cortical atrophy, hippocampal atrophy (medial temporal lobe atrophy, MTA), and white matter hyperintensities (WMH)
Cortical atrophy Pasquier scale | MTA Scheltens scale | WMH | ||
|---|---|---|---|---|
Fazekas scale | Fazekas scale | |||
Deep white matter | Periventricular white matter | |||
Grade 0 | Normal | Normal | No lesions | No lesions |
Grade 1 | Widened sulci | ʿ Width choroid fissure | Punctiform lesions | Lesions <5 mm |
Grade 2 | Widened sulci, volume loss of the gyri | ʿ Width of the choroid fissure, ʿ Width of the temporal horn | Partially confluent lesions | Lesions >5 mm |
Grade 3 | Knife blade atrophy | ʿ Width of the choroid fissure, ʿ Width of the temporal horn, ʿ Volume loss hippocampus | Confluent lesions | |
Grade 4 | – | ʿ Width of the choroid fissure, ʿ Width of the temporal horn, ʿ Volume loss hippocampus | – | |
24.3.1 Cortical Atrophy
The most established visual rating scale for cortical atrophy is the Pasquier scale (Pasquier et al. 1996) which is a four-point (0–3) scale considering the width of the sulci and the volume of the gyri (Fig. 24.2). Cortical atrophy can be either rated globally (global cortical atrophy) or regionally for different anatomic regions (e.g., separate scores for each lobe). For the visual assessment of the posterior brain regions which are of special interest in the diagnosis of AD, a specially developed four-point (0–3) rating scale has been introduced that considers certain anatomical landmarks of the posterior brain region such as the posterior cingulate and parieto-occipital sulcus as well as the precuneus and parietal cortex (Fig. 24.10). First studies using this rating scale have conclusively demonstrated its diagnostic value particularly in terms of differentiating AD patients from other types of dementia (Koedam et al. 2011; Lehmann et al. 2012).
Fig. 24.10
Sagittal (left) and coronal (right) T1-weighted and axial FLAIR (middle) MRIs of four patients illustrating different degrees of posterior cortical atrophy. Important anatomic landmarks are the cingulate sulcus (PCS), parieto-occipital sulcus (POS), the precuneus (PRE), and the parietal cortex (PAR). (a) Grade 0, (b) grade 1, (c) grade 2, and (d) grade 3
24.3.2 Medial Temporal Lobe Atrophy
Since the anatomical structures and landmarks in the medial temporal lobe, particularly the hippocampus, are rather small and show a complex interaction, visual rating of MTA is more complex and requires sufficient training. The most established MTA rating scale is the five-point Scheltens scale based on the width of the choroid fissure, temporal horn, and the volume/height of the hippocampus (Table 24.2, Fig. 24.1) (Scheltens et al. 1992). In more advanced atrophy stages, consideration of adjacent anatomical structures (e.g., collateral sulcus) can further help stage the MTA. This scale allows a fast and reproducible assessment of MTA correlating well with volumetric measurements and histopathology. It is currently widely used in the clinical routine setting as well as for clinical trials.
24.3.3 Vascular Pathology
In addition to neurodegenerative changes, the detection and classification of vascular pathology is crucial in patients with cognitive decline. This is of particular interest in patients with a clinical presentation suggestive of VaD since vascular pathology detected by neuroimaging has been incorporated by the NINDS-AIREN criteria for VaD (van Straaten et al. 2004; Román et al. 1993). However, there is also increasing evidence that vascular pathology acts in a synergistic way with neurodegenerative pathology, having relevant implications on clinical outcome measures (Scheltens et al. 1995; Inzitari et al. 2009). White matter vascular pathology can be most sensitively detected on FLAIR sequences. The so-called white matter hyperintensities (WMH) located in the deep white matter and periventricular white matter are markers of small-vessel disease that can be easily classified according to the Fazekas scale (Table 24.2, Fig. 24.3) (Fazekas et al. 1987). This scale is rather rough but robust and easily applicable, showing a high reproducibility and a good correlation with more in-depth rating scales and histopathology (Scheltens et al. 1998).
Another manifestation of small-vessel disease on CT and MRI that has been included into the NINDS-AIREN criteria for VaD is the presence of lacunar infarcts (lacunes). Lacunes are small end-artery infarcts accounting for 15–25 % of all strokes. Depending on the anatomic location, they can present as a silent infarct or cause focal neurological deficits (e.g., hemiparesis). On MRI and CT, old lacunar infarcts are focal areas of tissue loss sometimes with surrounding gliosis and hemosiderin deposits. Lacunes in the deep white matter can be sensitively detected on FLAIR images. In the basal ganglia and thalamus, lacunes are better visible on T2-weighted sequences (Figs. 24.5 and 24.6).
The detection of large-vessel disease manifestations such as territorial and watershed infarcts is also of major importance particularly when strategic brain areas (e.g., dominant hemisphere) are affected, which also is one of the key criteria of the NINDS-AIREN criteria for VaD.
24.3.4 Macrohemorrhage and Cerebral Microbleeds
The assessment of hemorrhagic brain lesions should include detection of primary intracranial hemorrhage as a possible treatable cause of dementia (e.g., due to hypertension) and secondary hemorrhagic lesions like trauma-induced hemorrhage.
MBs are increasingly gaining importance in the diagnostic work-up of patients with cognitive impairment. They are defined as small “dot-like” hypointense brain lesions on T2-weighted GE or susceptibility-weighted images. Histopathologically, MBs include storage of hemosiderin deposits in surrounding macrophages. Concerning the underlying pathophysiological concept, there are two main different types of MBs.
The first type of MB is based on amyloid depositions (amyloid-β 40 and amyloid-β 42) in the vessel wall, presumably inducing an inflammatory reaction, leading to increased permeability and leakage of blood products into the brain parenchyma, in addition to increased vessel wall stiffness and reduced vasoreactivity. Most of the amyloid-related MBs are located in the cortical gray matter or in the border zone between the cortical gray matter and white matter, hence the term lobar MBs (Fig. 24.11). Lobar MBs are associated with cerebral amyloid angiopathy (CAA) and strongly related to AD pathology. The second type of MB is not amyloid related and is probably based on chronic vasculopathy as seen in chronic hypertension leading to degenerative processes in the vessel wall and leakage of blood products into the brain tissue. These MBs are located in deep brain structures such as the basal ganglia, deep white matter, and the posterior fossa and are referred to as non-lobar MBs (Fig. 24.11). The coincidental occurrence of both types of MBs on MRI is frequently observed in different types of dementia such as AD and VaD (Cordonnier and van der Flier 2011).
Fig. 24.11
Axial susceptibility-weighted MRI demonstrating different types of MBs. Left: multiple non-lobar MBs located in deep brain structures such as the basal ganglia in a patient presenting with VaD. These MBs are linked to cardiovascular diseases (e.g., chronic hypertension). Middle: multiple lobar MBs located in the white matter/gray matter interface which are linked to CAA. Right: superficial siderosis (closed-head arrows) also associated with CAA in combination with lobar MBs (open-head arrow)
Since the MRI detection of MBs is based on susceptibility effects of blood degradation products (hemosiderin), sensitivity in the detection of MBs and therefore the prevalence of MBs depend on several imaging parameters such as pulse sequence, magnetic field strength, and spatial resolution. Using scanning parameters optimized for MB detection, in a healthy population, the prevalence of MBs is almost 25 % (Poels et al. 2011). In a memory clinic population, the overall prevalence of MBs is about 17 % and varies from 10 % in patients with subjective memory complaints and 18–20 % in AD patients to 65 % in patients with VaD (Cordonnier et al. 2006). MBs have clinical relevance in terms of other paraclinical biomarkers and clinical outcome measures. They are associated with vascular risk factors (hypertension most consistently), cognitive performance, age, mortality, apolipoprotein E genotype, and cerebrospinal fluid biomarkers (amyloid-β 40). In addition, they are associated with imaging findings of small-vessel diseases such as WMH and lacunar infarcts (Goos et al. 2009, 2010). There is also emerging evidence that lobar MBs might have some prognostic value for predicting AD, but there is still no way to predict VaD (Kirsch et al. 2009). MBs regardless of location, however, were found to predict progression of mild cognitive impairment patients to non-AD dementia (Staekenburg et al. 2009).
Amyloid-associated leakage of blood vessels can also occur in leptomeningeal vessels leading to hemosiderin deposition in the (sub)pial space, which has been termed superficial siderosis. Basically, superficial siderosis is a manifestation of leptomeningeal MBs. However, the imaging findings are completely different from classical MBs in the brain tissue. On T2-weighted GE and susceptibility-weighted MRI, superficial siderosis presents with a curve-like hypointense signal in the (sub)pial space covering the surface (gyri) of the brain (Fig. 24.11). From a pathophysiological point of view, superficial siderosis is related to CAA and corresponds to amyloid-related macrohemorrhage and MBs in the brain (Linn et al. 2010). The pathophysiogical similarities are reflected by a high coincidence of superficial siderosis and MBs. However, compared to MBs, the prevalence of superficial siderosis is quite low and is about 1 % in a normal healthy population (Vernooij et al. 2009). There is limited data available regarding the clinical and prognostic role of superficial siderosis as an imaging marker in a memory clinic population.
24.3.5 Serial Imaging
There are different purposes of serial imaging in a memory clinic setting such as establishing the diagnosis as well as disease and treatment monitoring.
The added value of serial imaging to establish the diagnosis of a specific underlying disease entity is still a matter of debate. If the diagnosis is fairly certain based on the clinical presentation, CSF biomarkers, and imaging findings, serial imaging does not have anything to offer. If the clinical diagnosis is unclear and the imaging findings are inconclusive, serial imaging might be helpful in establishing a definite diagnosis during follow-up. Given the fact that FDG-PET and amyloid PET are more sensitive than structural MRI or CT particularly in primary neurodegenerative disorders associated with dementia, these advanced imaging methods are likely to have more added value in establishing the diagnosis during follow-up.
Monitoring of disease progression can be of substantial clinical relevance particularly for the assessment of progressive white matter changes, in which it might lead to the diagnosis of VaD during follow-up and is likely to have clinical impact in terms of clinical outcome measures (Gouw et al. 2008; Inzitari et al. 2009). Progression of neurodegeneration can be monitored by measuring cortical atrophy and MTA either by visual rating or volumetric measurements (Figs. 24.12 and 24.15).
Fig. 24.12
Axial FLAIR (top row) MRIs of a patient presenting with “mixed dementia.” Note that between 2007 and 2010, progression of the white matter damage (arrows) as well as progression of the global cortical atrophy occurred with an increase widening of the sulci. Coronal T1-weighted MRI of a patient who was presented to the memory clinic in 2007 with mild cognitive impairment not fulfilling the criteria for dementia. During the 3 years, the mild MTA increased dramatically (arrows) and the patient clinically converted to AD. Note also the increased global cortical atrophy with progressive widening of the sulci and ventricles as well as volume loss of the gyri
For treatment monitoring, progression of vascular damage, and neurodegeneration, serial imaging is also important. However, for vaccination therapy in AD, the role of serial MRI includes also important safety findings including the early detection of treatment-induced inflammation, vasogenic edema, and (micro)hemorrhage. Results from serial amyloid imaging using 11C-PiB during amyloid-vaccination therapy trials have been reported (Rinne et al. 2010). However, serial amyloid-imaging documenting increase or decrease of amyloid burden in AD patients is not yet performed in a clinical routine setting.
24.4 Normal Aging and Neurodegenerative Diseases Presenting with Dementia
24.4.1 Normal Aging
Similar to other organs, the brain goes through stages of development during lifetime, particularly at later ages. In general, aging of the brain can be subdivided into three major categories:
1.
Successful aging (normal appearing of the brain on imaging, without clinical deficits)
2.
Normal aging (abnormalities on brain imaging without clinical deficits)
3.
Pathological aging (associated with pathological and clinical changes discussed below)
The global brain volume decreases slowly by about 0.1–0.2 % per year from the second decade of life until the age of 60–70, which accelerates during the following years with a loss of 0.3–0.5 % per year. Age-related global brain atrophy is mainly based on cortical thinning and white matter loss, and shows regional differences. The medial temporal lobe is relatively spared in the early normal aging process. Similar to global atrophy, MTA variably accelerates after age 70. Therefore, in people younger than 70 years, a visual MTA score of 1 is considered as normal. In geriatric populations, even an MTA score of 2 can be considered normal aging related. Small cavities within the hippocampus (e.g., cysts) are frequently observed in normal brains of elderly persons and are not associated with neurodegenerative pathology (Bastos-Leite et al. 2006). Slight enlargement of perivascular (Virchow-Robin) spaces can be observed in normal aging brains particularly at the cortical gray matter-white matter interface close to the vertex. Extensive pathologic enlargement of perivascular spaces frequently observed in the basal ganglia (e.g., “état criblé”) is associated with vascular pathology and neurodegeneration and is not a normal aging phenomenon (Zhu et al. 2010; Chen et al. 2011). The formation of WMH is a frequent finding in normal aging brains and represents focal areas of hypoxic demyelination due to hypoperfusion/incomplete infarction. Punctiform WMH do not have clinical relevance in terms of cognitive clinical outcome measures and are considered a normal aging phenomenon. However, rapidly progressive and confluent WMH have to be considered as signs of pathological aging presumably associated with underlying cardiovascular risk comorbidity. Although MBs are associated with vascular pathology detected on MRI, they may also be found in normal aging persons (see above).
Another feature of the normal aging brain is neuronal iron accumulation (intraneuronal ferritin). This involves most notably the basal ganglia region particularly the globus pallidus but also the striatum, subthalamic nucleus, substantia nigra, and the dentate nucleus of the cerebellum. The brain iron accumulation usually starts in the globus pallidus, substantia nigra, dentate nucleus, and to a lesser extent in the putamen, caudate nucleus, thalamus, and cortical gray matter. Brain iron can be detected as hypointensities on T2-weighted MRI. Using higher magnetic field strengths and dedicated pulse sequences (e.g., susceptibility-weighted imaging) paramagnetic brain iron can be sensitively differentiated from diamagnetic substances such as calcifications. Extensive (pathological) iron deposition which can be observed in primary neurodegenerative diseases associated with dementia, however, can induce oxidative stress and increase the concentration of free oxygen radicals and neurotoxicity.
In addition to findings on structural neuroimaging, complex metabolic, microstructural, and functional changes occur in normal aging brains which can be measured by 1H-MR spectroscopy, magnetization transfer MRI, as well as perfusion and functional MRI (Barkhof et al. 2011). It is worth noting that 25–35 % of normal healthy persons show cortical amyloid deposition particularly located in the frontal and posterior (posterior cingulate, precuneus) cortical areas detected on 11C-PiB amyloid PET. This is in accordance with histopathological postmortem studies showing amyloid-β plaques in approximately 30 % of healthy controls. Since the clinical relevance of these amyloid depositions is not completely understood, this should not be considered as a normal aging phenomenon. In healthy controls with discrete cognitive symptoms, positive amyloid PET has a predictive value in terms of further cognitive decline. This supports the theory that amyloid depositions precede clinical symptoms in terms of cognitive decline by many years. On the other hand, absence of amyloid depositions based on amyloid PET makes development of AD in healthy persons unlikely.
24.4.2 Alzheimer’s Disease
AD is the most common neurodegenerative disease associated with dementia in elderly. Histopathologically, AD is characterized by amyloid-β and hyperphosphorylated tau accumulation (McKhann et al. 1984). Despite the fact that AD is primarily a clinical diagnosis, the role of neuroimaging in supporting the clinical diagnosis of AD is becoming increasingly important. This is corroborated by the new diagnostic criteria for AD in which structural neuroimaging findings (MTA) as well as PET findings (temporoparietal hypometabolism on FDG-PET, amyloid deposition on amyloid PET) have been incorporated (Dubois et al. 2007).
According to the neuropathological stages of AD pathology described by Braak and Braak (1991), atrophy of the medial temporal lobe, in particular affecting the hippocampus and best seen on oblique coronal T1-weighted MRI, is one of the first signs of neurodegeneration in senile (late-onset) AD patients (Figs. 24.13 and 24.14). Visual rating of the MTA allows a robust and reproducible assessment of the degree of atrophy and can help to distinguish AD patients from those without cognitive complaints with sensitivity and specificity values of 80–85 % (Frisoni et al. 2010).
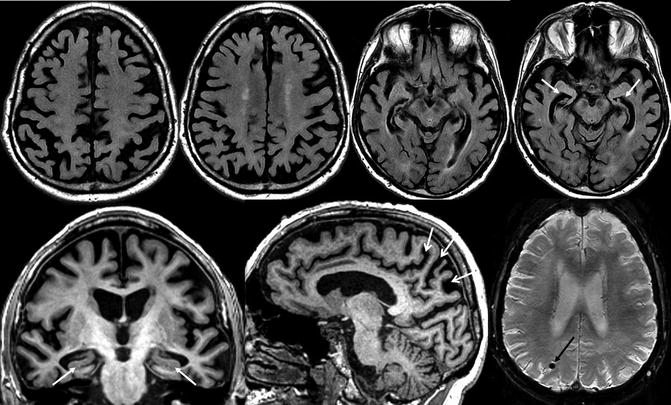
Fig. 24.13
Classical structural neuroimaging findings in a patient with late-onset Alzheimer’s disease. Top row: axial FLAIR MRI. Bottom row: oblique coronal (left) and sagittal (middle) T1-weighted and susceptibility-weighted (right) MRI. Substantial global cortical atrophy and coincidental white matter changes can be assessed on the axial FLAIR images. The oblique coronal T1-weighted images show a pathological atrophy of the medial temporal lobe structures particularly involving the hippocampus (white closed-head arrows). In addition, severe posterior atrophy of the parietal cortex, precuneus, and posterior cingulate can be seen (white open-head arrows). Lobar MBs associated with CAA (black arrow) on susceptibly weighted images can be observed in a substantial number of AD patients
Fig. 24.14
Oblique coronal CT images illustrating severe MTA in a patient with late-onset AD (white closed-head arrows). In the advanced stages of MTA, structures adjacent to the hippocampus also show signs of atrophy such as a substantial widening of the collateral sulcus (white open-head arrow)
Related posts:
Stay updated, free articles. Join our Telegram channel

Full access? Get Clinical Tree


