Fig. 2.1
Mechanisms used by VSDs that can change their location in response to membrane depolarization
It would be preferable to have a mechanism that produces dyes with sensitivities that are more robust and reliable from one experimental situation to another. In pursuit of this goal, we have concentrated on producing dyes with chromophores that interact directly with the membrane electric field by an electrochromic mechanism (often referred to as a molecular Stark effect). The idea is explained in Fig. 2.2, which uses the results of molecular orbital calculations and qualitative resonance structures to demonstrate how a dye which has an electron rich π-system on one end and an electron deficient π-system on the other can switch its electron distribution upon absorption of a photon to produce the excited state. di-4-ANEPPS, the most popular of the VSDs to emerge from our work, provides a specific example. The chromophore of this dye changes its electron configuration upon excitation such that the charge shifts from the pyridinium nitrogen in the ground state to the amino nitrogen in the excited state. This behavior is predicted from molecular orbital calculations (Loew et al. 1978) such as the results shown at the top of Fig. 2.2. A polar group is appended to one side of the chromophore in the form of a propylsulfonate moiety and two hydrocarbon chains are included at the opposite end. This, together with the intrinsic amphiphilicity of the chromophore, serves to anchor it in the membrane bilayer in an orientation that is approximately perpendicular to the surface. This orients the direction of the excitation-induced charge motion parallel to the electric field vector within the membrane, as depicted in the upper diagram of Fig. 2.3, where the dye is shown as if having been inserted from the outside of the cell. As a consequence, the ground and excited states are differentially stabilized by the intramembrane electric field, causing a shift in the spectrum when the membrane potential changes (bottom of Fig. 2.3). An equivalent way of thinking about this is to realize that the excitation induced charge displacement moves along the direction of the electric field when the membrane is polarized and against the direction of the electric field when the membrane is depolarized. Experiments from voltage-clamped bilayer membranes (Fluhler et al. 1985; Loew et al. 1979a; Loew and Simpson 1981) have provided evidence that di-4-ANEPPS and related hemicyanine dyes do respond to membrane potential via an electrochromic mechanism; indeed, these bilayer experiments can even be used to estimate the magnitude of the excitation induced charge redistribution (Loew and Simpson 1981). Although electrochromic dyes such as di-4-ANEPPS can produce unpredictable complications (discussed further in Sect. 4, below) we and others have been able to successfully utilize them in a very wide variety of experimental preparations (Loew et al. 1992). Dyes designed to utilize an electrochromic mechanism come closest to being universally applicable and calibrateable VSDs.
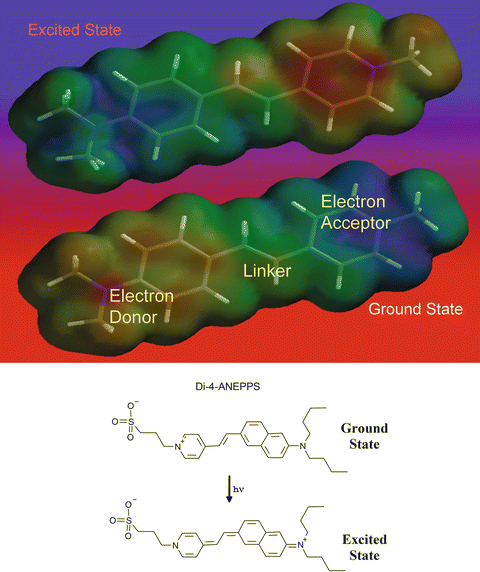
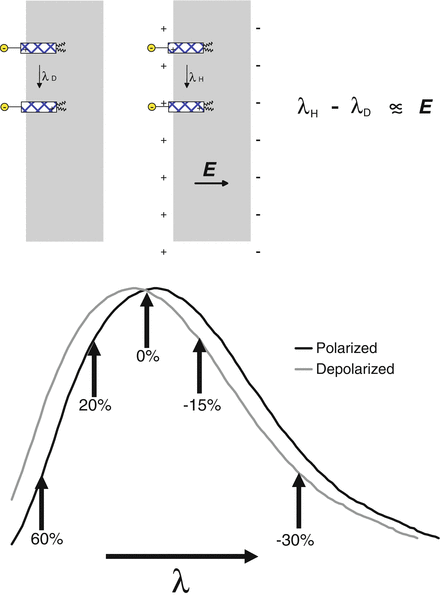

Fig. 2.2
Electrochromic mechanism of voltage sensitivity. The top shows how the electrons, and therefore the charge distribution, shifts upon excitation of a typical electrochromic dye. These images were generated from molecular orbital calculations where low electron density (i.e. regions of positive charge) are represented by bluer shades and high electron density (i.e. negative charge) is represented by redder colors. The lower portion of the figure shows resonance structures for the ground and excited states of one of the most widely used VSDs, di-4-ANEPPS. In this chromophore, the donor moiety is an aminonaphthyl group, the linker is a simple double bond and the acceptor is a pyridinium moiety

Fig. 2.3
The shift in the spectrum of an electrochromic dye upon depolarization. The upper panel shows how the electric field in the membrane, E, can perturb the spectrum of an electrochromic chromophore, represented by the stippled rectangles embedded in the outer surface of a membrane. The spectra shown in the lower half of this figure can represent absorbance, excitation or emission spectra. The relative change in fluorescence, ΔF/F is shown as a percentage change for different choices of detection wavelengths
3 Measuring Voltage Changes with VSDs
A number of modalities are available for measuring voltage dependent optical changes from excitable cells and tissues. The most common is fluorescence. This is advantageous because of the high contrast and low background intrinsic to this technique and the wide availability of fluorescence and confocal microscopes. Other chapters in this book will ably describe the considerations required for optimizing the speed and sensitivity of the instrumentation. In this section we will describe how the properties of the VSDs should be considered, focusing on fluorescence, but then briefly discussing absorbance and non-linear optical imaging of membrane potential.
The voltage-dependent shift in the excitation or emission spectrum to be expected from an electrochromic dye is depicted in Fig. 2.3, where the dye is assumed to be bound to the extracellular surface of the membrane and undergo charge redistribution in its excited state in the direction shown in Fig. 2.2. Under these circumstances, the spectra shift to shorter wavelength upon membrane depolarization. The magnitude of the spectral shift will be linearly related to the change in potential. In most experiments, a fixed band of wavelengths is continuously monitored, rather than attempting to scan the entire spectrum. Fig. 2.3 shows that the choice of wavelength can have a drastic effect on the observed sensitivity of the dye response. Contrary to what might be an experimentalist’s first impulse, the wavelengths of maximal absorbance or emission are actually the worst choices for achieving optimal sensitivity. The best sensitivity is achieved at the wings of the spectra and will show changes in opposite directions at the high and low wavelength wings. Furthermore, measuring the change in the fluorescence relative to total fluorescence signal, ΔF/F, biases the optimal wavelengths even further to the extreme edges of the excitation and emission spectra because F, the denominator, deceases steadily at the edges. An approximately linear relationship between the voltage change and the fluorescence or absorbance change is obtained at the wings because the local slope of the spectrum is approximately constant, at least until it starts flattening out toward the very high and low ends of the spectrum.
Another important consideration in choosing wavelengths, which mitigates against going too far out to the edges of the spectrum, is the signal to noise ratio (S:N). Essentially, the detection system must collect a sufficient number of photons per measurement so as to be able to determine the small modulation by the voltage with statistical reliability. For fluorescence measurements, the number of photons can be boosted by simply utilizing an intense excitation source; it should then be possible to pick wavelengths at the edge of the absorbance spectrum, where ΔF/F is maximal, without sacrificing signal. This is because the low absorbance at the spectral edge can be compensated by a higher intensity light source. This will permit a sufficient number of excitation events to occur in a sufficiently short time to be able to record action potentials. But a key consideration that prohibits applying this argument with respect to the edge of the emission spectrum is the limitation imposed by photobleaching. By detecting only a narrow band at the emission spectrum edge, most of the emitted photons will be lost, effectively wasting most of the excitation events. It would then be more probable that the dye will bleach before collecting sufficient photons for a good signal to noise ratio. Therefore, the best compromise between ΔF/F and S:N is to use an intense narrow band excitation source at the edge of the VSD absorbance spectrum, while collecting the emitted light through a filter that will pass all wavelengths longer than the emission spectrum maximum.
We and others have also taken advantage of the opposite changes in the voltage-dependence optical signals at the low and high wavelength wings of the spectra (Fig. 2.3) to implement a dual wavelength ratio detection scheme for measuring membrane potential with VSDs (Beach et al. 1996; Bullen et al. 1997; Knisley et al. 2000; Montana et al. 1989). The idea is to collect light from both wings of the spectrum and calculate the ratio of their fluorescence intensities as a measure of the voltage change. The primary advantage is that the sensitivity of the ratio is approximately equal to the additive absolute sensitivities at each wavelength. A second advantage is that the dual wavelength ratio can be, in principle, be used to report the absolute value of the intramembrane electric field. A single wavelength fluorescence measurement can only report a relative change in potential because the intensity depends on the level of staining, which can be quite variable even along the membrane of a single neuron. The ratio effectively normalizes away any differential staining levels because the fluorescence intensity at both wavelengths will be proportional to dye density but oppositely responsive to intramembrane electric field. We introduced the idea of dual excitation wavelength imaging (Montana et al. 1989) and showed that it could be used to map the membrane potential along a neuron induced by an external electric field (Bedlack et al. 1992). Importantly, because the dye reports on the local electric field, any variations in dipole potential or surface potential may also produce variations in the ratio (Bedlack et al. 1994; Gross et al. 1994; Xu and Loew 2003); therefore, any spatial variations in ratio must be interpreted with caution and my not reflect a variation in transmembrane potential. On the other hand, fast temporal variations in the ratio are likely to reflect changes in transmembrane potential because the changes in lipid composition that would be required for changes in other sources of intramembrane electric field would be slow on the timescale of action potentials. A dual emission wavelength measurement is preferred for rapid spatial mapping of electrical activity because two fixed detection paths can be employed (Bullen et al. 1997; Bullen and Saggau 1999) rather than mechanically switching between two excitation wavelength filters. In general, dual wavelength ratiometric measurements require more complex instrumentation and analysis than simply monitoring ΔF/F, so the adoption of this approach has been limited to experiments that require extracting a voltage dependent signal from other confounding variables.
A commonly used alternative to fluorescence for optically monitoring electrical activity, is to record or image the light transmitted through a specimen stained with a VSD (Glover et al. 2008; Habib et al. 2013; Sasaki et al. 2002). A change in the transmittance of a stained preparation simply reflects the change in the absorbance spectrum of the dye. Of course, the transmitted light corresponds to the light that actually does not get absorbed by the dye. The amount of light that is absorbed by a single dye-stained membrane depends on the size of the cell, the surface density of the dye molecules on the membrane and the extinction coefficient of the dye at the chosen wavelength. But it can be estimated that this will never exceed 1 part in 103 for even the largest cell. The modulation of the transmitted light signal by an action potential would therefore never be much greater than ~1 part in 104. A comparable estimate for the modulation of fluorescence is one part in ten, because the entire light signal emanates from the stained membrane. So if ΔT/T is intrinsically so much lower than ΔF/F, why would anyone prefer to use transmitted light for optical electrophysiological recording? Indeed, the technique is almost never used for recording from single cells. In experiments where the collective activity of a large population of cells in a tissue needs to be imaged, the sensitivity of the technique is increased because more of the incident light is absorbed. Furthermore, the S:N in a transmitted light detection is not limited by photon statistics so simpler and less noisy photodetectors can be used.
Another approach that is just beginning to emerge for VSDs is 2-photon-excited fluorescence (2PF) (Acker and Loew 2013; Acker et al. 2011; Fisher et al. 2008; Kuhn et al. 2008; Loew et al. 2002; Yan et al. 2012). There is really no difference in principle in the way that 1-photon and 2-photon excited fluorescence measures the dye response, except, of course, that the 2-photon modality requires a femtosecond pulsed laser operating at twice the wavelength and a microscope configuration that is optimized for the purpose (Denk et al. 1990). The major advantage of 2-photon excited fluorescence is the ability to probe deep inside a specimen with high 3D resolution. The disadvantage, in addition to complex instrumentation, is that the laser scanning required to obtain a full image of the specimen is too slow for recording of action potential activity; therefore, line scans or special spatial sampling protocols are used to record optical signals from a small number of sites. A later chapter in this volume is devoted to 2-photon microscopy of VSDs.
Second harmonic generation (SHG) is another non-linear optical process (Campagnola and Loew 2003; Millard et al. 2003a) that can take place in a microscope coupled to an ultrafast laser. As in the case of two-photon excitation the probability of SHG is proportional to the square of the incident light intensity. While 2PF involves the near-simultaneous absorption of two photons to excite a fluorophore, followed by relaxation and non-coherent emission, SHG is a nearly instantaneous process in which two photons are converted into a single photon of twice the energy, emitted coherently. Furthermore, SHG is confined to loci lacking a center of symmetry; this constraint is readily satisfied at cellular membranes in which SHG-active constituents are unevenly distributed between the two leaflets of the lipid bilayer. The first examination of the non-linear optical properties of VSDs was in a collaboration between this lab and Aaron Lewis’ lab, where we analyzed SHG from a monolayer of di-4-ANEPPS in a Langmuir-Blodgett trough (Huang et al. 1988). Subsequently (Ben-Oren et al. 1996; Bouevitch et al. 1993; Campagnola et al. 1999) we were able to show that the SHG signal from electrochromic dye stained membranes is sensitive to membrane potential. These experiments were continued (Clark et al. 2000; Millard et al. 2003b, 2004, 2005a, b; Teisseyre et al. 2007) in an attempt to characterize and optimize the SHG response of our dyes to membrane potential. They indicated that the mechanism could not be explained as a direct electrooptic effect because the kinetics of the response for some of the dyes was slow, although these were not always the conclusions reached by others (Jiang et al. 2007; Pons et al. 2003). Whatever the mechanism, the laboratories of Rafael Yuste, Kenneth Eisenthal and Watt Webb (Araya et al. 2006, 2007; Dombeck et al. 2004, 2005; Nuriya et al. 2006) were able to demonstrate the measurement of action potentials using second harmonic imaging microscopy. These studies used the hemicyanine dye FM-464 applied to the interior of the cell through a patch pipette. Because the SHG can only come from dye that is non-centrosymmetrically distributed on the spatial scale of the wavelength, the light emanates only form the internally stained plasma membrane and no signal appears from internally stained organelles with highly convoluted membranes such as the endoplasmic reticulum and mitochondria. Because of this elimination of background from these internal electrically inactive membranes, the voltage sensitivity of the SHG signal can approach 20 %/action potential – much higher than is practically possible with fluorescence. However, these measurements had very low S:N and required extensive signal averaging because of the low intensity of the SHG. Therefore, it is not clear how generally useful this modality will ultimately be until new dyes are developed with much stronger SHG efficiencies. I present a detailed treatment of the topic of SHG imaging of membrane potential in Chap. 19 of this volume.
4 Choosing the Best Dye for an Experiment
Many of the hemicyanine dyes synthesized in our and other labs are capable of sensing membrane potential changes with high sensitivity. But different experimental designs require different spectral properties, solubility properties and membrane binding affinities. Furthermore, competing processes can sometimes diminish the sensitivity of a given dye in a particular experimental preparation. So there is a need for a large repertoire of dyes to meet these varying needs and this section will consider how to make these choices. We focus on dyes developed in this laboratory as examples, but the same principles can be applied to the dyes developed by others.
A prerequisite for choosing a dye is simply being able to appreciate the structural variety of VSDs and establishing some nomenclature that permits us to refer to them in a recognizable way. As discussed in Sect. 2, the hemicyanine chromophores are all characterized by one end that is electron rich in the ground state, also called an electron donor moiety, and another end that is electron deficient, an electron acceptor moiety (Fig. 2.2). When these groups are linked with a π-electron linker, it is possible for the electrons to readily shift in response to excitation. Chromophores with such electronic structures are commonly called “push-pull” chromophores because of the complementary tendencies of the electrons at the two ends. Fig. 2.4 lists all of the donor, linker and acceptor moieties that we have employed in our lab to develop push-pull chromophores. We have synthesized approximately 300 dyes utilizing over 50 of these push-pull hemicyanine chromophores. The R1 groups on the donor ends are usually hydrocarbon chains that anchor the dye to the hydrophobic interior of the membrane. The R2 groups on the acceptor ends are usually hydrophilic groups that protrude into the aqueous medium adjacent to the membrane and help to maintain the orientation of the chromophore perpendicular to the membrane surface (cf. Fig. 2.3). The laboratories of Amiram Grinvald and Alan Waggoner have also developed large numbers of VSDs using some of these groups. Table 2.1 provides the spectral characteristics of most of the chromophores constructed from these parts in ethanol, water and when bound to lipid vesicle membranes. An important attribute of almost all of these dyes is that they have strong fluorescence quantum efficiencies in the membrane bound forms, but typically at least 2 orders of magnitude lower fluorescence in aqueous solution. This means that the background signal from unbound dye can usually be completely neglected even if the preparation is allowed to remain exposed to the aqueous staining solution. For the reasons discussed in Sect. 3, the optimal wavelengths for voltage sensitivity are typically ~50 nm above the maximum wavelengths reported for the lipid spectral in Table 2.1.
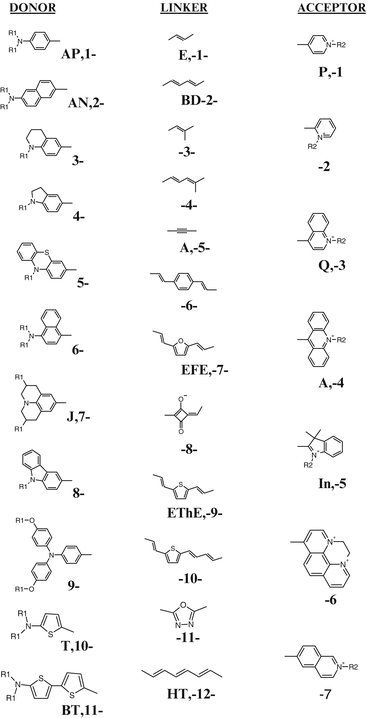

Fig. 2.4
The components that have been used to construct hemicyanine push-pull chromophores. A combinatorially large repertoire of chromophores have been constructed by mixing the D-L-A moieties. The abbreviations for some of the more common components are shown alongside the number scheme that was employed to designate the chromophores in Table 2.1. VSDs are then realized from the chromophores by appending hydrophobic tails, R1, and hydrophilic head groups, R2
Table 2.1
Wavelength ranges of absorbance and emission maxima for styryl dye chromophores
Chromophore | Number | λABS (EtOH) | λEM (EtOH) | λABS (lip) | λEM (lip) |
|---|---|---|---|---|---|
[1–1–1] | 18 | 490 ± 9 | 617 ± 8 | 468 ± 7 | 600 ± 10 |
[1–1–2] | 2 | 470 | 610 ± 10 | 441 ± 2 | 590 ± 30 |
[1–1–3] | 3 | 564 ± 5 | 684 ± 7 | 533 ± 5 | 680 ± 70 |
[1–1–4] | 3 | 564 ± 5 | 684 ± 7 | 533 ± 5 | 680 ± 70 |
[1–1–5] | 1 | 567 | 599 | 562 | 601 |
[1–1–6] | 2 | 590 ± 1 | 679 | 578 | 662 |
[1–2–1] | 5 | 510 ± 10 | 680 ± 50 | 468 ± 7 | 620 ± 20 |
[1–2–3] | 2 | 560 ± 30 | 675 ± 7 | 540 ± 20 | |
[1–2–4] | 3 | 700 ± 20 | 800 ± 50 | 611 ± 10 | 771 ± 1 |
[1–2–5] | 1 | 650 | 700 | 638 | |
[1–3–1] | 1 | 475 | 610 | 450 | 584 |
[1–4–1] | 1 | 485 | 715 | 463 | 690 |
[1–5–4] | 2 | 630 ± 10 | 720 ± 40 | 580 ± 10 | 660 ± 10 |
[1–6–1] | 1 | 482 | 461 | 670 | |
[1–7–3] | 3 | 640 ± 20 | 890 ± 70 | 580 ± 10 | 740 ± 30 |
[1–8–3] | 1 | 607 | 579 | 646 | |
[1–8–5] | 1 | 626 | 639 | 634 | 647 |
[1–9–3] | 4 | 590 ± 20 | 800 ± 100 | 548 ± 5 | 720 ± 50 |
[1–9–5] | 2 | 690 ± 30 | 870 | 640 ± 10 | 757 |
[1–10–3] | 1 | 626 | 664 | 616 | 650 |
[1–11–1] | 1 | 440 | 641 | 420 | |
[1–11–4] | 1 | 391 | 692 | 404 | 552 |
[2–1–1] | 47 | 500 ± 10 | 710 ± 10 | 470 ± 10 | 640 ± 20 |
[2–1–7] | 1 | 486 | 464 | 627 | |
[2–2–3] | 1 | 584 | 812 | 526 | 702 |
[2–2–6] | 1 | 609 | |||
[3–1–3] | 3 | 580 ± 6 | 689 ± 1 | 556 ± 5 | 680 |
[3–1–4] | 1 | 681 | 770 | 658 | |
[4–1–3] | 1 | 608 | 833 | 589 | 760 |
[4–1–4] | 3 | 705 ± 7 | 833 | 612 ± 1 | 716 |
[4–1–6] | 1 | 610 | 610 | ||
[4–7–3] | 1 | 592 | 873 | 597 | 715 |
[5–1–3] | 1 | 514 | 620 | 500 | 714 |
[6–1–1] | 1 | 474 | 656 | 432 | 630 |
[6–1–3] | 2 | 520 ± 20 | 714 ± 9 | 480 ± 20 | 671 ± 8 |
[6–1–5] | 1 | 616 | 636 | 620 | 643 |
[7–1–1] | 1 | 523 | 640 | ||
[7–1–3] | 3 | 620 ± 10 | 720 ± 10 | 579 ± 1 | 673 ± 4 |
[7–1–4] | 4 | 726 ± 10 | 810 ± 40 | 678 ± 7 | 770 ± 60 |
[7–1–5] | 1 | 588 | 612 | 594 | 618 |
[7–1–6] | 1 | 600 | 708 | 618 | |
[7–2–4] | 1 | 825 | 880 | 674 | 790 |
[7–8–3] | 1 | 663 | 687 | 668 | 680 |
[7–9–3] | 2
Stay updated, free articles. Join our Telegram channel
Full access? Get Clinical Tree
 Get Clinical Tree app for offline access

|
