Design Criteria for PET Scanners: What is Important and Why
Charles Stearns
Alexander Tokman
Positron emission tomography (PET) image quality is a function of scanner resolution and the statistical quality of the data acquired. For most clinical PET studies, image quality is limited not by the intrinsic resolution of the scanner but by the signal-to-noise characteristics of the data. The PET signal is the true coincidence count during the scan; noise comes from the Poisson statistics of the combined true, scattered, and random coincidence counts. The task of systems design is to maximize acquired true counts (i.e., signal) while minimizing the scatter and random coincidence contamination (i.e., noise). This is not straightforward, because many design parameters have multiple influences, and all design decisions must be weighed against their impact on the cost of the scanner. Noise-equivalent count rate (NECR) analysis is a method of demonstrating the relationship among true, scattered, and random coincidences and their impact on signal-to-noise in the PET data set (see Fig. 5.5). Although NECR analysis is a valuable tool, it is dependent on the particular imaging task under consideration.
The primary imaging performance metrics (per National Electrical Manufacturers Association [NEMA] methods) of PET and PET-CT scanners are a function of many variables, and no single scanner component determines the imaging performance of the PET scanner. The intrinsic characteristics of the detector crystal material (e.g., its stopping power, speed, and energy resolution) are important, but other aspects of PET system design (e.g., system and crystal geometry, crystal volume, septa design, and electronics) are also key determinants of PET imaging performance. True coincidence sensitivity, for example, is a function not only of the sensitivity of the detector (probability that a 511-keV photon hitting the detector is recognized by the system) but also the geometric sensitivity of the scanner (what fraction of annihilation photon pairs hit the detector). Similarly, scattered and random coincidences depend on detector and system properties as well.
One significant question in PET system design is the presence of slice septa. For current clinical applications, a septa-less design has a much higher geometric sensitivity for both signal and noise coincidences. The merits of a septa-less scanner (or the septa-retracted mode of a retractable septa scanner) hinge on whether the benefits of increased true coincidences are outweighed by the costs in increased scatter and randoms. The answer to this question is very dependent on the imaging application. Brain imaging with relatively modest scatter and random coincidence benefits from septa-less imaging; however, the advantages of septa-less whole-body imaging are less clear.
Introduction
The exceptional clinical utility of positron emission tomography (PET) in diagnosing, staging, and restaging oncologic as well as other disorders has led to a dramatic growth of PET applications worldwide in the last few years. This growth has been further spurred by factors such as expanded reimbursements, the growth of the entrepreneurial segment,
fluorodeoxyglucose (FDG) dose availability, overall improved cost-effectiveness, and the introduction of PET-computed tomography (CT) technology. The first three factors are the primary reasons for the exploding U.S. PET market.
fluorodeoxyglucose (FDG) dose availability, overall improved cost-effectiveness, and the introduction of PET-computed tomography (CT) technology. The first three factors are the primary reasons for the exploding U.S. PET market.
As PET emerges from being a research tool used by selected luminary institutions to become a mainstream medical imaging modality, the new users ask typical questions when inquiring about the technology. What is a good PET scanner? Which scanner is better and why? What is the minimum performance I must have and can I afford it given my budget constraints? What PET detector technology should I go with: bismuth germinate (BGO), lutetium oxyorthosilicate (LSO), gadolinium oxyorthosilicate (GSO), or sodium iodide (NaI)? These questions do not have simple answers, especially because they all are open-ended. For example, two PET scanners based on the same PET detector technology may perform completely differently. In one case, scanner A will outperform scanner B because it has better scanner geometry, better crystal geometry, more crystal volume, more crystals, and better electronics, but it will be more expensive. In another case, two scanners may be of comparable cost, but scanner A performs better for oncologic procedures whereas scanner B excels at neurological applications because of crystal geometry differences. Thus, the performance parameters trade-off is key in PET scanner design, and no single component makes one scanner better than the other.
What does “better” mean in clinical terms? Does it improve the accuracy of the diagnosis or staging? Does it allow one to see finer objects in the image? Do objects exhibit better a contrast-to-noise ratio and therefore are more easily seen? Of course, the objective way to get answers to the questions is to scan a number of patients on several scanners, conduct objective observer studies, and then compare the accuracy and effectiveness of each scanner with respect to others, not forgetting the other important clinical attributes, such as the time it took to complete the patient examination and the injected patient dose. In reality, this is not feasible, so standardized phantom studies are used as predictors of scanner performance.
The objective of this chapter is to provide the reader with the pragmatic overview of the top-down principles of PET scanner design without “drowning” him or her with the underlying scanner and detector physics. In this flow-down process, the clinical application requirements drive scanner requirements, which in turn determine the critical scanner components and specifications.
Clinical Application Requirements
The clinical efficacy of any medical imaging device, including PET scanners is determined by the following factors (note that in the remainder of this chapter, unless referring to a specific scanner model, the terms “PET” and “PET scanner” will be used to mean either a stand-alone PET scanner or the PET component of a PET-CT scanner):
Lesion detectability: the ability to detect objects of various sizes and contrast-to-background ratios.
Examination time: the elapsed time between when the patient is placed on the table to when the images are reconstructed and the patient is dismissed. Although the overall examination time typically comprises five elements, including patient check-in time, injection time, the postinjection wait period, and patient positioning time and imaging time (acquisition and reconstruction time), the latter two are most dependent on the design and operation of the PET scanner.
Dose: how can one minimize the dose to patients and staff without sacrificing the clinical efficacy of the examination?
Applications capability: scanner ability to perform routine and advanced clinical and research applications. Although FDG oncology imaging is currently the dominant clinical imaging procedure in many institutions, the growth of applications in cardiology and neurology may place additional demands on the PET scanners. Applications involving other isotopes, particularly positron emitters such as iodine 124 (124I) and copper 64 (64Cu), which are characterized by low positron fractions and high incidence of coincident or noncoincident γ–ray emission, also may become important in the future, although there are radiation protection issues (see Chapter 9).
Note that these factors are also highly interrelated: for example, one can reduce the examination time by simply increasing the dose to the patient or by accepting a reduced image quality. The following section outlines what drives these clinical parameters.
Pet Imaging Performance Attributes
The top-level requirements for the PET scanner fall into one of the these categories: image quality, examination time or throughput, extended features and functionality, ease of use, connectivity, reliability, serviceability, and cost. This chapter focuses on the scanner parameters that impact image quality and examination time.
In the 1990s, the PET manufacturers and academic experts developed the National Electrical Manufacturers Association (NEMA) standard for measuring the performance of PET scanners. They jointly agreed on the important parameters affecting clinical image quality and patient imaging time.
Spatial Resolution
Spatial resolution is defined as the ability of the PET scanner to discern small objects. Resolution is generally assessed by measuring the response of the system to a point source emitter (typically approximately 1 mm). It is typically reported as “full width at half maximum” (FWHM), or the width of the region where reconstructed pixel values exceed half the maximum pixel value of the point source response. This is shown in Figure 5.1. It is theoretically impossible to distinguish two objects closer together than one FWHM, because there is no discernible
valley between the two point spread responses in the image. Spatial resolution is typically presented in transaxial and axial directions.
valley between the two point spread responses in the image. Spatial resolution is typically presented in transaxial and axial directions.
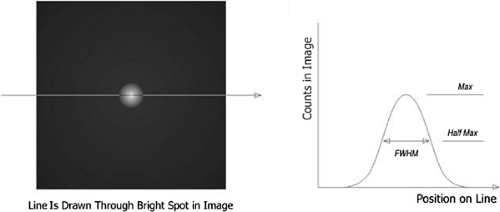 Figure 5.1 Full width at half maximum resolution measurement. A profile is drawn through the image (left). The maximum value along the profile is found, then the width of the profile at the half-maximum level is calculated (right). |
It is well known that PET resolution is limited by the range of the emitted positron and by the noncollinearity of the annihilation photon pair (see Chapter 3). These factors provide a fundamental resolution limit for PET images at roughly 2 mm FWHM for human whole-body imaging. This limit may only be achieved with a perfect detector system that is able to locate each annihilation photon precisely. Real detectors fall short of this ideal in two important ways:
First, the detector is composed of finite elements. This is true whether the detector is assembled from individual crystals (as in a block detector) or is the digitized readout from a continuous detector (as in an Anger camera). The line of response between two detector elements is therefore not a line but a tube of nonzero width, as shown in Figure 5.2A. At the midpoint of the line between the two detectors, the sensitivity profile across this tube is triangular, so the FWHM of the profile is one-half the detector element width. Away from the midpoint, the sensitivity profile becomes trapezoidal, with a FWHM somewhat larger than half the element width.
Second, precise localization is possible only if the annihilation photon has a single (photoelectric) interaction with the detector, depositing all of its energy at the site of that interaction. Unfortunately, 511-keV photons are fairly energetic and will frequently undergo Compton scatter. A secondary photon leaves the Compton scatter site, making it possible to have multiple interactions in the detector (Fig. 5.2B). In this example, the top photon has a Compton scatter in detector A, and the scattered photon has a photoelectric event in detector B. Only a small amount of energy is deposited in detector A; most of the energy is deposited in detector B. The detector will likely determine that the photon interacted in detector B, and will assign the coincidence event to line of response BC instead of AC. Quantifying the impact of this effect on scanner resolution is difficult, because it is a complex function of the detector configuration, detector material properties, and scanner electronics design. However, it is clear that a detector material with a higher photofraction (i.e., a higher probability of photoelectric vs. Compton interaction with the incident photon) will have more single-interaction events in the detector and therefore less resolution loss due to multiple detector interactions.
However, detector designs that attempt to approach this limit in human imaging are confronted by signal-to-noise issues that prevent the completed system from utilizing the high resolution the detector can provide.
A demonstration of the importance of signal-to-noise in reconstructed PET images is shown in Figure 5.3. For this study, a resolution phantom was simulated in which the smallest features are 2.5 mm in diameter and spaced by 10 mm. Three data sets were created with 105, 106, and 107 true counts, each using a hypothetical PET detector with
resolution of 4 mm FWHM. The top row shows the reconstruction of the three data sets with a standard ramp filter. Each of the images has the same theoretical or intrinsic resolution properties, but it is clear that much more detail is evident as the total count increases. The middle and bottom rows show the effect of applying smoothing filters to the images during reconstruction. Filtering reduces the resolution of the imaging system and decreases the detail visible in the high-count image. However, even though the theoretical resolution of the filtered images is reduced, feature visibility in the lower count images is improved by reducing the background noise.
resolution of 4 mm FWHM. The top row shows the reconstruction of the three data sets with a standard ramp filter. Each of the images has the same theoretical or intrinsic resolution properties, but it is clear that much more detail is evident as the total count increases. The middle and bottom rows show the effect of applying smoothing filters to the images during reconstruction. Filtering reduces the resolution of the imaging system and decreases the detail visible in the high-count image. However, even though the theoretical resolution of the filtered images is reduced, feature visibility in the lower count images is improved by reducing the background noise.
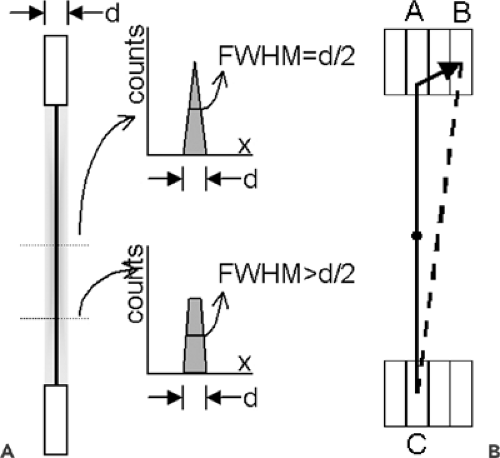 Figure 5.2 Detector elements of a finite size yield a line of response whose full width at half maximum is one-half the detector width midway between the detector elements and increases away from the midway point (A). Multiple interactions of the incident photon in the detector material cause the scanner to identify this coincidence event along line BC instead of AC (B). |
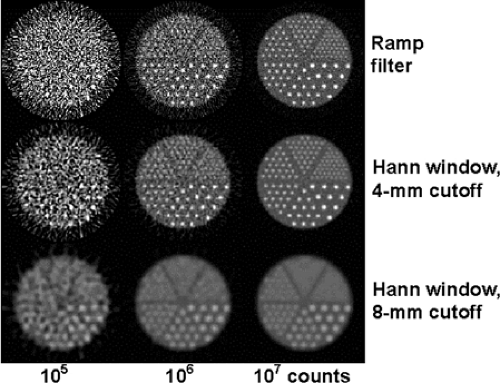 Figure 5.3 The importance of counts in reconstructed image quality. Simulated images with 105 (left column), 106 (center column), and 107 (right column) counts; reconstructed with a Ramp filter (top row), Hann window with 4-mm cutoff (middle row), and Hann window with 8-mm cutoff (bottom row). Although the high-count images demonstrate that the intrinsic resolution of the images is degraded by filtering, filtering increases feature detectability in the low-count images. |
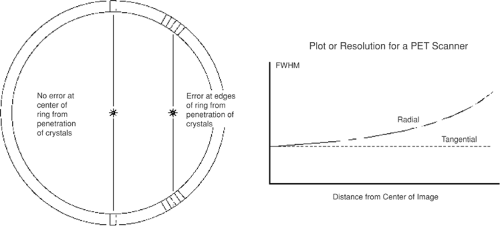 Figure 5.4 At the center of the ring (left), events are detected in one line of response, independent of their depth of interaction in the detector. Away from the center, the events are distributed over several detector elements. The result is a loss in radial resolution away from the center of the field of view, as depicted in the graph at the right. |
Resolution uniformity refers to the consistency of spatial resolution across the scanning field of view (FOV). In many PET scanner designs, the detectors are all oriented at the center of the imaging FOV; therefore, photons entering the detector volume from off-center locations may interact in one of several detector elements. The resulting uncertainty in event localization leads to an elongation in the point-spread function in the radial direction; a larger detector ring in a PET scanner will lessen this effect. The effect of the resolution degradation away from the center is shown in Figure 5.4. In clinical applications, the patient represents a finite emission volume and not a point source; hence the off-center resolution is a critical imaging attribute.
Signal-to-Noise Level: Noise Effective Count Rate
The noise effective count rate (NECR) is a composite imaging metric originally proposed by Strother et al. (1). The NECR takes into account the fact that although true coincident events represent the signal in PET imaging, the Poisson statistics of the combined true, scatter, and random coincidences contribute to image noise. Even if the scatter and random corrections are perfect—that is, they accurately and noiselessly estimate the expected level of scatter and random coincidences in the data set—the corrections cannot compensate for the additional counting noise introduced by those coincidences. Factors affecting NECR
include trues sensitivity, scatter and random coincidences, attenuation, and dead time. These are illustrated in Figure 5.5. NECR is computed as
include trues sensitivity, scatter and random coincidences, attenuation, and dead time. These are illustrated in Figure 5.5. NECR is computed as
Related posts:
 11C-Based PET- Radiopharmaceuticals of Clinical Value
 Brain Tumors: Astrocytoma, Oligodendroglioma, and Glioblastoma Images with PET and SPECT
 Sentinel Node Imaging in Head and Neck Tumors
 PET-CT and SPECT-CT of Bone Metastases
 SPECT and PET in Benign Thyroid and Parathyroid Disease
Stay updated, free articles. Join our Telegram channel

Full access? Get Clinical Tree


