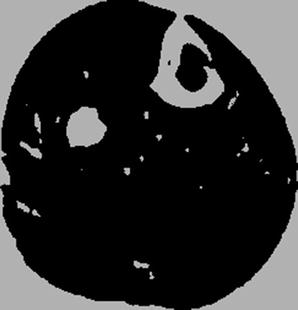
Fig. 6.1
Original MRI image (Image courtesy: Clinical flow wiki)
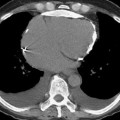
Fig. 6.2
Green component of the image
The green component of the image has been considered as the intensity values are comparably higher in it when compared to R & B components (Fig. 6.3).