Fig. 4.1
Electron micrograph image of a myocardial capillary (Courtesy Clinical Science Journal, 2004)
The Fig. 4.2 is the result of contrast limited adaptive histogram equalization (CLAHE) which is to adjust the contrast in an intensity image. In the original image the visibility of thickening of basement membrane is not so clear. CLAHE produces an output image has the clear visibility of thickening of basement membrane of blood vessel.
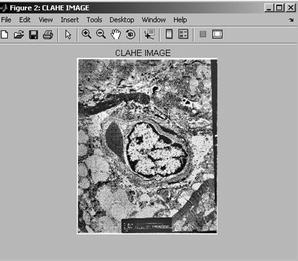
Fig. 4.2
CLAHE image
By adjusting the intensity range as shown in Fig. 4.3 one can have a clear picture on the region of interest (ROI). Here the details in the blood capillary are visible clearly and neglects the other objects in image by intensity adjustment. Hence one can estimate that the part which is useful and which part has been affected. This is useful in early medical education of Diabetic patients.
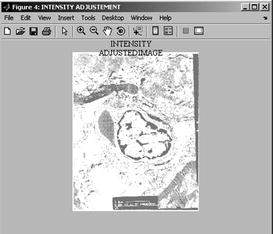
Fig. 4.3
Intensity adjusted image
The Fig. 4.4a–c Shows image information which gives the details about the input image, CLAHE Image, Intensity adjusted image i.e. the type of the image and intensity ranges are observed in above tool bar. The Width attribute gives the information about the number of columns available in the image and Height attribute gives the information about the number of rows available in the image. Class attribute gives about which type of class of the image saved and Image type is intensity image. The minimum intensity is 41 and maximum intensity is 255 for CLAHE image and it is 150 and 255 respectively for Intensity adjusted image.
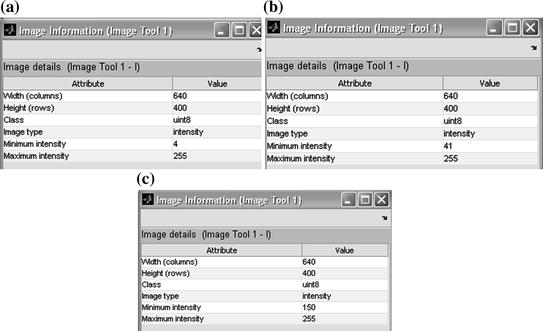
Fig. 4.4
a–c Image information
The Fig. 4.5a–d gives the information about image pixels in the image the values of gray shades of image. This is mainly used to represent the values of gray shades at each point of image which makes the differentiation of shades easier as compared to human perception ability.
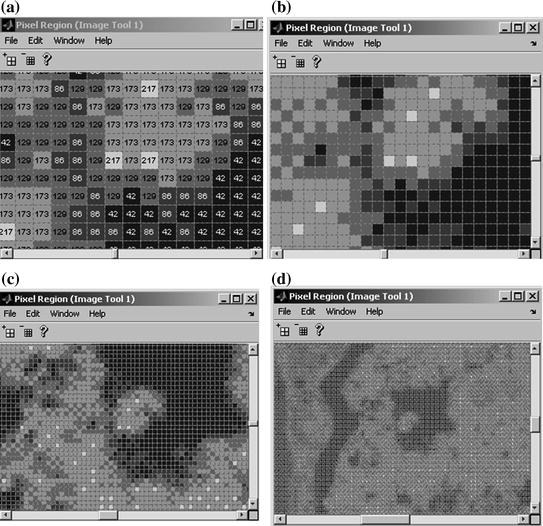
Fig. 4.5
a–d Pixel regions
4.1 Detection of Atherosclerosis
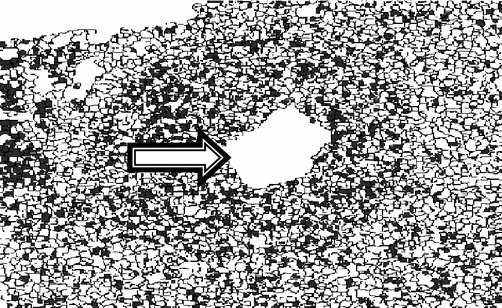
To analyze the complex atherosclerosis of distal right coronary artery and luminal narrowing in Fig. 4.6: Low Magnification Micrograph (Courtesy: Wikimedia Commons (Image Timed and dated 02:19, 1 August 2009, Nephron (Author), Creative Commons Attribution-Share Alike 3.0 Unported license)) is considered for the implementation of above discussed segmentation algorithms to extract the features needed for detection and to forecast the severity of disease.
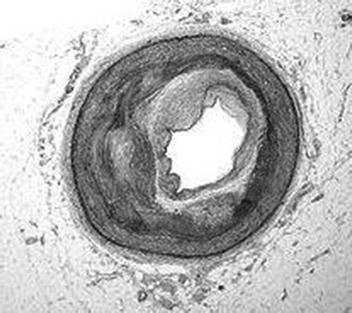
Fig. 4.6
Low magnification micrograph
The Fig. 4.7 represents K-means segmented image from which the arrow indicates the amount of Lumen left for blood flow but with degraded image quality.
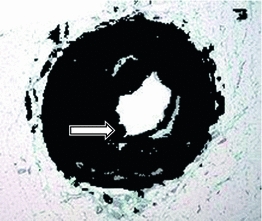
Fig. 4.7
K-means segmented image
The arrow mark in Fig. 4.8 shows the white circular resemblance region which indicates the actual Lumen that shows the path for the flow of blood obtained using FCM segmented result.
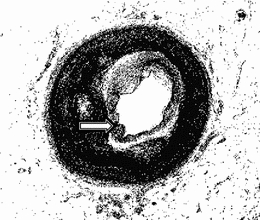
Fig. 4.8
FCM segmented image
In this first step of Watershed method the input image is transformed to a image (Fig. 4.9) that is appended with the calculated Euclidean distance value of each pixel from it’s nearest non zero pixel. The innermost region in the original image pixels is having a little variation with the neighborhood pixels. This little variation is so important that the pixels at the contour of the innermost region are appended with one Euclidean distance value and the pixels within the innermost region are appended with other Euclidean distance value. Thus this labeled image is useful in extracting a variation in the images. As the variations generally significant at the contours the labeled image with distance transform seems to represent the region border clearly. Also note that in the original image the region far away from the center are having high intensities than the inner black regions.
Fig. 4.9
Watershed—distance transform
Gradient of a image is useful in suppressing the noise. The regions with small variations in the intensities have small values of gradient. In the given image the inner constricted region is having greater intensity values than the next contours. Even though the ‘Watershed-gradient’ image is over segmented, the resulting image (Fig. 4.10) is useful to analyze that how exact the remaining portion (Lumen) that is not constricted. This is useful in taking suitable precautions or for the cardiologist to analyze the level of complication and for necessary treatment.