Thyroid gland
Characteristic
Size
Measure sagittal × AP × transverse dimensions
Unusual shape
Note and measure extension of lobe(s) below clavicles, pyramidal lobe, and thyroglossal duct masses
Echotexture
Homogeneous or heterogeneous
Echogenicity
Compare to strap muscles: hypoechoic, isoechoic, hyperechoic (normal echogenicity is simlar to the submandibular gland)
Vascular pattern
Increased, decreased, or normal by Doppler analysis, note if vascular flow outlines isoechoic nodule
Calcification
Note clusters of microcalcification, macrocalcification, or disrupted eggshell calcification
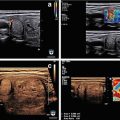
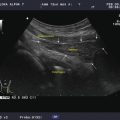
Figure 6.1
Normal thyroid and diffuse thyroid disease (DTD) goiters. Right transverse view. (a) Normal size and echotexture. (b) Simple goiter with mildly heterogeneous echotexture. (c) Adenomatous goiter with heterogeneous echotexture. (d) Autoimmune goiter with thyroiditis. CA carotid artery, TR trachea
Diffuse and Adenomatous Goiter
Any nonmalignant increase in the size of the thyroid above normal is referred to as a goiter [1]. Thyroid size, shape, and volume vary with age, gender, and iodine sufficiency. The normal thyroid volume for a male (14 mL) is larger than a female (12 mL). The normal dimensions of an adult thyroid are 40–60 mm longitudinal and 13–18 mm in AP diameter. A practical measurement of the thyroid >2 cm in the AP or transverse dimensions or >5 in the longitudinal measurement is considered be enlarged. The characteristic of the thyroid enlargement may be diffuse or nodular. Non-thyroiditis DTD includes simple goiter, adenomatous goiter, and infiltrative disease (amyloid and iron deposition). The causes of simple goiter are multifactorial and involve interactions between genetics, gender (female > male), environmental (iodine intake), pregnancy, and other factors [2, 3]. The most common cause of thyroid enlargement worldwide is iodine deficiency [4, 5]. Insufficient iodine intake reduces thyroid hormone output that stimulates follicular epithelium compensatory hypertrophy and polyclonal follicles hypertrophy and results a simple goiter. There is continued goiter growth in an attempt to maintain a euthyroid state. The alternating follicular growth, hemorrhagic degeneration, and scarring over the course of growth result in the development of nodular thyroid disease [3].
Conventional B Mode Gray-Scale Ultrasound
The normal thyroid examined by ultrasound shows the parenchyma to be finely granulated (ground-glass appearance), and the echogenicity is similar to the salivary glands but of higher echogenicity compared to the adjacent strap muscles or sternocleidomastoid muscle [6] (Figs. 6.1a, b and 6.2). The individual nodules that can be seen on histopathology of a sonographic simple goiter (Figs. 6.1 and 6.2) or adenomatous goiter (Fig. 6.3) are difficult to distinguish on B mode US because the echotexture of the nodules are similar to the normal thyroid parenchyma and the nodules have incomplete capsules. This results in an ultrasound image that shows thyroid enlargement with minimal parenchymal heterogeneity without distinct nodules and is described as a simple goiter on US (Fig. 6.2). An enlarged thyroid with more parenchymal heterogeneity with variable amounts of cystic degeneration, vascular flow, and dystrophic or eggshell calcification but without a distinct nodule is called an adenomatous goiter on US imaging (Fig. 6.3). By definition, simple or diffuse adenomatous goiters do not have sonographically distinct nodules that can be assessed for the risk of malignancy by the AACE [7] and ATA [8] nodule guidelines. The overall size of the enlarged thyroid (sagittal × AP × transverse measurements) and the absence of high-risk nodules should be noted in the US report.
Figure 6.2
Simple goiter. The echotexture is minimally heterogeneous without discrete nodules. The thyroid is enlarged and measures 6.5 × 2 × 2.5 cm (sagittal × AP × transverse) in a small 50 kg female. CA carotid artery. (a) Left transverse view. (b) Left sagittal view
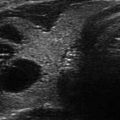
Figure 6.3
Adenomatous goiter. The echotexture is heterogeneous with confluent isoechoic nodules. Examining the individual nodular areas in transverse and sagittal dimensions, a discrete nodule could not be seen due to either the confluence of nodules or the lack of a complete capsule in adenomatous nodules. The thyroid is enlarged and measures 7.1 × 2.6 × 3.2 cm (sagittal × AP × transverse) in an 80 kg female. CA carotid artery. (a) Right transverse view. (b) Right sagittal view. Dystrophic macrocalcification in the isthmus (arrow)
Color Doppler Imaging (CDI)
CDI should be used to examine a diffusely enlarged goiter because the vascular flow may identify otherwise non-visualized isoechoic nodules which if >1.5–2 cm could be considered for FNA biopsy (Fig. 6.4) or reveal early thyroiditis with a diffuse increase in vascularity (see Fig. 6.8).
Figure 6.4
Adenomatous goiter and isoechoic nodules detected by CDI. The echotexture is heterogeneous with confluent isoechoic nodules. Examining the individual nodular areas in transverse and sagittal views did not show distinct nodules. A discrete isoechoic nodule with peripheral vascular flow (grade 2) was detected in the left lobe by the use of CDI (a, b). Vascular flow that was increased in a low to moderate intranodular pattern (grade 3/grade 4) confirmed isoechoic nodules in the left and right lobes by CDI (c, d)
Elastography
There have been no studies using elastography in the US evaluation of simple or adenomatous goiters that do not have distinct nodules. Elastography is not recommended for the routine evaluation of diffuse or adenomatous goiters.
Thyroiditis
There are different etiologies of thyroid inflammation including autoimmune, infection, medication, and ionizing radiation. The most common forms of thyroiditis will be covered in this chapter: Hashimoto’s thyroiditis, Graves’ thyroiditis, subacute thyroiditis, and Riedel’s thyroiditis. Types of thyroiditis that can be identified by US are located in Table 6.2. The appearance of pseudonodules and thyroid malignancies will be discussed in the context of the difficulty in detection by B mode gray-scale US in the hypoechoic heterogeneous background of thyroiditis.
Table 6.2
Types of thyroiditis
Hashimoto’s thyroiditis (chronic lymphocytic thyroiditis) |
Subacute thyroiditis (postpartum; silent painless or lymphocytic; painful or subacute pseudogranulomatous) |
Riedel’s thyroiditis |
Suppurative thyroiditis |
Drug-induced thyroiditis (amiodarone, lithium, interferon alfa, interleukin-2, tyrosine kinase inhibitors, high iodine intake) |
Hashimoto’s Thyroiditis
Hashimoto’s thyroiditis (HT) or chronic lymphocytic thyroiditis is the most prevalent autoimmune disease and the most common cause of hypothyroidism in the United States [9]. The disease most often occurs in young or middle-aged women and leads to progressive thyroid destruction and hormone production failure. The etiology of the thyroiditis is an organ-specific autoimmune response in which cytotoxic T cells, with the assistance of T-helper cells, are responsible for the direct destruction of thyroid cells, leading to hypothyroidism [10]. When examined histopathologically (Fig. 6.5a), the gland has either focal or diffuse lymphocytic infiltration with occasional germinal centers, small thyroid follicles with sparse colloid, and variable amounts of fibrosis [10–12]. HT develops in genetically predisposed individuals who are exposed to an environmental trigger [9–11]. Although all the triggers are not understood, pregnancy appears to be one of the important events leading to clinical thyroid dysfunction. The diagnosis is strongly suggested by an elevation of the thyroperoxidase (TPO) antibodies , which is highly sensitive and specific for this disease [13]. High serum TPO antibody concentrations are present in more than 90–95% of patients with Hashimoto’s thyroiditis [9, 10].
Figure 6.5
Hashimoto’s thyroiditis pathology (a) and ultrasound correlation (b). White circle and white arrows: hypoechoic lymphocytic infiltration. Blue circle and blue arrows: isoechoic thyroid follicular cells. Yellow arrows: hyperechoic fibrotic lines
Conventional B Mode Gray-Scale Ultrasound
The normal thyroid examined by ultrasound shows the parenchyma to be finely granulated (ground-glass appearance), and the echogenicity is similar to the salivary glands but of higher echogenicity compared to the adjacent strap muscles or sternocleidomastoid muscle [6] (Fig. 6.6). HT can be identified with ultrasound by hypoechoic changes in the thyroid (Figs. 6.5b and 6.6b) prior to thyroid dysfunction or elevation of the TPO antibody [14, 15]. Autoimmune thyroid disease may change the thyroid volume (normal values: women 12 mL, men 14 mL) and echogenicity of the thyroid gland. Raber quantified thyroid echogenicity into five grades (Table 6.3) and correlated the degree of change with thyroid function and TPO antibody levels [15]. The extent of echogenicity decrease accurately predicted autoimmune thyroiditis and thyroid dysfunction with a 96% probability. The positive predictive values (PPV) of grade 3 pattern (thyroid parenchyma is iso- or hypoechoic compared to strap muscles) for detection of autoimmune thyroiditis were 94% (with overt hypothyroidism) and 96% (with any degree of hypothyroidism). The negative predictive value (NPV) of grade 1 pattern (thyroid echogenicity similar to submandibular gland, hyperechoic to strap muscles) for detection of euthyroid and TPO antibody negative subjects was 91%. In this study, goiter (larger than normal) or atrophy of the gland did not correlate with TPO antibody status.

Figure 6.6
Normal thyroid compared to HT. (a) Normal size and echotexture. (b) Enlarged and hypoechoic echotexture of Hashimoto’s thyroiditis. The normal thyroid is brighter (hyperechoic) compared to the strap muscle. The HT gland is enlarged and hypoechoic and isoechoic compared to the SM. CA carotid artery, SM strap muscle
Table 6.3
Risk of autoimmune thyroiditis and echogenicity
Grade | Pattern | PPV/NPV (any TSH) |
|---|---|---|
Grade 1 | Echogenicity similar to submandibular gland, hyperechoic to strap muscles | NPV 91% |
Grade 2 | Hypoechoic compared to submandibular gland, hyperechoic to strap muscles | PPV 87% |
Grade 3 | Iso- or hypoechoic compared to strap muscles | PPV 96% |
The sonographic appearance of HT is extremely variable and depends on the degree of autoimmune involvement and the resulting patient-specific amount of follicular destruction, lymphocytic infiltration, and fibrosis. Figure 6.5 illustrates the ultrasound changes associated with the histopathology (follicular destruction, lymphocyte infiltration, and fibrosis) of HT. Early in the course of thyroiditis, the gland may be normal in size with a diffuse fine micronodular change, with increased diffuse vascularity by Doppler, with short echogenic fibrous bands within the parenchyma, and with an overall normal echogenicity (Figs. 6.7 and 6.8). Frequently, even with early HT and normal thyroid function, there may be benign reactive nodes located around the isthmus and inferior to each thyroid lobe (Figs. 6.7 and 6.9). The micronodular change in a normal size thyroid gland (Figs. 6.7, 6.8, and 6.9) or an enlarged thyroid (Fig. 6.10) with a diffuse increase in vascular flow by CDI can be seen before the overall thyroid echogenicity is significantly reduced and is an important signal that the patient has autoimmune thyroiditis.
Figure 6.7
Early HT. A normal size thyroid with diffuse fine micronodular change a few short fibrous hyperechoic (arrowheads) bands and peri-isthmus benign nodes (arrows). The overall echogenicity of the surrounding thyroid parenchyma of the surrounding thyroid parenchyma is normal and hyperechoic compared to the strap muscle (SM). (a) Right transverse view. (b) Medial sagittal view. (c) Transverse isthmus and left lobe view. (d) Transverse isthmus view
Figure 6.8
Early HT. A normal size thyroid with diffuse micronodular change, prominent hyperechoic fibrous bands (arrow), and mild increased vascularity by CDI. The overall echogenicity is normal and hyperechoic compared to the strap muscle (SM). (a) Right sagittal mid-lobe view. (b) Right sagittal medial lobe view
Figure 6.9
Early HT. (a) Right transverse image. (b, c) Right sagittal image. A normal size thyroid with more pronounced micronodular change (arrows). The overall echogenicity is normal and hyperechoic compared to the strap muscle (SM). A benign reactive node (arrowhead) is seen next to the isthmus. The vascular flow is minimally elevated by CDI. Note the increased vascular flow occurs in the normal parenchyma surrounding the micronodules
Figure 6.10
Early HT. (a) Right transverse view. (b) Right sagittal view. An enlarged thyroid with heterogeneous micronodular change (arrows). The overall echogenicity is normal and hyperechoic compared to the strap muscle (SM). The vascular flow is significantly elevated by CDI. CA carotid artery
As thyroiditis progresses, the gland enlarges and becomes more hypoechoic (Figs. 6.10 and 6.11). The entire gland increases in size with HT including the isthmus and pyramidal lobe. The enlarged pyramidal lobe may appear to be a nodule on transverse imaging (Figs. 6.12c and 6.13), but if the isthmus is scanned in transverse view from superior to inferior,the apparent mass (Fig. 6.12b) will be contiguous with the isthmus to create the HT pseudonodule type 1 (Table 6.4) without a distinct nodule margin.
Figure 6.11
HT. An enlarged, mildly hypoechoic thyroid with heterogeneous with micronodular change. The overall echogenicity is reduced but still more echogenic than the strap muscle (SM). (a) Right transverse view. (b) Right sagittal view. CA carotid artery
Figure 6.12
HT with a pyramidal lobe that mimics a nodule. A hypoechoic enlarged thyroid, isthmus, and pyramidal lobe with HT. The pyramidal lobe in the transverse view rostral to the isthmus gives the appearance of a pseudonodule (arrow; HT pseudonodule type 1). (a) Right transverse view. (b) Transverse isthmus. (c) Transverse pyramidal lobe. CA carotid artery
Figure 6.13
HT with a pyramidal lobe—HT pseudonodule type 1. (a) Pyramidal lobe, transverse view. (b) Pyramidal lobe, transverse + CDI. (c) Right sagittal view of thyroid with HT. This thyroid gland is enlarged with a heterogeneous echotexture with hyperechoic fibrous strands. The pyramidal lobe in the transverse view rostral to the isthmus gives the appearance of a pseudonodule (arrow; HT pseudonodule type 1)
Table 6.4
Types of HT pseudonodules
Type 1 | Enlarged pyramidal lobe with HT |  |
Type 2 | Hypoechoic micronodular change surrounding more normal parenchyma | 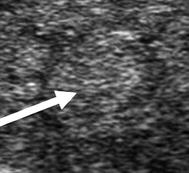 |
Type 3 | Hypoechoic micronodules 1–7 mm | 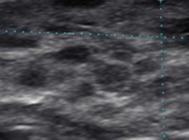 |
Type 4 | Tubercle of Zuckerkandl (posterior lateral thyroid tissue) | 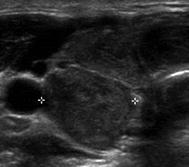 |
As HT progresses, the thyroid ultrasound develops more obvious fibrous bands, and increased parenchymal vascularity is seen with Doppler color imaging (Fig. 6.14). The thyroid parenchyma with HT becomes progressively coarser with patchy hypoechoic micronodular change (Fig. 6.14). The micronodular changes are poorly defined hypoechoic patches measuring 1–7 mm in size that can become confluent resulting in the appearance of pseudonodules (HT pseudonodule type 2) of the relatively normal isoechoic tissue surrounded by the hypoechoic micronodules (Fig. 6.15 and Table 6.4) [14, 16–18]. The hypoechoic patches can be relatively large (up to 7 mm) in a regular pattern that resembles the spots on a giraffe. The “giraffe” pattern has been reported as “innumerable” small hypoechoic nodules, but this is the type 3 pseudonodule (Figs. 6.9, 6.10, 6.16, and 6.17 and Table 6.4). The micronodular change is highly specific for HT with a PPV 95% [16]. The amount of fibrosis is variable with HT. Some HT glands have extensive fibrosis in the thyroid parenchyma. The fibrosis is seen on ultrasound as hyperechoic strands that often have vascular flow along them by CDI (Figs. 6.18 and 6.19). Fibrous bands may separate the thyroid parenchyma giving a false appearance of a nodule. Generally, when the area of concern is examined in orthogonal directions, a discrete nodule is not seen. The hypoechoic parenchyma of HT allows visualization of the hyperechoic thyroid capsule separating a normal anatomic variant, the tubercle of Zuckerkandl. The tubercle of Zuckerkandl is normal thyroid tissue derived from the fourth branchial cleft and the ultimobranchial body extending posteriorly from the posterior thyroid (Fig. 6.20). The tubercle of Zuckerkandl can be mistaken for a thyroid nodule on US imaging, but it is an important caveat that thyroid nodules are not surrounded by hyperechoic fibrous bands (Figs. 6.21 and 6.22). Care should be taken to examine the tubercle of Zuckerkandl for a true nodule that can be distinguished by a difference in echogenicity from the thyroid lobe, well-formed nodular margins, and peri-nodular vascular flow (Fig. 6.23).
Figure 6.14
HT and fibrosis. A slightly enlarged thyroid with micronodular change, prominent hyperechoic fibrous bands (arrows), and overall significant increased vascularity by CDI. The overall echogenicity is less than normal and similar to the strap muscle (SM). (a) Right sagittal view. (b) Right sagittal view + CDI
Figure 6.15
HT and pseudonodule type 2. The patchy hypoechoic regions coalesce to create pseudonodules that cannot be identified in the orthogonal image. The overall echogenicity is less than normal and similar to the strap muscle (SM). A pseudonodule (arrow; HT pseudonodule type 2) composed of relatively normal isoechoic tissue surrounded by hypoechoic micronodules. (a) Pseudonodule + CDI. (b) Pseudonodule
Figure 6.16
Giraffe pattern of HT and HT pseudonodule type 3. Distinct micronodular change (arrows) in a pattern that resembles a giraffe’s spots (a). The echogenicity of the thyroid (b) between the hypoechoic patches is normal and hyperechoic compared to the strap muscle (SM). These hypoechoic patches do not have a sharp margin and are an example of HT pseudonodule type 3. Photograph provided by Dr. Robert Levine.
Figure 6.17
Giraffe pattern of HT and HT pseudonodule type 3. (a) Right transverse image with color Doppler. (b) Right transverse image with color Doppler. (c) Right sagittal image. A slightly enlarged thyroid with distinct pronounced micronodular change (arrows). The overall echogenicity is normal and hyperechoic compared to the strap muscle (SM). The vascular flow by CDI is within the normal parenchyma and not the hypoechoic patches. These hypoechoic patches are thought to be focal deposits of lymphocytes. This is an example of HT pseudonodule type 3. CA carotid artery
Figure 6.18
Micronodular and fibrous change of HT in an enlarged thyroid. Distinct micronodular change with extensive hyperechoic strands of fibrosis. The echogenicity of the thyroid between the fibrous bands is hypoechoic and isoechoic compared to the strap muscle (SM). The vascular flow is minimally elevated especially along the fibrous bands by CDI. (a) Right transverse. (b) Right sagittal. (c) Left sagittal. (d) Left sagittal with CDI
Figure 6.19
Micronodular and fibrous change of HT in a normal size thyroid. Hypoechoic thyroid with hyperechoic strands of fibrosis. The echogenicity of the thyroid between the fibrous bands is hypoechoic (isoechoic compared to the strap muscle (SM)). The vascular flow is seen along the fibrous bands by Doppler analysis. (a) Left transverse image. (b) Left sagittal image. (c) Left sagittal + CDI
Figure 6.20
HT and the tubercle of Zuckerkandl. (a) Diagram of posterior view of the thyroid with an enlarged right posterior lateral tissue, the tubercle of Zuckerkandl. The hypoechoic parenchyma allows visualization of the double layer of hyperechoic capsule (arrowhead) separating the body of the thyroid from the tubercle of Zuckerkandl (TZ; arrow). (b) Right transverse view. (c) Right sagittal view. CA carotid artery
Figure 6.21
HT, Tubercle of Zuckerkandl and HT pseudonodule type 4. The echogenicity of the thyroid is hypoechoic and isoechoic with the strap muscle (SM). The hyperechoic thyroid capsule (arrow) separates the body of the thyroid from the tubercle of Zuckerkandl (arrowhead) creating a HT pseudonodule type 4. (a) Left transverse view. (b) Left sagittal view. CA carotid artery
Figure 6.22
HT, tubercle of Zuckerkandl, and pseudonodule type 4. The thyroid is enlarged and heterogeneous with patchy hypoechogenicity. The hyperechoic thyroid capsule (arrow) separates the tubercle of Zuckerkandl (arrowhead) from the body of the thyroid creating the HT pseudonodule type 4. (a) Right transverse view. (b) Right sagittal view. CA Carotid artery
Figure 6.23
HT and nodule in tubercle of Zuckerkandl. The hypoechoic parenchyma allows visualization of the hyperechoic thyroid capsule (arrow) separating a hypoechoic nodule (arrowhead) located in the tubercle of Zuckerkandl from the body of the thyroid. The nodule has a distinct margin and peripheral vascular flow (grade 3) by CDI. (a) Right transverse view. (b) Right sagittal view. CA carotid artery
The micronodular change and overall hypoechogenicity observed on ultrasound is thought to reflect lymphocytic infiltration [1, 19]. Diffuse decrease in thyroid echogenicity (Figs. 6.6b, 6.12, 6.13, 6.21, and 6.23) has a PPV for AITD of 88.3% [95% CI, 85–91%]. Hashimoto’s thyroiditis can be detected by ultrasound before clinical disease or the presence of serum TPO antibodies [14]. A prospective study demonstrated that diffuse hypoechogenicity was a better sensitivity (100% vs 63.3%) at predicting current or future thyroid dysfunction than TPO antibody level [20]. However, the ability of observers to reliably detect degrees of thyroid hypoechogenicity is poor (generalized κ = −0.002–0.781) and depends on the US equipment, equipment settings, and experience of the observer [21, 22]. One attempt to normalize detection is to use histogram analysis that does not depend on equipment or US settings. The degree of hypoechogenicity assessed by this standardized method called the histogram analysis of gray scale is associated with higher TSH levels [21, 23].
Clinically, hypothyroidism can be categorized as goitrous or atrophic thyroiditis (Ord’s thyroiditis ; Fig. 6.24) [9, 24]. Although it is assumed that the US changes of thyroiditis starts with an enlarged gland with hypoechoic micronodules, progresses to the diffusely hypoechoic gland with fibrous bands, and ends with a small hypoechoic atrophic gland, this progression has never been specifically documented. Recent investigations suggest that HT is a multifaceted disease including various subtypes which exhibit distinct clinicopathological characteristics [25]. Several subclassification schemes of HT have been introduced [11]. The fibrous variant of HT is regarded as end stage of HT, but IgG4 thyroiditis may overlap the so-called fibrous variant of HT to a large extent because of the close histologic similarities [25, 26] (Fig. 6.25). Recently, the enlarged, very hypoechogenic gland (Figs. 6.6b, 6.11, and 6.12) has been associated with a new syndrome of IgG4-related sclerosing systemic disease. IgG4-related sclerosing disease is a systemic disease that is characterized by elevated gamma globulins with a predominant increase in IgG4 levels with lymphoplasmacytic infiltration, fibrosis, obliterative phlebitis, and increased numbers of IgG4-positive plasma cells in affected organs [27]. It has suggested there are four types of IgG-related thyroid disease including IgG4-related HT, fibrosing variant of HT, Graves’ disease with elevated IgG4, and Riedel thyroiditis [28]. IgG4 Hashimoto’s thyroiditis showed higher grade of stromal fibrosis, lymphoplasmacytic infiltration, and follicular cell degeneration than non-IgG4 thyroiditis [25]. IgG4 thyroiditis is associated with younger age, male gender, subclinical hypothyroidism with a large and diffusely hypoechoic thyroid gland on ultrasound, and higher level of circulating thyroid antibodies [28, 29]. Prospective studies will need to be performed to determine if the variable sonographic appearances of HT is a continuum or whether they represent different variants of Hashimoto’s thyroiditis.