Diffusion weighted imaging is an important tool for evaluating brain tumors and can be used for diagnosis, follow-up, and determining the prognosis.
Apparent diffusion coefficients (ADCs) are inversely correlated with high cellularity.
A reduced extracellular to intracellular space ratio and a high nuclear to cytoplasm ratio are correlated to reduced ADC.
In atypical meningiomas there is an inverse correlation between ADC (lower ADCs are markers of high cellularity) and Ki-67 expression (high Ki-67 expression is a marker of high cell proliferation).
Primary central nervous system lymphoma usually demonstrates restricted diffusion due to its histology: the high degree of cellularity and the high nuclear to cytoplasm ratio.
Diffusion imaging sequences can be used to assess posttreatment changes and may serve as an early biomarker tool for predicting treatment outcomes, monitoring treatment response, and detecting recurrent cancer.
7.1 Introduction
Conventional magnetic resonance imaging (MRI) has some limitations when used to evaluate brain tumors. Differential diagnoses between cystic lesions, primary or secondary (metastasis) brain tumors, and glioma grading usually demand the use of advanced MRI techniques.1,2,3,4 Diffusion weighted imaging (DWI) is an important tool for the evaluation of brain tumors. It can be used for diagnosis, follow-up, and determining the prognosis. Diffusion tensor imaging (DTI) parameters such as fractional anisotropy (FA), radial diffusivity (RD) and axial diffusivity (AD) are also used for brain tumor evaluation.2
Tumor cell density increases with tumor grade and impedes membranes, thereby causing the apparent diffusion coefficient (ADC) values to decrease. Thus an inverse correlation has been proposed between tumor cellularity and ADC values that can be helpful to noninvasively distinguish low- and high-grade gliomas.3,4 Moreover, some specific neoplasms, such as lymphoma and medulloblastoma, have higher nucleus to cytoplasm ratios and are characterized by low ADC values.5,6 The location of the restricted diffusion (in the central core or in the peripheral tissue) helps to differentiate tumors from cystic lesions.1,2 ADC may serve as a prognostic tool for patients with neoplasm. Low ADC values before treatment correlate with poor survival in malignant astrocytomas.3 Alternatively, low ADC values along the surgical cavity may indicate good prognoses.7,8 In posttreatment evaluation, differentiating between pseudoresponse, pseudoprogression, and tumor recurrence is critical for follow-up.8 DWI and DTI parameters are based on water diffusion within the microstructure of brain tissue and can be of great clinical importance in the posttreatment follow-up.
7.2 Clinical Applications
7.2.1 Differentiation between Cystic Brain Lesions
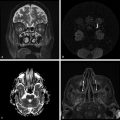
Glioblastoma multiforme, cystic/necrotic metastasis, and abscesses may appear quite similar on conventional MRI. They appear mostly as peripherically enhancing expansive lesions surrounded by a perilesional hyperintensity on T2-WI. DWI can be helpful to differentiate tumors from abscesses because fluid-filled abscesses have high signal intensity on DWI with reduced ADC values in their centers (▶ Fig. 7.1). The restricted diffusivity in abscesses is due to the high viscosity of the fluid inside the cavity, which leads to reduced water diffusion,2 whereas the enhancing ring is a fibrous capsule formed by organized collagen fibres.1 On the other hand, the cavity of a tumor is necrotic and usually not associated with restricted diffusion. Likewise, the enhancing portion of a tumor is due to viable tumor cells,1 which may demonstrate restricted diffusion secondary to high cell density. Nevertheless, DTI can help to differentiate brain abscesses from necrotic neoplasms.1,2 Depending on the organization of viable inflammatory cells inside abscesses, the FA values can be higher in abscesses than in the cystic/necrotic cavities of tumors. Higher FA values in abscess walls are due to the presence of concentric layers of collagen fibers rather than neoplastic cells in the tumor wall.1
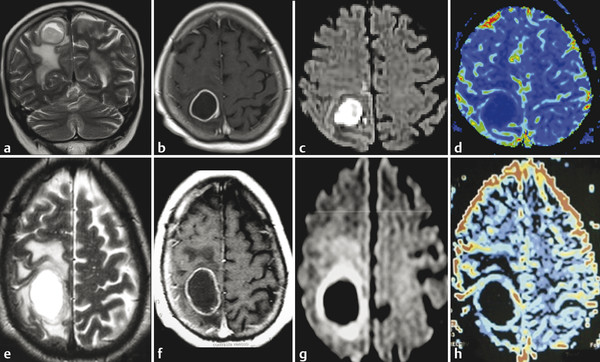
Fig. 7.1 (a) T2-weighted image (T2-WI), (b) enhanced T1-weighted image (T1-WI), (c) diffusion weighted image (DWI), and (d) relative cerebral blood volume (CBVr) map in a case of pyogenic abscess, which has restricted diffusion on the center of the lesion due to the pus. In another case (e) T2-WI, (f) enhanced T1-WI, (g) DWI, and (h) CBVr map show a glioblastoma multiforme with similar signal characteristics on conventional sequences, showing restricted diffusion at the periphery of the lesion on DWI and areas of high perfusion in the tumor wall on the CBVr map.
7.2.2 Tumor Grading and Infiltration
Tumor grading is essential for treatment decisions and prognosis. Conventional MRI sequences enable exact anatomical localization, treatment planning, and follow-up, but do not provide substantial information regarding cellular composition of tumors, grade, or tumor infiltration, which are better addressed by advanced MRI techniques.4 Identifying the boundaries between tumors, infiltrating cells, peritumoral edema, and normal brain parenchyma is crucial for preoperative planning. DWI and DTI are widely used techniques for these purposes due to their capabilities to image the brain microstructures.2,4,9 Generally, tumor cell proliferation increases tumor cellularity, whereas apoptosis reduces tumor cellularity. Both affect the extracellular space surrounding tumors.9 Some local factors, such as high cellularity, the shape of the extracellular space characterized by reduced ratios of extracellular to intracellular space,9 as well as high nuclear to cytoplasmic ratios, affect diffusion.2 ADC is inversely correlated with high cellularity, and the changes in the intra- and extracellular spaces already mentioned restrict diffusion of water molecules.2,3
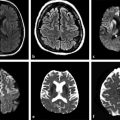
The meta-analysis conducted by Chen et al9 to evaluate correlations between ADC and cellularity in all cancer types suggested that DWI can be used as a biomarker for tumor cellularity. Malignant tumors have larger nuclei, richer stroma, and higher cell numbers. These features restrict diffusion and reduce ADC values compared with benign tumors. DWI can also differentiate between high- and low-grade gliomas in most cases. Lower ADC values are measured in high-grade gliomas (World Health Organization [WHO] grades III and IV) due to their higher cellularity compared with low-grade gliomas (WHO grade II).2,4,10 Nevertheless, some overlap can happen and is probably due to the high histopathological heterogeneity in gliomas (▶ Fig. 7.2).2,10
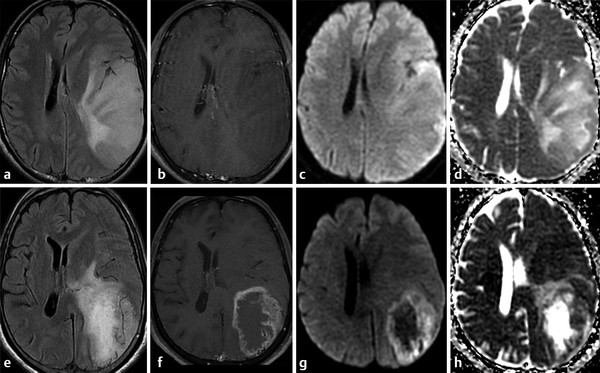
Fig. 7.2 (a) Fluid-attenuated inversion recovery (FLAIR) and (b) enhanced T1-weighted image (T1-WI) show an infiltrating low-grade glioma, which has no restricted diffusion (c) DWI and (d) ADC map. In another case, a high-grade glioma (e) FLAIR and (f) enhanced T1-W with peripheral areas of restricted diffusion and a necrotic center with facilitate diffusion (g) DWI and (h) ADC map
DTI parameters have also been used to differentiate high- and low-grade gliomas. The most controversial findings regarding this differentiation are for fractional anisotropy (FA). No differences in FA values have been observed in some studies, which is consistent with disorganization of fiber tracts in the tumor center. However, some studies have made the unlikely observation of increased FA values in high-grade gliomas compared to low-grade gliomas. The possible mechanisms remain controversial, including different methodologies employed by these studies and the potential for hypercellularity to reduce the extracellular space and thus increase the directionality of water diffusion, leading to increased FA values.10,11 Although FA is not yet a reliable tool for grading gliomas, other DTI parameters may be more useful.10 Radial Diffusivity (RD) and Axial Diffusivity (AD) are higher in low-grade gliomas than in high-grade gliomas, reflecting an inverse relationship between AD and RD, and glial tumors of WHO grades II through IV.10
Differentiating a solitary metastasis from a primary brain tumor may be challenging in some clinical scenarios. ADC values in metastases are lower than in low-grade gliomas, but ADC values measured at the peritumoral hyperintensity area are higher in metastases. The higher ADC in the periphery of metastases is likely explained by increased vasogenic edema,4 increased extracellular space, which has a linear correlation with diffusivity.12 The intratumoral FA values are greater in low-grade gliomas compared to metastases, explained by less cellular proliferation and vascularization in low-grade tumors.
On the other hand, the evaluation of peritumoral brain tissue reveals higher ADC values in metastases due to vasogenic edema compared to peritumoral cell infiltration described in high-grade gliomas.4,11,13 A previous study suggested a cutoff value of 1.302 × 10⁻³ mm2/s for the minimum peritumoral ADC to optimize sensitivity and specificity for distinguishing between glioblastoma multiforme and metastases.11 However, other studies considered ADC values < 1.200 × 10⁻³ mm2/s to suggest cell infiltration and that ADC values > 1.600 × 10⁻³ mm2/s are suggestive of vasogenic edema.13 The values in between these correspond to a combination of cell infiltration and edema and thus cannot be used to distinguish these lesions.13 The width of the tumor infiltration in high-grade gliomas can also be evaluated by ADC values. Lower ADC values were measured closest to the tumor border. Alternatively, ADC values measured in the abnormal hyperintensity surrounding metastatic lesions on T2-weighted images (T2-WIs) remain constant.13
DTI analysis of the peritumoral region demonstrated higher FA values in high-grade gliomas when compared to metastases. This observation may be explained by the fact that gliomas have infiltrating tumor cells in their surrounding parenchyma, restricting water diffusivity and increasing FA. Alternatively, the area surrounding the metastases is composed of vasogenic edema and white matter (WM) tract displacement, which reduces FA.4,11 Previous reports have, however, demonstrated the utility of FA analysis of the perilesional region to distinguish metastases from primary brain tumors, but these results are still controversial.4,11,12 Because tumor cell infiltration is known to damage myelinated neurofibers, this could reduce FA values.12 The culmination of the effects of histological abnormalities that occur in the peritumoral brain tissue will ultimately determine FA values. Overlap between FA values from infiltration and edema may occur.12 Indeed, AD and RD may help to distinguish these. The rapid increase of RD values in the tumor-infiltrated area may be associated with myelin sheath destruction when compared to the stable AD and RD increases associated with vasogenic edema in the extracellular space.12
7.2.3 Patterns of Peritumoral White Matter Tracts
Maximal resection is a goal of brain tumor treatment. Identifying tumor borders and peritumoral brain tissue is crucial to surgery success, but difficult to establish in high-grade gliomas. Previous reports have demonstrated that DWI and DTI measurements may play an important role in the assessment of the peritumoral area. These techniques, especially color-coded FA maps and tractography, can identify different patterns of WM tract involvement.2,14
The first pattern described consists of normal or only slightly decreased FA values with an abnormal location or direction resulting from bulk mass displacement. This pattern suggests that the main WM tract is intact and thus could be preserved during resection. The tract can also be better identified on tractography and on color-coded FA maps. The second pattern is probably related to vasogenic edema. FA is substantially decreased, but the main fiber tracts remain with normal locations and have normal directionality that is represented by normal colors on directional color maps, whereas color intensity is reduced. The following pattern is characterized by substantially decreased FA values with abnormal colors on directional color maps. The color change cannot be attributed to a bulk effect as with disrupted tracts most frequently seen in infiltrating gliomas. The last pattern described consists in an isotropic or almost isotropic diffusivity within the lesion. In this pattern, the tracts cannot be identified on directional color maps and is observed when some portion of the tract is completely destroyed by the tumor and is commonly observed in high-grade gliomas. This pattern may be useful in preoperative planning, relying on the notion that the main WM tracts are already disrupted so no special care is required to avoid damage during ressection.14
Although these are classical patterns of WM tracts, disturbances in the peritumoral area better illustrates their involvement. A combination of patterns may occur, such as displacement, infiltration, and edema, and these may limit the clinical application of these patterns for tumor grading and differential diagnoses.2,14 As a result, the main clinical application of DTI and tractography in brain tumors is presurgical planning (▶ Fig. 7.3).
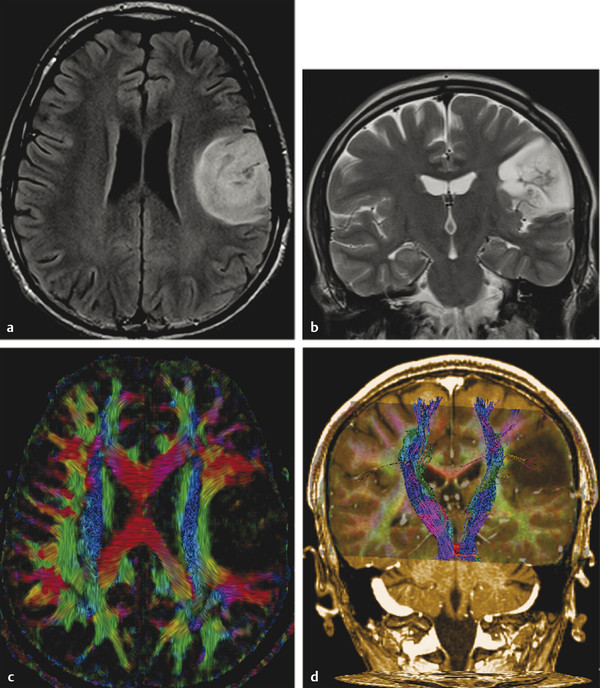
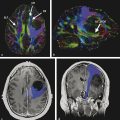
Fig. 7.3 (a) Axial fluid-attenuated inversion recovery and (b) coronal T2-weighted image show a postsurgical partially removed World Health Organization grade II oligodendroglioma. After deciding to reoperate the tumor, the surgeon was in doubt regarding the relationship between the lesion and the corticospinal tract and the superior longitudinal fasciculus. (c) Fractional anisotropy color map shows the deviation of the superior longitudinal fasciculus due to the mass effect of the lesion. The tractography fused with (d) T1-weighted image demonstrates minimal deviation of the left corticospinal tract, as well as a surgical plane between the tract and the tumor.
Related posts:
 Diffusion Weighted and Diffusion Tensor Imaging in Aging
 Supratentorial White Matter Tracts and Their Organization
 Brain Edema: Pathophysiology
 Diffusion Weighted Imaging and Diffusion Tensor Imaging in Head and Neck Diseases
 Diffusion Weighted and Diffusion Tensor Imaging in Infectious Diseases
 Physics of Diffusion Weighted and Diffusion Tensor Imaging
Stay updated, free articles. Join our Telegram channel

Full access? Get Clinical Tree


