Eloquent brain function emerges from the coordinated activity of multiple cortical and subcortical brain regions; the white matter defines a supporting network for the efficient transfer of information of these regions within and between cerebral hemispheres.
Although the organization of white matter is complex, diffusion magnetic resonance imaging (MRI) consistently visualizes a relatively small group of association (intrahemispheric), commissural (interhemispheric), and projection (afferents or efferents from the periphery to the brain) pathways.
Precise delineation of white matter tracts requires diffusion data of high technical quality, reconstruction algorithms capable of representing complex white matter architecture, and familiarity with normal connectional anatomy.
Color fractional anisotropy (FA) images and fiber tractography can be used to understand the location of normal white matter tracts, infiltration and distortion of tracts, and the relationship between lesions and surrounding pathways.
3.1 Introduction
Beneath the convolutions of the gray matter of the cerebral hemispheres lies the white matter, a woven mass of brain tissue composed of myelinated axons and supporting glial cells. The uniform signal intensity of the white matter on conventional anatomical imaging belies a highly complex network of pathways interconnecting different brain regions and exchanging information with the peripheral nervous system through the spinal cord and cranial nerves. This intricate architecture serves as the scaffolding for higher brain function and as the target of many neurological disorders. An understanding of basic connectional neuroanatomy is essential for the radiologist to relate symptoms to lesion location, to guide neurosurgical interventions in the brain, and to recognize tumors and other diseases that spread along white matter tracts.
This chapter is written for the reader interested in developing a practical understanding of white matter anatomy. The chapter begins by briefly outlining technical aspects of diffusion imaging relevant to the accurate depiction of fiber tracts. The location and function of the supratentorial white matter pathways that are most consistently visualized with modern 3 tesla clinical diffusion protocols are then summarized. Given space constraints, the discussion necessarily omits cerebellar and brainstem tracts. The reader specifically interested in brainstem tractography is referred to a number of excellent papers on the subject.1,2,3
3.2 Technical Considerations
As discussed elsewhere in this text, the addition of a diffusion gradient to a magnetic resonance imaging (MRI) pulse sequence renders acquired images sensitive to the random motion of water molecules along directions parallel to the orientation of the diffusion gradient.4,5 Early experiments revealed that brain images vary significantly with changes in the direction of the applied diffusion gradient; diffusion is highly anisotropic in white matter. In addition to this orientational variability, varying the strength of the gradient (the diffusion weighting, or b value) sensitizes the image to water diffusing over different distances; stronger gradients encode motion over smaller distances (tens or hundreds of micrometers), and weaker gradients are sensitive only to bulk shifts in water occurring over larger distances (millimeters). By systematically varying the magnitude and direction of the applied diffusion gradients, it is possible to characterize the probability of water movement over various spatial scales along each direction in space.
Restricted by microscopic cellular barriers, especially neuronal and myelin membranes, diffusion preferentially occurs along directions parallel to axons. Within each voxel, the relationship between the diffusion sensitized image data and the three-dimensional white matter architecture depends on the technique that is used to represent the underlying diffusion probability. Diffusion tensor imaging (DTI), high angular resolution diffusion imaging (HARDI), and diffusion spectrum imaging (DSI) are three different classes of diffusion acquisition and reconstruction strategies.6 From a data acquisition standpoint, DTI can be performed with a relatively small number of measured directions and low b values, making the technique fast and easy to achieve using lower-specification gradient coils than are used with HARDI and DSI. These advantages come with the important shortcoming that DTI is unable to represent more than one fiber population within each voxel, a significant drawback in light of the fact that 90% or more of the white matter contains more than a single fiber population.7
By acquiring a larger number of diffusion directions with stronger diffusion weighting, HARDI can overcome this limitation and reveals multiple crossing fibers (at the expense of longer imaging times and a requirement for high-performance gradient coils). DSI, which probes diffusion over multiple b values and diffusion directions, permits an even more complete characterization of intravoxel diffusion. However, long imaging times and low signal-to-noise ratios preclude DSI in patients on clinical scanners at the present time. At the time of this writing, white matter mapping at our institution is accomplished in clinical patients within a 7 minute scan time at isotropic 2.2 mm spatial resolution (55 diffusion directions with b = 2,000 or 3,000 s/mm2) using a 3 tesla MRI scanner equipped with an eight-channel coil. With continued improvements in technology, such as multiband and multichannel parallel imaging acquisition, it is likely that DSI too will soon find its way into clinical practice.
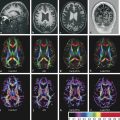
Diffusion data are used to generate an estimate of water diffusion probability in three dimensions within each voxel in space (a six-dimensional function!). This complex function is conveniently visualized in DTI using color-encoded maps of fractional anisotropy (FA). With these images, the intensity of each voxel represents the directional coherence of diffusion, and the color encodes the dominant direction of diffusion. The standard color scheme is to use red for left–right diffusion orientation, green for posterior–anterior, and blue for inferior–superior (note that diffusion is not able to distinguish polarity, however, and that right–left diffusion appears the same as left–right diffusion, etc.). ▶ Fig. 3.1 and ▶ Fig. 3.2 show how color FA maps can be useful to localize lesions within specific white matter tracts.
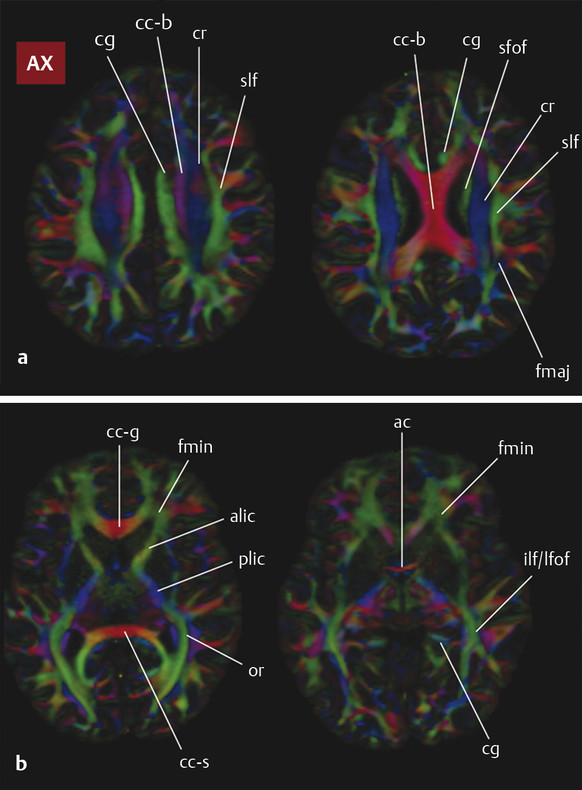
Fig. 3.1 Axial color fractional anisotropy maps at four levels through a normal brain, (a) from the level of the corona radiata through (b) the anterior commissure with white matter structures labeled. ac, anterior commissure; alic, anterior limb internal capsule; c-g, genu of the corpus callosum; cc-b, body of the corpus callosum; cc-s, splenium of the corpus callosum; cg, cingulum bundle; cr, corona radiata; fmaj, forceps major; fmin, forceps minor; fx, fornix; ifof, inferior fronto-occipital fasciculus; ilf, inferior longitudinal fasciculus; or, optic radiation; plic, posterior limb internal capsule; sfof, superior fronto-occipital fasciculus; slf, superior longitudinal fasciculus; and uf, uncinate fasciculus.
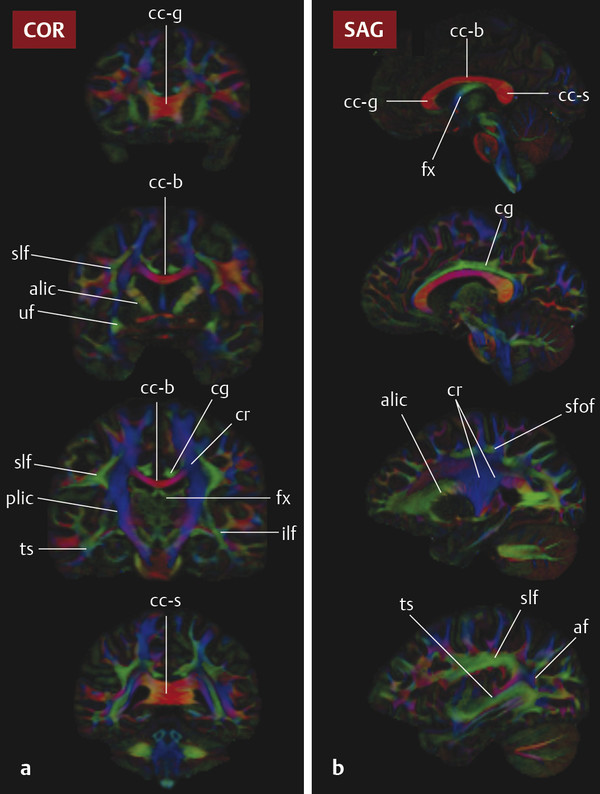
Fig. 3.2 (a) Coronal and (b) sagittal color fractional anisotropy maps at four levels through a normal brain. From the top row down, coronal images are from anterior to posterior and sagittal images are from the midline to the lateral aspect of the brain. ac, anterior commissure; alic, anterior limb internal capsule; c-g, genu of the corpus callosum; cc-b, body of the corpus callosum; cc-s, splenium of the corpus callosum; cg, cingulum bundle; cr, corona radiata; fmaj, forceps major; fmin, forceps minor; fx, fornix; ifof, inferior fronto-occipital fasciculus; ilf, inferior longitudinal fasciculus; or, optic radiation; plic, posterior limb internal capsule; sfof, superior fronto-occipital fasciculus; slf, superior longitudinal fasciculus; and uf, uncinate fasciculus.
Fiber-tracking algorithms further exploit the estimated diffusion probabilities to follow axonal bundles through space from voxel to voxel and thereby identify specific tracts. These algorithms can be divided into deterministic and probabilistic techniques; the former following “streamlines” from individually placed “seed regions” and the latter exploiting uncertainty in the measurements in order to define a probability of connectivity of each voxel with adjacent voxels.8,9 Probabilistic techniques are more robust in that they more accurately estimate tract extent, but they are less specific because they are more likely to result in spurious estimates of connectivity. Most clinical diffusion applications to date use deterministic tractography methods such as fiber assignment by continuous tracking (FACT), a technique initially introduced more than a decade ago.10
Most current tractography algorithms perform “whole brain” tractography, in which connectivity throughout the brain is precomputed. This results in a set of “streamlines” throughout the brain, each corresponding to a single putative connection between two specific brain regions. Using anatomical landmarks and familiarity with connectional anatomy, regions of interest (ROIs) are then placed by the operator to cull specific tracts in a process that has been referred to as virtual dissection. The resulting pathways can then be assessed visually for distortion from locally destructive lesions, infiltrative disease, or other abnormalities. In many centers, they can also be incorporated directly into neurosurgical navigation systems to display white matter tracts of interest in relation to lesions undergoing open surgical intervention.
Streamlines, whittled by the expert into recognizable tracts, do not represent true neuronal fibers. But together the streamlines provide an estimate as to the spatial extent of a tract of interest in the individual patient. Tractography is powerful but biased in this regard, however, and it is important to remember several caveats when interpreting streamlines and the results of tractography.11 First, tracts represent the final product of a multistep reconstruction process and are thus prone to accumulation of errors. The radiologist should always review the original data for acquisition artifacts and patient motion. ROIs used to delineate tracts must be carefully defined. Second, tractography is highly dependent on the spatial resolution and signal-to-noise quality of the acquired diffusion data. The extent of tracts may be under- or overestimated with low spatial resolution, and spurious tracts should be anticipated with noisy data. Third, the results of tractography vary with multiple other technical factors, including the b value and the number of acquired diffusion directions. It is thus recommended that radiologists performing tractography settle on a single acquisition and reconstruction protocol and become familiar with the appearance of tracts that are achieved with this technique. Finally, it is important to emphasize that streamlines in tractography are mathematical entities, not actual fibers, and as such their distribution does not directly correlate with the properties of the underlying axons. For example, the density of the streamlines visualized within a pathway is not directly proportional to the packing density of the neurons within that tract. Subject to these provisos, tractography is a powerful tool for radiologists to use to understand white matter organization in the individual patient.
3.3 White Matter Tract Categorization
Current knowledge of white matter organization derives from both invasive tract tracing and tract dissection studies in specimens and primate models, and from diffusion fiber tractography in normal volunteers.12,13,14 Based on the nature of the information that they carry, supratentorial fiber tracts can be assigned into one of three categories:
Association pathways are intrahemispheric tracts that interconnect different cortical areas within the same hemisphere. Short “subcortical U” fibers that link adjacent gyri are short association tracts; bundles in the deep white matter have a much greater physical length. Because longer association tracts are frequently oriented from anterior to posterior, association fibers often appear green on color FA images.
Commissural pathways are interhemispheric tracts that link cortical or subcortical areas across hemispheres. These are described as either homotopic, connected to homologous regions in either hemisphere, or heterotopic, spanning different areas within each hemisphere. Commissural tracts are often red (right–left oriented) on color FA maps.
Projection tracts originate (motor) or terminate (sensory) in the cortex and connect the cortex to subcortical structures such as the basal ganglia, cerebellum, or spinal cord. Many of these tracts are blue (craniocaudally oriented) on color FA images. Afferent and efferent nerve bundles conveying information through cranial nerves, such as the optic radiations, are also considered to be projection fibers. In what follows, the most commonly described white matter tracts are organized into three categories: association tracts, commissural pathways, and projection tracts.
3.3.1 Association Tracts
The association tracts include the cingulum bundle, superior longitudinal fasciculus, arcuate fasciculus, inferior longitudinal fasciculus, uncinate fasciculus, and fronto-occipital fasciculi.
Cingulum Bundle
The cingulum (Latin for “band” or “belt”) bundle (CB) is a belt-shaped tract with an inferior segment that lies within the temporal lobe and a superior frontoparietal portion that encircles the corpus callosum (▶ Fig. 3.3). Part of the limbic circuit of Papez, the CB is a bidirectional conduit for information transfer between different elements of the limbic system and between the limbic system and the hemispheres. Fibers within this tract travel within the cingulate gyrus superiorly and within the parahippocampal gyrus of the temporal lobe inferiorly, making these bundles easy to visualize as paired green structures surrounding the corpus callosum on color FA maps (▶ Fig. 3.1 and ▶ Fig. 3.2). The CB contains both short- and long-association fibers; the proportion of long fibers connecting the frontal and temporal lobes is small compared to the number of short fibers joining and leaving the bundle along its length. The anterior component of the CB has been tied closely to emotion and behavior, whereas the more posterior (“retrosplenial cingulum”) and inferior (“parahippocampal cingulum”) portions are important for cognitive functions, including attention, spatial orientation, and memory.15 Abnormalities within the CB have been linked to a variety of disorders, including traumatic brain injury, depression, and schizophrenia. Declining FA within the parahippocampal cingulum may be useful for discrimination of mild cognitive impairment from normal aging in the setting of hippocampal atrophy.16 The CB also serves as a major pathway for seizure propagation.
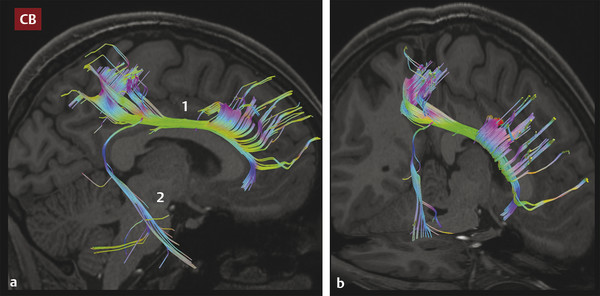
Fig. 3.3 (a) Sagittal and (b) oblique images showing tractography of the cingulum bundle (CB), depicting the anterior arm (1) of the tract extending posteriorly around the corpus callosum (the retrosplenial cingulum) to enter the ipsilateral temporal lobe (2) as the parahippocampal cingulum. Note the dense contributions to this tract from the anterior frontal and parietal white matter.
Related posts:
 Diffusion Weighted Imaging in the Evaluation of Brain Tumors
 Diffusion Weighted Imaging in Hemorrhage
 Diffusion Weighted and Diffusion Tensor Imaging in Aging
 Diffusion Weighted Imaging and Diffusion Tensor Imaging in Head and Neck Diseases
 Diffusion Weighted and Diffusion Tensor Imaging in Infectious Diseases
 Physics of Diffusion Weighted and Diffusion Tensor Imaging
Stay updated, free articles. Join our Telegram channel

Full access? Get Clinical Tree


