The pattern of evolving hematomas on conventional magnetic resonance imaging (MRI) is well documented but remains somewhat complex, and its interpretation is further complicated by diffusion weighted imaging (DWI).
T2 shine-through, T2 blackout effects, and susceptibility artifacts from blood products contribute to the appearance of hemorrhage on DWI and influence the apparent diffusion coefficient (ADC) measurements. Therefore, DWI of hemorrhage should be interpreted cautiously and in conjunction with T2- and T2*-weighted MRI.
According to recent studies, DWI is accurate in detection, characterization, and staging of intraparenchymal hematomas; however, it should not be interpreted alone but in conjunction with other sequences. It is also accurate for detection of hemorrhagic venous infarcts or hemorrhagic transformation of arterial infarcts and subdural and epidural hematomas.
Conversely, DWI has low diagnostic accuracy in microbleeds and acute subarachnoid hemorrhage and should not be used in the latter.
12.1 Introduction
Intracranial hemorrhage diagnosis and characterization depend on imaging studies because clinical signs and symptoms are usually nonspecific. Hemorrhage can be classified based on its location as (1) intra-axial, including parenchymal and intraventricular hemorrhages; and (2) extra-axial, including epidural, subdural, and subarachnoid hemorrhage, which may occur in isolation or in different combinations depending on the underlying etiology.
Computed tomography (CT) is commonly the first imaging modality used for suspected intracranial hemorrhage evaluation. Acute blood is markedly hyperdense compared to brain parenchyma, making its easy to diagnose. However, after the acute phase, CT provides little information regarding the precise stage of the hemorrhage, and because subacute hemorrhage becomes progressively less dense in a few days, CT’s utility is confined to the acute period.
Conversely, magnetic resonance imaging (MRI) has excellent capabilities to determine the presence of blood, its underlying etiology, and the age of the hemorrhage. The MRI appearance of intracranial hemorrhage primarily depends on the oxygenation of hemoglobin, the chemical state of its iron-containing moieties, the integrity of the red blood cells (RBCs), and the MRI sequences and/or parameters used (▶ Table 12.1). Other factors that influence the MRI appearance of blood are the hemorrhage location, the local partial pressure of oxygen, the local pH, the hematocrit, the local glucose concentration, the hemoglobin concentration, the integrity of the blood–brain barrier, and the patient’s temperature.1
Stage of the hematoma | Time (days) | Hemoglobin | T1-WI | T2-WI | GRE | DWI |
Hyperacute | < 1 | Oxyhemoglobin (intracellular) | Iso/Hypo | Hyper | Iso/Hyper | Hyper (core) Hypo (rim) |
Acute | 1–3 | Deoxyhemoglobin (intracellular) | Iso/Hypo | Hypo | Hypo | Hypo |
Early subacute | 3–7 | Methemoglobin (intracellular) | Hyper | Hypo | Hypo | Hypo |
Late subacute | > 7 | Methemoglobin (extracellular) | Hyper | Hyper | Hyper | Hyper |
Chronic | > 14 | Ferritin and hemosiderin (extracellular) | Iso/Hypo | Hyper/Iso Hypo (rim) | Iso/Hyper Hypo (rim) | Iso/Hypo Hypo (rim) |
Abbreviations: DWI, diffusion weighted imaging; Iso, isointense; GRE, gradient-recalled echo imaging; Hyper, hyperintense; Hypo, hypointense; T1-WI, T1-weighted image; T2-WI, T2-weighted image. | ||||||
The characteristic MRI intensity patterns observed during the evolution of the hematomas are well known. Hyperacute hematomas show low to isointense signal on T1-weighted images and hyperintense signal on conventional T2-weighted images with a peripheral thin and irregular hypointense rim.2 This pattern represents oxyhemoglobin forming the bulk of the hematoma with early deoxyhemoglobin at the periphery, and because oxyhemoglobin produces no paramagnetic effects it is a reflection of the water contained in blood.2 Acute hematomas are seen as hypointense lesions on T2-weighted images3 with isointense signal on T1-weighted images.4 Although multifactorial, it has been generally accepted that the basis of this signal loss on T2-weighted images is mainly related to the intrinsic heterogeneity of magnetic field gradients due to compartmentalized paramagnetic deoxygenated blood.3,5,6,7 Similarly, “early subacute” hematomas are hyperintense on T1-weighted images and markedly hypointense on T2-weighted images, due to the presence of methemoglobin within intact RBCs.3 Over several days to weeks, the energy status of the RBCs declines, causing a loss of cellular integrity, and cellular lyses. In this late subacute phase, hematomas show an increased T1 and T2 signal intensity caused by the extracellular methemoglobin. Over months, the hematoma enters the chronic phase. The center of the hematoma may evolve into a fluid-filled cavity with signal intensity identical to that of cerebrospinal fluid (CSF). The walls of the cavity show low signal on T1- and T2-weighted images, related to extracellular hemosiderin and ferritin outside and within macrophages, and may collapse, leaving behind a thin, fluid-filled slit.
Despite the frequent use of conventional MRI to evaluate the extent, location, and underlying mechanism of intracranial hemorrhages, diffusion weighted imaging (DWI) has also been studied and used in this setting. DWI is not the best sequence for evaluation of intracranial hemorrhage; however, it is helpful to recognize blood’s signal intensity changes over time to reduce the risk of misdiagnosis. Furthermore, the primary assessment of patients with early stroke is moving toward MRI, and DWI may play a crucial role in the emergent evaluation of these patients.8,9,10 In this context, understanding the appearance of intracerebral hemorrhage on DWI is critical to instituting appropriate stroke management because hemorrhage is a contraindication for thrombolytic therapy.
On DWI, restricted diffusion shows hyperintensity, whereas fast diffusion shows hypointensity. However, because there is a contribution from the T2 echo-planar spin-echo baseline image to DWI signal intensity, not all areas of high signal intensity represent restricted diffusion, an effect termed T2 shine-through, and also not all areas with low signal represent fast diffusion, an effect known as T2 blackout effect.4 These concepts are particularly important when interpreting the appearance of hemorrhage on DWI, and they influence the measurements of its apparent diffusion coefficient (ADC) values.
12.2 Clinical Applications
12.2.1 Intracerebral Hematomas
Hyperacute Hematomas
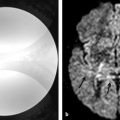
On DWI, hyperacute hematomas show a heterogeneous hyperintense core with focal areas of hypointensity surrounded by a peripherally hypointense incomplete rim11,12,13 (▶ Fig. 12.1 and ▶ Fig. 12.2). The central hyperintensity probably represents intracellular oxyhemoglobin because it is also isointense on T1-weighted images, heterogeneously hyperintense on T2 and fluid-attenuated inversion recovery (FLAIR) images, with a variable appearance on gradient-echo images, but usually heterogeneously hyperintense. The hypointense incomplete rim has been reported to occur within the first few hours after a hemorrhage8,11,14,15 and is thought to represent early intracellular deoxyhemoglobin at the periphery of the hematoma because it is also hypointense on T2-weighted images and is particularly obvious on gradient-echo images, which have a stronger susceptibility effect. However, some focal areas of low signal intensity on DWI, seen in different locations within the hematoma, show high signal on T2-weighted and gradient-echo images and may represent unclotted blood separate from the retracted clot (▶ Fig. 12.2).2,16,17 These hypointense areas are consistently seen in patients with hyperacute intracranial hematomas and may represent an important imaging feature for differentiating hemorrhage from infarction.
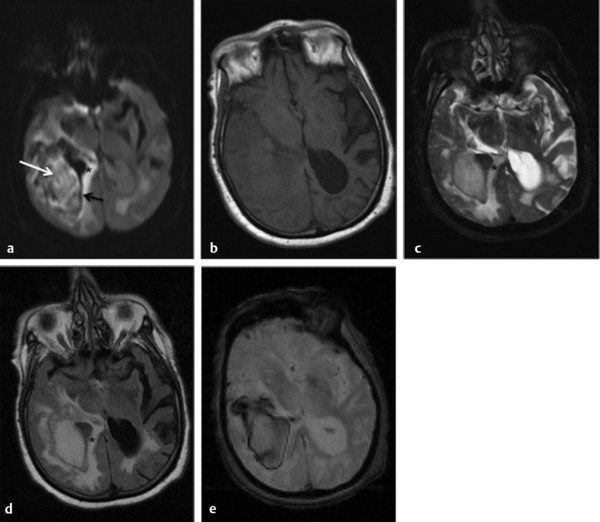
Fig. 12.1 Hyperacute intracerebral hematoma. (a) Diffusion weighted imaging shows a heterogeneous hyperintense core (white arrow) with focal areas of hypointensity surrounded by a peripherally hypointense irregular and incomplete rim (black arrow). Note the hyperintense area around the hematoma (*) that represents edema. (b) T1-weighted image shows an isointense hematoma, whereas (c) the T2-weighted image, (d) fluid-attenuated inversion recovery, and (e) gradient-echo image show a hyperintense hematoma with a well-defined hypointense rim. The surrounding edema is well depicted in all sequences.
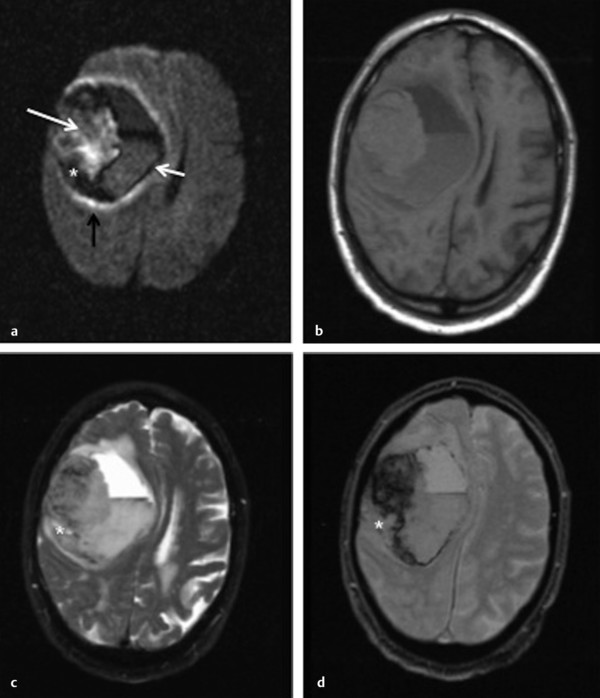
Fig. 12.2 Hyperacute intracerebral hematoma with fluid-blood level. (a) Diffusion weighted imaging (DWI) shows a heterogeneous hyperintense hematoma (white arrow) with focal areas of hypointensity, surrounded by a well-defined hypointense rim (small white arrow). The hematoma is isointense on (b) T1-weighted image, hyperintense on (c) T2-weighted image, and shows greater signal loss on (d) gradient-echo image. The fluid-blood level is well depicted in all sequences. It is seen as a horizontal interface between hypodense bloody serum layered above hyperdense settled blood. Note the thin area of edema well seen on DWI (black arrow) as a hyperintense rim surrounding the hematoma. Some of the areas of low signal intensity on DWI described above (*) show high signal on T2-weighted and gradient-echo images and may represent unclotted blood separated from the retracted clot.
Acute and Early Subacute Hematomas
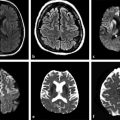
Acute and early subacute hematomas appear markedly hypointense on DWI, T2-weighted, FLAIR, and gradient-echo images (▶ Fig. 12.3 and ▶ Fig. 12.4). As stated earlier, on T1-weighted images acute hematomas are heterogeneously isointense or of low intensity, whereas early subacute hematomas are markedly hyperintense. This lower signal intensity on DWI has been attributed to magnetic field inhomogeneity caused by paramagnetic intracellular deoxyhemoglobin in acute hematomas14 and paramagnetic intracellular methemoglobin in early subacute hematomas,18 which represent the T2 blackout effect.
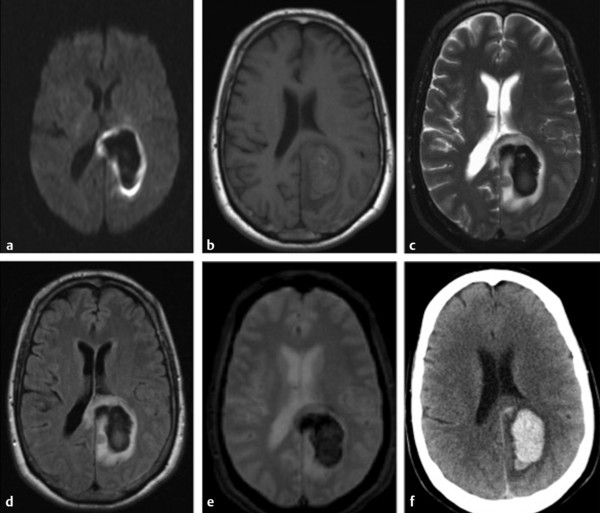
Fig. 12.3 Acute intracerebral hematoma. (a) Diffusion weighted imaging shows a markedly hypointense hematoma surrounded by a continuous rim of bright signal intensity that corresponds to edema. (b) T1-weighted image shows an isointense hematoma, whereas (c) T2-weighted image, (d) fluid-attenuated inversion recovery, and (e) gradient-echo image show a markedly hypointense hematoma with a well-defined hyperintensity area of edema. (f) Axial computed tomography shows a hyperdense hematoma surrounded by hypodense edema.
Related posts:
 Diffusion Weighted Imaging in the Evaluation of Brain Tumors
 Diffusion Weighted and Diffusion Tensor Imaging in Aging
 Supratentorial White Matter Tracts and Their Organization
 Diffusion Weighted Imaging and Diffusion Tensor Imaging in Head and Neck Diseases
 Diffusion Weighted and Diffusion Tensor Imaging in Infectious Diseases
 Physics of Diffusion Weighted and Diffusion Tensor Imaging
Stay updated, free articles. Join our Telegram channel

Full access? Get Clinical Tree


