(1)
Department of Radiology, John H Stroger Jr Hospital of Cook County, Chicago, IL, USA
Biliary System
Biliary Stones
Diagnosis
Gallstones
Imaging Features
Sonogram:
1.
Echogenic foci with acoustic posterior shadow in dependent portion of GB.
2.
Cholesterol stones are echogenic with comet tail artifacts and may float.
CT:
1.
Calcified stones have high density.
2.
Noncalcified stones have low density and may not be visible.
3.
Cholesterol stones usually have lower attenuation than bile.
4.
Mercedes-Benz sign of nitrogen gas in the center of cholesterol crystal.
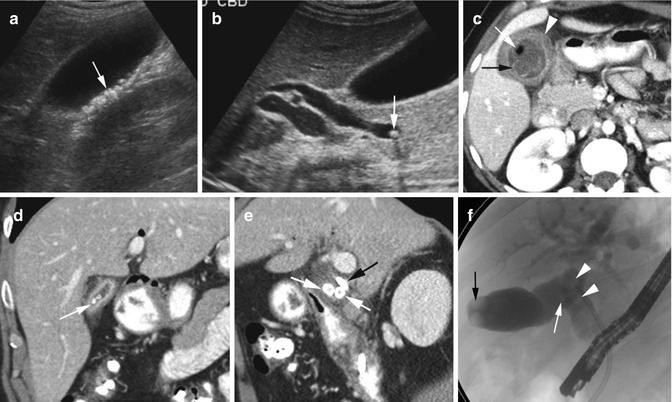
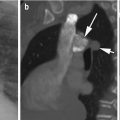
Fig. 12.1
Gallstones. Ultrasound of the gallbladder (a) shows multiple highly reflective echogenic foci within the GB with posterior acoustic shadowing (arrow). (b) Echogenic stone with echo shadow at the distal end of the dilated common bile duct (arrow). (c) Axial CT shows low-density stones with rim calcifications (black arrow), small gas collection in one stone (white arrow), and acute cholecystitis with GB wall thickening (arrowhead). (d) Coronal reformatted CT image shows multiple high-attenuated calcified stones in contracted GB (arrow). (e) CT Sagittal reformatted image shows stones in cystic duct (white arrows) and stent in common hepatic duct (black arrow). (f) ERCP study shows stones in the gallbladder (black arrow), cystic duct (white arrow), and CBD (arrowheads)
Diagnosis
Mirizzi Syndrome
Imaging Features
1.
Gallstone impacted in the distal cystic duct or Hartmann’s pouch of the gallbladder causing extrinsic compression on the common hepatic duct
2.
Dilatation of common hepatic and intrahepatic biliary ducts and normal caliber of the common bile duct
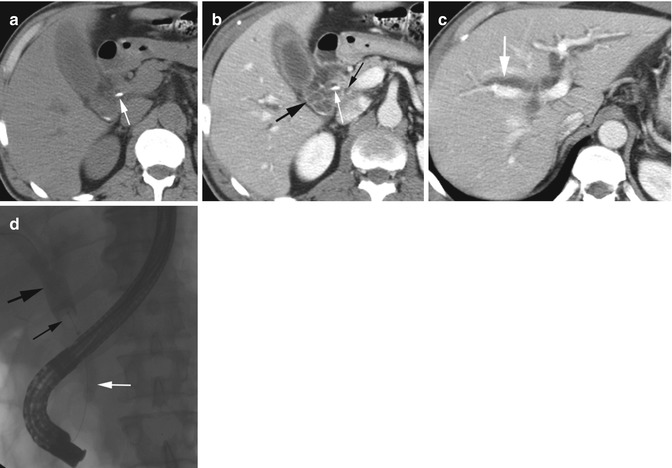
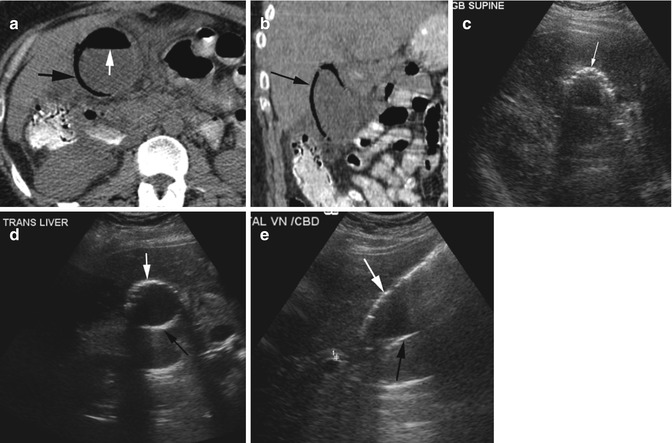
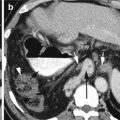
Fig. 12.2
Mirizzi syndrome. (a) Axial CT precontrast study shows gallstone in the distal cystic duct at the junction with the common hepatic duct (white arrow). (b, c) Axial CECT shows dilatation of the cystic duct (thick black arrow) and intrahepatic bile ducts (thick white arrow) with stone at the distal cystic duct (thin white arrow). Common bile duct at head of the pancreas is not dilated (thin black arrow). (d) ERCP examination shows stone at the junction of the cystic duct and common hepatic duct (thin black arrow) with dilatation of ducts proximal to the stone (thick black arrow) and CBD not dilated (white arrow)
Diagnosis
Cholesterol Sludge
Imaging Features
1.
Floating stones
2.
Comet tail artifacts
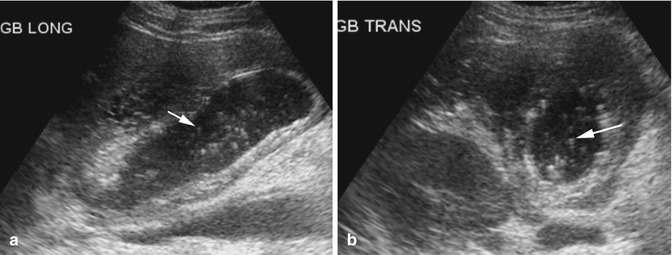
Fig. 12.3
Cholesterol sludge. Ultrasound of the gallbladder (a, b) shows multiple echogenic floating crystals with comet tail artifacts (arrow)
Diagnosis
Cholesterolosis of the Gallbladder
Imaging Features
1.
Multiple nonmobile echogenic foci within the gallbladder wall with ring-down artifacts and no shadowing
2.
May be a patchy localized form or diffuse form
Hyperplastic Cholecystosis
Diagnosis
Cholesterolosis of the Gallbladder
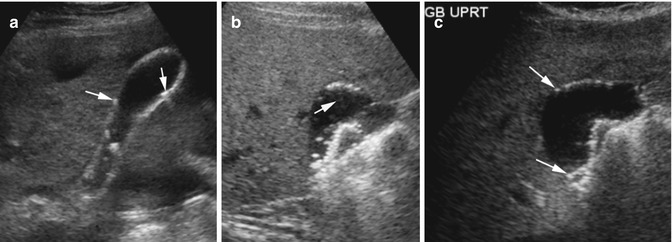
Fig. 12.4
Cholesterolosis of the gallbladder. Ultrasound of the gallbladder in patient 1 (a) shows multiple echogenic foci in the gallbladder wall with ring-down artifacts (arrows). Patient 2: (b, c) Supine and upright position of the patient shows multiple nonmobile echogenic foci in the dependent and nondependent gallbladder wall with distal comet tail artifacts (arrow)
Diagnosis
Adenomyomatosis
Imaging Features
1.
Types—diffuse, segmental, or focal
2.
Brightly echogenic nonmobile nonshadowing polypoid masses in the gallbladder wall with distal comet-tail artifact
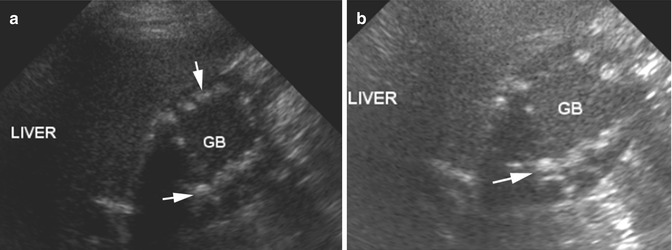
Fig. 12.5
Adenomyomatosis. (a, b) Sonogram of the gallbladder (marked as GB) shows diffuse nodular echogenic polypoid masses in the gallbladder wall (arrows) with comet-tail artifacts
Biliary Gas
Diagnosis
Emphysematous Cholecystitis
Imaging Features
Sonogram:
1.
High echogenicity of the gallbladder wall with posterior dirty shadowing
2.
Can involve dependent and nondependent wall depending upon extent of involvement
3.
Does not move with change of position
CT:
1.
Curvilinear gas in the wall of the gallbladder.
Fig. 12.6
Emphysematous cholecystitis. (a, b) Axial and coronal reformatted CT shows curvilinear gas in the wall of the gallbladder (black arrow). Intraluminal air has air-fluid level (white arrow). Ultrasound of the same gallbladder (c–e) show bright echogenicity of the gallbladder wall with reverberation artifacts involving both anterior (white arrow) and posterior walls (black arrow)
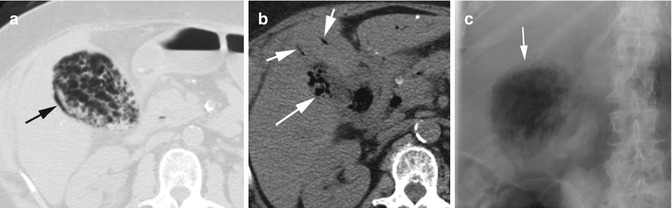
Fig. 12.7
Emphysematous cholecystitis. Axial CT (a, b) shows extensive sloughing of the gallbladder mucosa with gas collection in the wall of the gallbladder (arrow in a and long arrow in b) and air in the bile ducts (short arrows). (c) Flat plate of the abdomen shows irregular gas collection in the gallbladder (arrow)
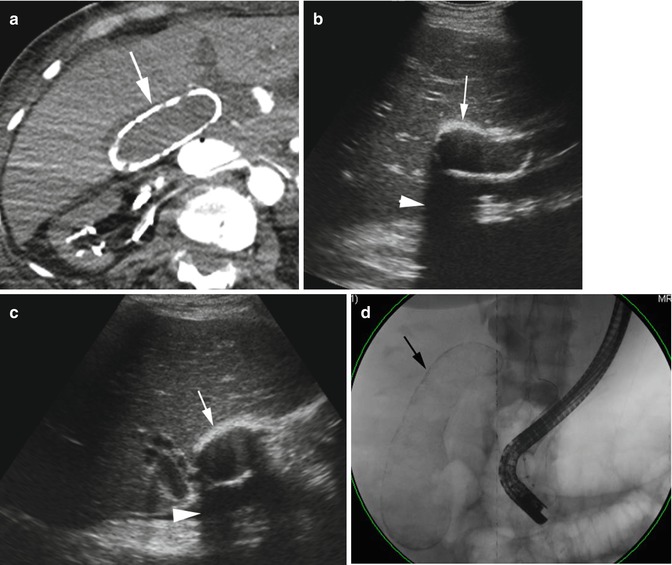
Fig. 12.8
Porcelain gallbladder. (a) Axial CT shows diffusely thickened and calcified gallbladder wall (arrow). (b, c) Ultrasound in longitudinal and transverse views of the gallbladder shows diffusely thickened echogenic wall (arrow) from calcification and with posterior negative shadowing (arrowhead). (d) ERCP study shows the gallbladder with calcified wall (arrow)
Diagnosis
Wall Echo Shadow (WES) Sign
Imaging Features
1.
Two parallel curvilinear echogenic lines separated by a thin hypoechoic space
2.
Acoustic shadowing distal to the echogenic line in the far field
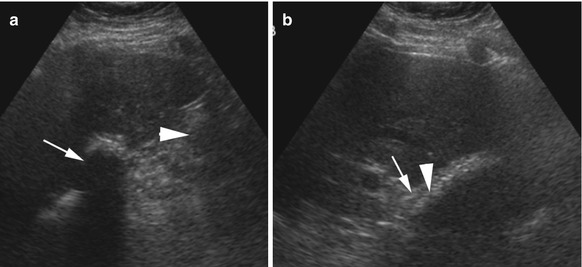
Fig. 12.9
Wall echo shadow (WES) sign. Ultrasound shows (a) the gallbladder filled with stones with a negative posterior shadow (thin arrow). A focal echogenic area with dirty shadow is seen from bowel loops filled with gas (arrowhead). (b) The outer thinner component (thin arrow) is the wall, and echogenic thicker layers (arrowhead) are the stones with thin layer of hypoechoic bile between the two layers
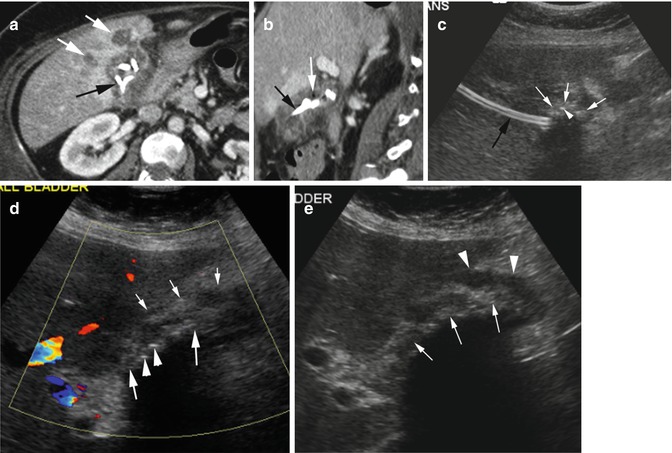
Fig. 12.10
WES sign from cholecystostomy catheter. A patient with acalculous cholecystitis and abscess. (a) Axial CT shows a catheter coiled within the gallbladder (black arrow). The gallbladder bed shows increased enhancement with small abscesses (white arrows). (b) Sagittal reformatted image shows small gas bubbles (white arrow) adjacent to the catheter (black arrow). (c) Grayscale ultrasound shows linear catheter (black arrow) in the liver parenchyma. Coiled catheter within the gallbladder has ill-defined curvilinear intermediate echogenicity (white arrows) with a few echogenic gases (arrowhead). (d) Color Doppler shows increased vascularity around the gallbladder fossa region surrounding the WES sign caused by thick wall (small white arrows), echogenic coiled catheter (thick white arrows), and few gas bubbles (arrowheads) forming the second parallel line with posterior shadowing. Small amount of bile is forming the irregular sonolucency between the two echogenic lines. (e) Grayscale US shows the gallbladder wall (arrowheads) surrounding the coiled catheter posterior to it (thin arrow) with distal negative shadowing and small sonolucent bile between the two lines
Diagnosis
Pneumobilia
Imaging Features
1.
Bright echoes in the gallbladder with reverberation artifacts
2.
Echoes change in position and rise to nondependent wall in upright position
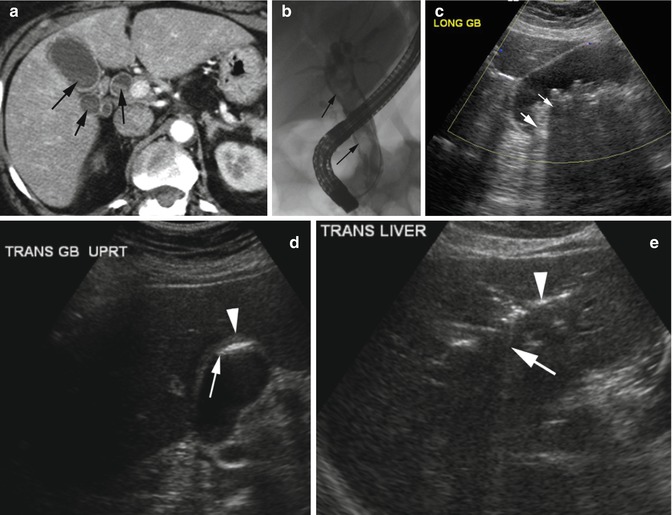
Fig. 12.11
Post-ERCP biliary gas. (a) Axial CT shows layered sludge in the gallbladder and bile ducts (arrows). (b) ERCP shows a stone-filled common bile duct (arrows). (c) Post-ERCP supine gallbladder ultrasound shows multiple-layered stones and gas in the gallbladder. Stones have negative shadows (thin arrow) while the gas has reverberation artifacts (thick arrow). (d) Gallbladder ultrasound in upright position shows gas (arrow) rising to the fundus hugging the gallbladder wall (arrowhead). (e) Gas in intrahepatic bile ducts with bright echoes (arrowhead) and reverberation artifacts (arrow)
Diagnosis
Gallstone Ileus
Imaging Features
1.
Chronic cholecystitis
2.
Fistula with duodenum is common
3.
Rigler’s triad: Impacted stone in the small bowel, SBO and pneumobilia
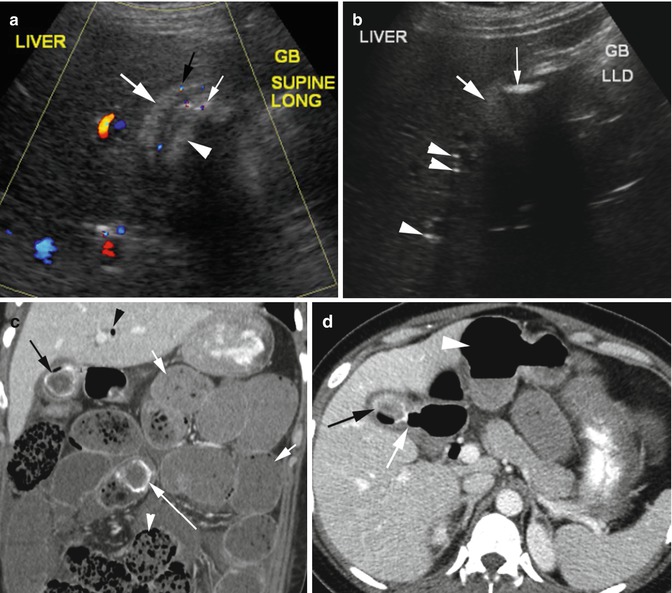
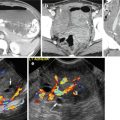
Fig. 12.12
Gallstone ileus. Middle-aged female with chronic right upper quadrant pain now with colicky abdominal pain. US study done first shows WES sign. (a) Color Doppler study shows thick-walled gallbladder (thick white arrow) with increased vascularity in the wall (black arrow). Large stone within lumen with echo shadow (arrowhead). Twinkling artifacts from small gas foci adjacent to stone (thin arrow). (b) Grayscale decubitus view shows air collection (thin arrow) in the fundus of the thick-walled gallbladder (thick arrow) and echogenic gas in biliary tracts (arrowheads). (c) Coronal reformatted CT shows large stone in mid-small bowel (long arrow) causing obstruction with bowel dilatation (short arrows) with small bowel feces sign (white arrowhead). Stone with gas is seen in the gallbladder (black arrow) and gas biliary duct (black arrowhead). (d) Axial CT shows fistula (white arrow) of duodenum with gallbladder filled with stone and gas (black arrow) and dilated stomach (arrowhead)
Cholangitis
Imaging Features
1.
Irregular narrowing and dilated intrahepatic biliary ducts with wall thickening and surrounding edema
2.
Gas, stones, debris, and/or pus in intrahepatic biliary ducts
3.
Liver abscesses with dilated ducts
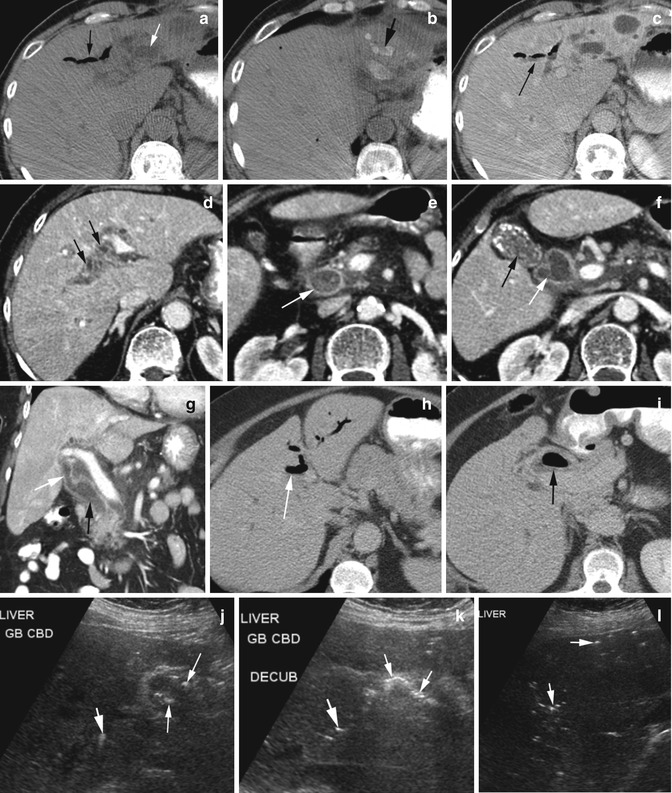
Fig. 12.13
Ascending cholangitis in three patients. Patient 1 (a–c). Noncontrast axial CT (a, b) shows pneumobilia (thin black arrow), dilated ducts (white arrow), and stones in some dilated ducts (thick black arrow). (c) CECT shows layered dependent debris in gas-filled ducts (arrow). Patient 2 (d–g). Axial CECT shows (d) thick-walled dilated ducts at porta hepatis with surrounding edema (arrows). (e) Dilated CBD filled with stones and sludge (arrow). (f) Contracted gallbladder with stones from chronic cholecystitis (black arrow) and dilated hepatic and common hepatic ducts (white arrow). (g) Coronal reformatted image shows dilated common hepatic (white arrow) and CBD (black arrow). Patient 3 (h–l). Axial CT (h) shows pneumobilia of the left lobe (arrow). (i) Gas in the gallbladder lumen (arrow). Ultrasound (j) shows gas within the gallbladder (thin white arrows) as hyperechoic foci with dirty shadowing. (k) GB gas moves and gathers in the nondependent portion in decubitus position (thin white arrows). Bright echoes with dirty shadowing within the liver are from pneumobilia (thick white arrows in j–l)
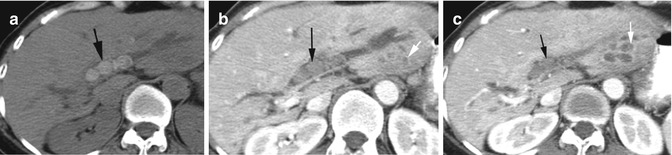
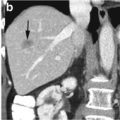
Fig. 12.14
Recurrent pyogenic cholangitis with pigment stones. (a) Noncontrast axial CT better shows stones in dilated intrahepatic bile ducts (black arrow). (b, c) Postcontrast axial CT at different levels shows multiple small clustered abscesses in the left lobe (white arrows) adjacent to the dilated ducts with stones (black arrow)
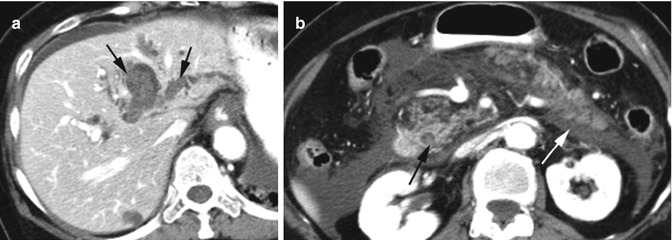
Fig. 12.15
Recurrent oriental cholangitis with gallstone pancreatitis. Postcontrast axial CT (a) shows dilated intrahepatic biliary ducts with pigment stones (arrows). (b) Stone in CBD (black arrow), IEP with mild heterogeneous pancreatic enhancement, and diffuse acute peripancreatic fluid collection in the anterior pararenal space (white arrow)
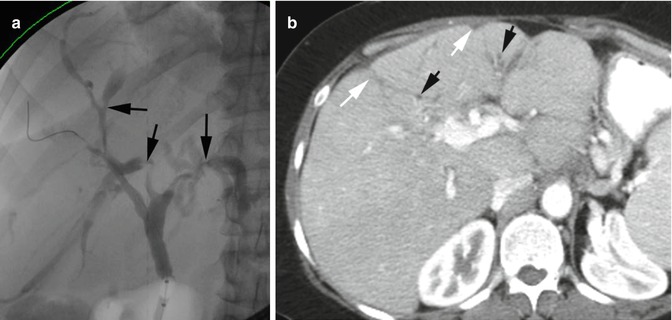
Fig. 12.16
Primary sclerosing cholangitis. ERCP examination (a) shows multifocal strictures (black arrow) and focal ectasia of intrahepatic biliary ducts adjacent to strictures. (b) Axial CECT shows scarring of the liver (white arrows) with mild intrahepatic biliary dilatation in the affected lobe (black arrows)
Biliary Papillomatosis
Imaging Feature
1.
Dilated intra- and extrahepatic bile ducts
2.
CT—multiple nodules within the ducts which can enhance or not enhance
3.
ERCP—single or multiple nodular intraductal filling defects and irregularity of the duct wall
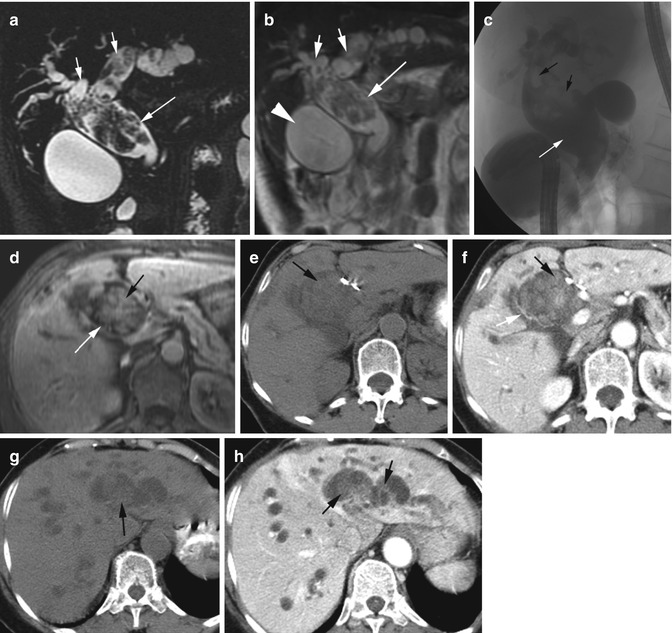
Fig. 12.17
Biliary papillomatosis. (a, b) MRCP and T2W coronal images show multiple nodular lesions within the dilated CBD (long arrow) and right and left bile ducts (short arrows). The wall of the bile ducts shows irregular thickening. The gallbladder is distended (arrowhead). (c) ERCP shows dilated CBD (white arrow) with multiple filling defects (black arrows). (d) T1W postcontrast axial MRI shows dilated CBD (white arrow) with irregular enhancing soft tissue mass (black arrow). Axial precontrast and CECT (e, f) of CBD and (g, h) of the left lobe of the liver show dilated CBD (white arrow) and intrahepatic bile ducts with faintly enhancing nodules (black arrows)
Choledochal Cyst
Diagnosis
Types 1 and 2
Imaging Features
1.
Rounded or fusiform cystic lesion in porta hepatis separate from the gallbladder
2.
Cystic lesion communicates with dilated common hepatic duct, CBD, or intrahepatic duct
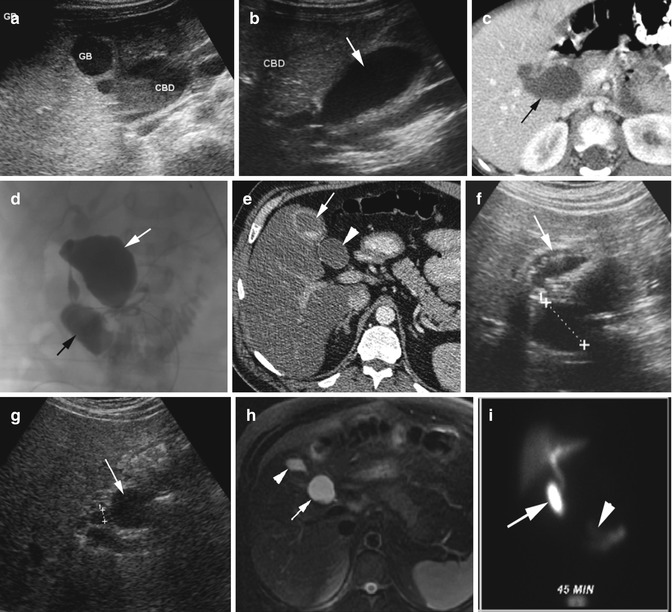
Fig. 12.18


Choledochal cyst. Type I. (a, b) Ultrasound shows the gallbladder to be separate from the dilated common bile duct (arrow in b) which contains sludge. (c) Axial CT again shows dilated CBD (black arrow) and no dilated intrahepatic bile ducts. (d) Intraoperative cholangiogram again shows contrast-filled dilated CBD (white arrow), and the contrast flows freely into the duodenum (black arrow) and intrahepatic ducts. At surgery the cyst was seen to be extending from the right common hepatic duct to the pancreas. Type II. (e) Axial CECT shows a cyst (arrowhead) in the region of CBD and separate from the contracted GB (arrow) with stones. Grayscale US shows (f) the cyst (cursor) separate from the stone-filled thick-walled GB. (g) The cyst (arrow) is arising from the CBD (cursor). (h) MRI axial T2W BH FS image shows a cyst adjacent to CBD (arrow) and separates from small GB (arrowhead). (i) HIDA scan 45 min after morphine injection shows radiotracer filling the choledochal cyst (arrow) and free flow into small bowel (arrowhead)
Related posts:
Stay updated, free articles. Join our Telegram channel
Full access? Get Clinical Tree
