Echocardiography uses high-frequency sound waves to generate images of cardiac structures and to provide information regarding blood flow and valvular function. The introduction of two-dimensional (2-D) echocardiography into routine clinical practice in the 1970s transformed the assessment of cardiac disease. Since then, the technology has evolved with the development of multiplanar transducers, harmonic imaging, and more recently, the introduction of three-dimensional (3-D) imaging. Transthoracic echocardiography (TTE) is a noninvasive imaging modality, without radiation, that allows immediate assessment of chamber size, valves, and ventricular function. TTE is often the initial imaging test of choice in acutely ill patients. In patients presenting with myocardial infarction, echocardiography can provide immediate information regarding left ventricular systolic function, in addition to the presence or absence of regional wall motion abnormalities. Echocardiography can exclude cardiac tamponade in patients with unexplained hypotension and evaluate right ventricular size, function, and right ventricular systolic pressure in patients presenting with pulmonary embolism. TTE is often requested for suspected endocarditis, in patients with and without preexisting valve disease. Outside the acute setting, indications for requesting TTE include diagnosis and monitoring of patients with significant valve disease, left ventricular dysfunction, right-sided heart disease, congenital heart disease, ascending aortic dilatation, and aneurysms. Three-dimensional echocardiography is also developing at a rapid pace and has many useful applications in the assessment of patients with cardiac disease.
Standard Views for a Transthoracic Echocardiogram
Careful positioning of the patient is important to optimize image quality. Most echocardiographers are right handed and thus scan patients in the left lateral decubitus position at approximately 45 degrees. Ideally, the patient’s left arm is placed behind the head to increase the spacing between ribs. A clear electrocardiogram (ECG) trace is important to have before imaging starts, so that digital images can be captured by triggering on the R wave. If the rhythm is very irregular, however, images can be acquired according to a set time interval, rather than by ECG trigger. The standard TTE transducer positions, or “windows,” are parasternal, apical, subcostal, suprasternal, and right parasternal.
Parasternal Long-Axis View
The first view is the parasternal long-axis view, which is obtained by positioning the transducer in the third or fourth intercostal space to the left of the sternum. Depending on imaging quality, the echocardiographer may need to move the probe up or down an intercostal space to obtain clear images. In this view, the mitral (A2 and P2, the middle portion of the valve leaflets) and aortic (right and noncoronary cusps) valves are typically seen ( Fig. 1-1 , A and B ). The left ventricle, with the exception of the apex, is also well visualized. The mitral subvalvular apparatus, comprising the papillary muscles and chordae tendineae, are assessed in this view, although they may require some medial or lateral angulation. The right ventricle is also partially seen. If the M-mode line of interrogation can be properly aligned, it can be used to measure the aortic root, left atrial and left ventricular cavity dimensions, and left ventricular wall thickness; otherwise, measurements from 2-D imaging are preferred.
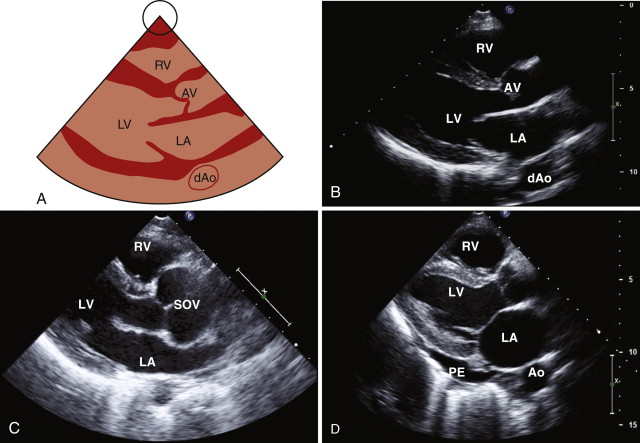
The parasternal long-axis view is the optimal view for diagnosing mitral valve prolapse, which is present in approximately 2% of the population. In mitral valve prolapse, one or both leaflets are displaced at least 2 mm above the plane of the mitral annulus into the left atrium. For a diagnosis of classic mitral valve prolapse, mitral leaflet thickening (>5 mm) is also required. The color Doppler sector is placed over the aortic and mitral valves to look for evidence of stenosis or regurgitation. The smaller the sector is, the higher the color Doppler frame rate will be. Other structures that can be assessed in the parasternal long-axis view include the pericardium and the descending thoracic aorta, which lies posterior to the left atrium. The examiner can differentiate between pericardial effusion and pleural effusion in this view because pericardial effusion courses between the heart and the descending aorta, whereas pleural effusion is noted posterior to the descending aorta (see Fig. 1-1 , D ).
Right Ventricular Inflow
By angling the probe upward and medially, the right ventricular inflow comes into view, thus displaying the right atrium, tricuspid valve, and right ventricle ( Fig. 1-2 , A and B ). The inferior vena cava and coronary sinus can often be seen as they enter the right atrium. The right atrium contains several embryologic structures that can easily be mistaken for abnormalities. The crista terminalis is a muscular ridge separating the smooth portion of the right atrium from the more trabeculated portion. A prominent eustachian valve may be seen is some individuals at the junction of the inferior vena cava and the right atrium (see Fig. 1-2 , C ). This structure may be associated with a Chiari network that, in early life, was connected to the crista terminalis and the fossa ovalis and extended from the inferior vena cava to the superior vena cava. In the right ventricular view, the anterior and posterior leaflets of the tricuspid valve can be seen. The moderator band, a prominent muscular band, is usually seen traversing the right ventricle near the apex. Color flow mapping is used to look for tricuspid regurgitation, and the right ventricular inflow view is often good for evaluating the tricuspid regurgitation velocity, which can be used to estimate the right ventricular systolic pressure.

Right Ventricular Outflow View
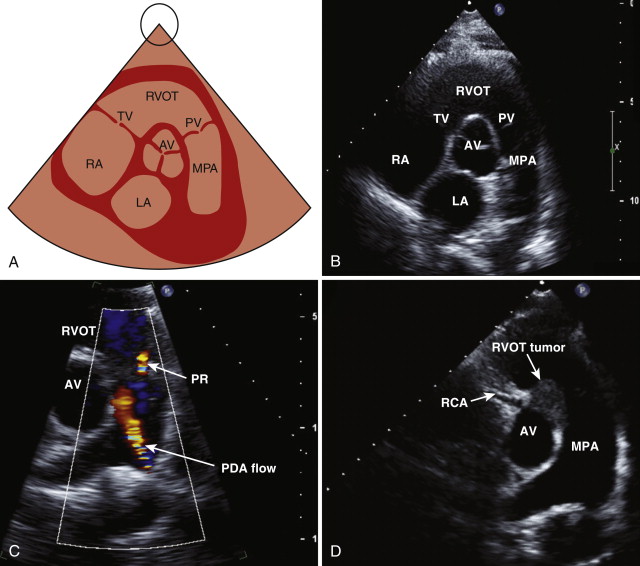
By angling the probe upward and laterally, the right ventricular outflow tract comes into view. This view shows the right ventricular outflow tract, the pulmonary valve, and the pulmonary artery. Color flow mapping is used to look for evidence of pulmonary stenosis or regurgitation.
Parasternal Short-Axis View
The parasternal short-axis view is obtained by rotating the probe approximately 90 degrees in a clockwise direction. The optimal view shows the three cusps of the aortic valve in the center of the image ( Fig. 1-3 , A and B ). In the case of a bicuspid valve, the right and left cusps are most commonly fused, followed by fusion of the right and noncoronary cusps. The examiner should assess the morphology and opening pattern of the aortic valve in systole because a bicuspid valve with raphe may appear tricuspid during diastole when the valve is closed. The right ventricular outflow tract lies anterior to the aortic valve, the main pulmonary artery, and its bifurcation on the right, the tricuspid valve and the right atrium on the left, and the left atrium posteriorly.
Color flow mapping is used to assess for evidence of tricuspid or pulmonary regurgitation. Pulsed wave and continuous wave Doppler images are used to measure the velocity across the pulmonary valve and to determine whether any stenosis or regurgitation is present. Color flow mapping can also be used to look for evidence of a left-to-right shunt across the interatrial septum. By angling the transducer inferiorly, the mitral valve leaflets are visualized in cross section ( Fig. 1-4 , A and B ). This view is used in mitral stenosis to assess the mitral valve area by direct planimetry (see Fig. 1-4 , D ). Moving down the ventricle, the papillary muscles in the left ventricle come into view, and a portion of the right ventricle is also seen ( Fig. 1-5. A and B ). This view is used in the qualitative assessment of left ventricular systolic function and to evaluate for regional wall motion abnormalities (a sign of myocardial infarction). By angling the probe inferiorly, the left ventricular apex may be visualized ( Fig. 1-6 , A and B ).


Apical Four-Chamber View
The apical four-chamber view is obtained by placing the probe at the left ventricular apex ( Fig. 1-7 , A and B ). The transducer is manipulated to depict the maximal long axis of the left ventricle and both the mitral and tricuspid valve leaflets. The apex is identifiable as the thinnest part of the myocardium, with minimal motion during the cardiac cycle. The examiner must take care not to foreshorten the ventricle because this may cause apical abnormalities such as thrombus or an aneurysm to be missed. In the apical view, both atria and ventricles are clearly seen. The superoinferior and mediolateral dimensions of the atria can be measured in this view. Color flow sector is placed across the mitral and tricuspid valves. Pulsed wave and continuous wave Doppler images allow the assessment of velocity across these valves. Pulsed wave Doppler imaging of flow in the pulmonary veins provides information regarding left atrial pressure, which can be assessed in the apical four-chamber view. The right upper pulmonary vein is usually the most easily accessible for Doppler assessment.

Apical Five-Chamber View
In the apical five chamber view, the tip of the probe is angled superiorly, and the aortic valve can be brought into view ( Fig. 1-8 , A and B ). Color flow mapping and pulsed and continuous wave Doppler images are recorded across the aortic valve to evaluate for aortic stenosis and regurgitation. Using pulsed wave Doppler in the left ventricular outflow tract, the presence of subvalvular obstruction may be identified secondary to conditions such as hypertrophic cardiomyopathy or a subaortic membrane.

Apical Two-Chamber View
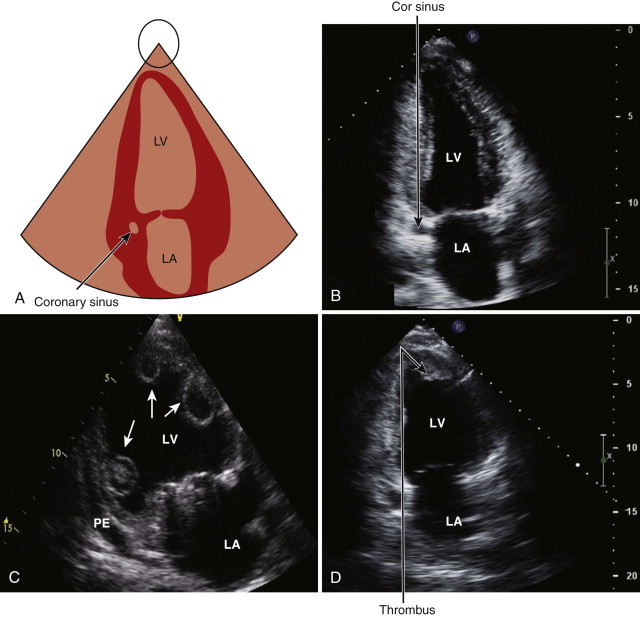
The apical two-chamber view is obtained by rotating the probe approximately 90 degrees in an counterclockwise direction ( Fig. 1-9 , A and B ). In this view, the inferior and anterior walls of the left ventricle can be assessed for wall motion abnormalities. Color flow mapping and pulsed continuous wave Doppler images are recorded across the mitral valve. The coronary sinus and the descending thoracic aorta can be seen in this view.
Apical Long-Axis View
The apical long-axis view is obtained by rotating the probe further counterclockwise, so the aortic valve is brought into view ( Fig. 1-10 , A and B ). Color flow mapping and continuous wave Doppler are used to assess for aortic regurgitation and to record velocity across the aortic valve. This view is also used to evaluate for mitral valve prolapse and the presence of systolic anterior motion of the mitral valve in patients with hypertrophic cardiomyopathy.

Subcostal View
The subcostal view is obtained by placing the probe in the subxiphoid area, with the patient lying supine. It may be helpful to ask the patient to bend the knees because this maneuver relaxes the abdominal muscles. In the subcostal view, the heart is imaged from below; therefore, the right side of the heart is on the top of the image, with the left side of the heart below it ( Fig. 1-11 , A and B ). This view is good for examination of the interatrial septum when evaluating for evidence of a patent foramen ovale (PFO) or an atrial septal defect (ASD), lipomatous hypertrophy (see Fig. 1-11 , C ), or an interatrial septal aneurysm.

By rotating the probe counterclockwise, the inferior vena cava can be seen to enter the right atrium ( Fig. 1-12 , A and B ). The right atrial pressure may be estimated by determining the diameter of the inferior vena cava and its respirophasic response. The diameter of the inferior vena cava should be measured at the end of expiration, just proximal to the hepatic veins that lie 0.5 to 3.0 cm proximal to the ostium of the right atrium. By further rotation of the probe, the abdominal aorta can be seen in long axis. The subcostal view is good when looking for evidence of diastolic flow reversal, by pulsed wave Doppler, in patients with moderate to severe aortic regurgitation. In some patients, such as supine patients ventilated in intensive care units or those with significant respiratory disease, the subcostal view may be the best view obtainable.

Suprasternal View
To obtain the suprasternal view, the probe is placed in the suprasternal notch with the patient supine and the neck extended, if possible. The suprasternal view allows the aortic arch and head and neck vessels to be visualized ( Fig. 1-13 , A and B ). Pulsed and continuous wave Doppler imaging is used to examine flow in the descending thoracic aorta. This is the standard view used to evaluate for coarctation of the aorta ( Fig. 1-14 ).


Right Parasternal View
To obtain the right parasternal view, the patient should be lying on the right side. This view is useful in patients with right ventricular enlargement and when the heart is positioned more medially. The interatrial septum is often clearly visualized in this view. The ascending aorta may also be well visualized, and this view is particularly useful when assessing aortic valve gradients using the stand-alone, nonimaging continuous wave Doppler probe.
Measurements
M-mode recordings are occasionally used for left ventricular, aortic root, and left atrial dimensions, although 2-D measurements are performed routinely in most laboratories ( Table 1-1 ). Because of its superior temporal resolution, M-mode imaging of the aortic and mitral valve leaflets can provide additional information regarding valve function. M-mode measurements are made in the parasternal long-axis and parasternal short-axis views. For accurate M-mode measurements, the cursor must be perpendicular to the structure of interest; however, this may not be achievable in all patients. By convention, at the end of expiration, M-mode measurements are made from leading edge to leading edge, whereas 2-D measurements are from inner edge to inner edge. If the M-mode cannot be adequately aligned, then measurements by 2-D are preferred. These measurements should be averaged over several beats, particularly if the rhythm is irregular. Postpremature ventricular contraction beats should not be measured.
| View | Normal Values (mm) | |
|---|---|---|
| Ascending aorta (end-diastole) | PLAX | <36 |
| Sinus of Valsalva (end-diastole) | PLAX | 24-39 |
| Aortic annulus (end-diastole) | PLAX | <26 |
| Left atrium (end-systole) | PLAX | ≤38 |
| Left ventricle (end-diastole) | PLAX | 37-53 |
| Interventricular septum (end-diastole) | PLAX | 7-11 |
| Posterior wall (end-diastole) | PLAX | 7-11 |
| Right ventricular outflow tract (end-diastole) | PLAX PSAX | ≤33 ≤27 |
| Main pulmonary artery (end-diastole) | PSAX | ≤29 |
| Proximal right pulmonary artery (end-diastole) | PSAX | ≤17 |
| Proximal left pulmonary artery (end-diastole) | PSAX | ≤14 |
| Right ventricle at base (end-diastole) | Apical four-chamber | ≤42 |
| Right ventricular wall thickness (end-diastole) | Subcostal | ≤5 |
| Inferior vena cava (end-diastole) | Subcostal | ≤21 |
Left ventricular cavity dimensions and left ventricular wall thickness are measured at the level of the mitral valve leaflet tips at end-diastole and end-systole. The examiner should correct for body surface area by indexing left ventricular cavity dimensions. The left ventricular outflow tract diameter is measured in the parasternal long-axis view within 0.5 to 1.0 cm of the valve. Aortic root diameters include measurements at the annulus, the sinus of Valsalva, and the sinotubular junction. The aortic annulus is defined as the hinge point of the aortic leaflets. The sinotubular junction is where the sinuses of Valsalva transition to the ascending aorta.
The anteroposterior diameter of the left atrium is usually measured in the parasternal long-axis axis view at end-systole; however, although this single dimension measurement is the most reproducible, it does not always reflect true left atrial size. The left atrium may enlarge in a superoinferior or mediolateral dimension, rather than anteroposteriorly, and these measurements should be obtained in the apical four-chamber view. Left atrial volumes can be calculated with the modified Simpson rule using apical two- and four-chamber views at end-systole. Left atrial volumes by echocardiography compare favorably with other modalities such as magnetic resonance imaging (MRI) and computed tomography (CT). The American Society of Echocardiography recommends that indexed left atrial volumes should be routinely measured in clinical practice. The reference range for indexed left atrial volumes is 22 ± 6 mL/m².
Right ventricular outflow tract dimensions are measured in the parasternal long-axis view (proximal portion) and parasternal short-axis view at the level of the pulmonary valve (distal portion). Right ventricular size is best measured at end-diastole, in the apical four-chamber view. Guidelines indicate that the right ventricle is dilated when the base is larger than 42 mm, the midventricle is larger than 35 mm, and the longitudinal dimension is greater than 86 mm.
Right ventricular wall thickness is measured in end-diastole in the subcostal view using either 2-D or M-mode imaging. Right atrial size can be assessed by measuring the superoinferior and mediolateral dimensions in the apical four-chamber view. Right atrial volumes can also be calculated using the modified Simpson rule. Guidelines suggest that right atrial dilatation is confirmed when the superoinferior dimension in the apical four-chamber views is greater than 53 mm and the mediolateral dimension is greater than 44 mm. A right atrial area larger than 18 cm² also suggests enlargement. The inferior vena cava dimension and inspiratory collapsibility should be assessed from the subcostal view. An inferior vena cava 2.1 cm or smaller and with more than 50% collapse on inspiration suggests normal right atrial pressure (range, 0 to 5 mm Hg). An inferior vena cava larger than 2.1 cm and with less than 50% collapse, with a sniff, suggests high atrial pressure (range, 10 to 20 mm Hg).
Assessment of Left Ventricular Function
Left ventricular function can be assessed echocardiographically both qualitatively and quantitatively. Ejection fraction can be calculated using left ventricular end-diastolic and end-systolic dimensions; however, the Simpson biplane is the recommended method for assessment of left ventricular volumes and ejection fraction. In this method, the endocardial borders are traced at end-diastole and end-systole in the apical two- and four-chamber views. The long-axis is then divided into 20 equal portions, to create 20 disks. Left ventricular volume is calculated from the summation of the volume of these disks. In patients with dilated cardiomyopathy, in whom the normal geometry is distorted, 3-D echocardiography may now be used to calculate a more accurate ejection fraction ( Fig. 1-15 ):
Ejection fraction ( % ) = LVEDV − LVESV LVEDV × 100

in which LVEDV is left ventricular end-diastolic volume and LVESV is left ventricular end-systolic volume.
Regional left ventricular function is assessed based on a 17-segment model introduced in 2002 by the American Heart Association. Each segment, except the apical cap (seventeenth segment), should be assessed for motion and systolic thickening. By convention, segments are described as normal, hypokinetic, akinetic, dyskinetic, or aneurysmal. A wall motion score or index can also be calculated if additional quantitative data are required. More sophisticated tools for the assessment of left ventricular function have emerged since 2000. Tissue Doppler imaging and strain imaging are now routinely used in the assessment of patients with left ventricular dyssynchrony and other cardiomyopathies. Circumferential, longitudinal, and radial strain can be calculated and displayed graphically. Figure 1-16 shows an example of radial strain. This technology continues to advance and has great potential for identifying patients with subclinical left ventricular dysfunction, whose ejection fraction is within the normal range. Early identification of patients with evolving cardiomyopathies may facilitate closer follow-up of patients or consideration of medical treatment, if appropriate.

Doppler Echocardiography
Doppler echocardiography provides important hemodynamic information in real time ( Table 1-2 ). The Doppler principle states that “the frequency of reflected ultrasound is altered by a moving target, such as red blood cells.” The Doppler shift (change of frequency of a received ultrasound pulse compared with the transmitted pulse) relates to the velocity of red blood cells and the direction of blood flow. By convention, blood flowing toward the transducer is positive, and blood flowing away from the transducer is negative.
Doppler equation : V = Δ F × c 2 F ە × Cos
| Normal Values | |
|---|---|
| Mitral Valve | |
| Mitral E wave velocity | <1.2 m/sec |
| Mitral A wave velocity | <0.8 m/sec |
| E/A ratio ∗ | 0.75-1.5 |
| Mitral E deceleration time † | <220 msec |
| Septal e′ velocity ‡ | 6-9 cm/sec |
| Lateral e′ velocity ‡ | 7-11 cm/sec |
| Tricuspid Valve | |
| Tricuspid E wave velocity | <0.6 m/sec |
| RVSP (estimated from peak TR velocity) § | <35 mm Hg |
| LVOT and Aortic Valve | |
| LVOT velocity | <1.5 m/sec |
| Aortic velocity | <2.0 m/sec |
| Pulmonary Valve | |
| Pulmonary outflow tract velocity | <0.9 m/sec |
∗ E/A ratio decreases with age.
† Deceleration time increases with age (≤275 msec normal for individuals >60 years old).
‡ Velocities decrease with age.
§ RVSP is calculated from peak TR velocity using simplified Bernoulli equation. RVSP = 4V² + right atrial pressure, which is estimated from inferior vena cava size and degree of collapse on inspiration.
in which V is velocity, ΔF is the Doppler shift, Fە is the transducer frequency, c is the velocity of sound in tissue (1540 m/second), and Cos is the cosine of the angle of incidence.
The three Doppler modalities used in clinical practice are pulsed wave Doppler, continuous wave Doppler, and color flow mapping. The Doppler principle can also be applied to the myocardium and is referred to as tissue Doppler. This technique has an important role in the assessment of diastolic function and left ventricular dyssynchrony. Pulsed wave Doppler measures velocity in a small sample area but is unable to measure high velocities because of aliasing. This threshold is referred to as the Nyquist limit and is determined by the pulsed repetition frequency. Pulsed wave Doppler is used to determine normal velocities across valves, measure cardiac output, and quantify intracardiac shunts. It is also used in the assessment of diastolic function and in the evaluation of cardiac tamponade and constrictive physiology.
Continuous wave Doppler can measure high velocities but is unable to determine where along the beam the maximum velocity occurs. Continuous wave Doppler is primarily used to determine the gradients across stenotic valves (e.g., aortic stenosis) or orifices (e.g., coarctation of the aorta). The peak velocity allows estimation of the peak gradient across a valve by the simplified Bernoulli equation, and the velocity time integral can be measured by tracing the Doppler waveform.
Color flow mapping uses the pulsed wave Doppler principle, but it also includes other pixels from the 2-D image. For all these regions, a flow velocity is superimposed on the 2-D images and is displayed with a color scale. By convention, flow away from the transducer is displayed as blue, and flow toward the transducer is displayed as red (BART). Because color flow mapping is based on pulsed wave Doppler, it is also affected by aliasing. To maximize the frame rate when using color flow mapping, the examiner should reduce the sector width and adjust the depth to include only the area of interest.
Doppler echocardiography has high sensitivity and specificity. It is used to determine the velocity across valves and provides information on stenosis and regurgitation. The velocity across a stenotic valve can be converted into a pressure gradient by using the simplified Bernoulli equation. The equation correlates well with invasive measurements, provided the velocity proximal to the obstruction is 1.5 m/second or less. Using the simplified Bernoulli equation, right ventricular systolic pressure may be estimated from the tricuspid regurgitation velocity profile. In the absence of pulmonary stenosis, the sum of the peak right ventricular systolic pressure and the right atrial pressure reflects pulmonary artery systolic pressure. Right atrial pressure is estimated from the assessment of inferior vena cava size and inspiratory collapse.
Simplified Bernoulli equation : Pressure gradient = 4 V 2
Flow = CSA × Velocity
Related posts:

Stay updated, free articles. Join our Telegram channel

Full access? Get Clinical Tree


