Elastography for Diffuse Liver Disease
3.1 Introduction
Liver fibrosis is an excessive accumulation of extracellular matrix material produced by fibroblastlike cells, including stellate cells, due to the chronic activation of the wound-healing reaction as a result of one of several agents. It changes the normal architecture of the liver and ultimately leads to liver cirrhosis, hepatic decompensation, portal hypertension and its complications, hepatocellular carcinoma (HCC), and eventually death. The major causes of hepatocellular damage are hepatitis viruses and liver inflammation due to steatosis or alcohol abuse.
The hepatitis C virus (HCV) and the hepatitis B virus (HBV) are leading causes of chronic liver disease. An estimated 130 to 150 million people have chronic hepatitis C infection worldwide. A significant number of those who are chronically infected will develop liver cirrhosis or liver cancer, and 350,000 to 500,000 die annually from HCV-related liver diseases.1 In high endemic areas, where 3/4 of the world’s population live, 70 to 90% of the population becomes HBV-infected and 8 to 20% of those are HBV-carriers. About 1 million people die each year due to chronic forms of the disease.2
Nonalcoholic fatty liver disease (NAFLD) is a common clinical condition characterized by significant deposition of lipid droplets in the hepatocytes of individuals without a history of alcohol abuse. It is emerging as the most common chronic liver disease in adults and children, with the increased incidence of obesity and diabetes in Western countries. NAFLD is a benign and reversible condition that, however, may progress to nonalcoholic steatohepatitis (NASH) with an increased risk for cirrhosis, liver failure, HCC, and death. The worldwide prevalence of NAFLD is estimated to range from to 6 to 33% with a median of 20% in the general population.3 The prevalence of NASH is estimated to range from 3 to 5% of patients with NAFLD, and 5 to 8% of patients with NASH will develop cirrhosis within 5 years. The prevalence of NAFLD in pediatric patients is 3 to 10%, increasing to 40 to 70% in obese children.4
The presence and extent of liver fibrosis are associated with disease progression and complications; thus, early detection of fibrosis is crucial for the prognosis and management of patients. In chronic viral hepatitis the assessment of the severity of liver fibrosis is necessary for determining when to begin the antiviral treatment. The guidelines on the management of chronic hepatitis B and C have indicated that in the presence of significant fibrosis antiviral therapy is required, because maintenance of hepatitis B viral suppression or hepatitis C viral eradication can decrease liver-related complications.5,6 Liver biopsy is considered the reference standard for assessing liver fibrosis. The histological evaluation of liver biopsy specimens is carried out using scoring systems that give values for various categories of inflammation (grades) and of fibrosis (stages). There are several scoring systems, but essentially they categorize similar features. In the assessment of chronic viral hepatitis, the most reproducible scoring system is the METAVIR. On the METAVIR scoring system, liver fibrosis is evaluated semiquantitatively and staged on a 5-point scale from 0 to 4 (F0, absent; F1, enlarged fibrotic portal tract; F2, periportal or initial portal-portal septa but intact architecture; F3, architectural distortion but no obvious cirrhosis; and F4, cirrhosis).7
Liver biopsy is a painful, expensive, and invasive procedure with some morbidity and mortality risks; moreover, the results can be impaired by sampling errors, and intraobserver and interobserver variability in a specimen’s readings. The liver biopsy yields only a small sample of the liver and a sampling bias can occur especially when fibrosis is heterogeneously distributed, as happens in the mild stage. It should be underlined that fibrosis has a continuous spectrum, but the histology reading gives a semiquantitative staging of fibrosis in a categorical scale. Due to these limitations, sequential liver biopsy to decide when to start or to monitor the response to treatment is not feasible. In patients with chronic hepatitis B or C, there are two important end points: the assessment of significant fibrosis, which indicates that an antiviral treatment should be started, and the assessment of liver cirrhosis, which indicates that the surveillance program for HCC and for complications related to portal hypertension should be initiated. In patients with NAFLD, the high prevalence of the disease and its frequently benign course make it difficult to decide the timing for performing liver biopsy in a low-risk population.
For all these reasons, the development of reliable noninvasive imaging modalities that indirectly assess liver fibrosis by measuring liver stiffness has generated great clinical interest. The accuracy of the elastographic methods in the evaluation of liver fibrosis has been assessed by comparing the results to those from liver histology.
The European Federation of Societies for Ultrasound in Medicine and Biology (EFSUMB) and the World Federation for Ultrasound in Medicine and Biology (WFUMB) have issued guidelines for the use of elastography for evaluation of liver stiffness.8,9 Recently, the Society of Radiologists in Ultrasound (SRU) convened a panel of specialists for a consensus regarding the use of elastography in the assessment of liver fibrosis. The recommendations were established on the basis of analysis of current literature and common practice approaches.10 The SRU consensus panel recommends interpreting liver stiffness results in patients with chronic viral hepatitis by using two cutoff values: < 7 kPa (1.5m/s) and > 15 kPa (2.2 m/s). The first is for selecting patients who are at low risk for significant fibrosis, and the second is for selecting patients who are at high risk for advanced fibrosis or cirrhosis and who require different management and need to be treated. Those between these values may have mild or moderate fibrosis and follow-up should be based on clinical presentation and other laboratory tests.
3.2 Elastography Techniques
The elastography techniques are either shear wave–based (SWE) or strain-based (SE). Their technical aspects are discussed in depth in Chapter 2.
Briefly, vibration-controlled transient elastography (VCTE, Echosens, Paris, France) and acoustic radiation force impulse (ARFI)-based elastography measure shear wave speed. VCTE is performed with the FibroScan device, which is provided with an ultrasound transducer mounted on the axis of a vibrator. Vibrations of mild amplitude and low frequency (50 Hz) are transmitted by the tip of the transducer through the liver, inducing an elastic shear wave that propagates through the underlying tissue. The FibroScan is not a real-time ultrasound device; however A-mode ultrasound is used to locate the area of liver parenchyma in which to perform the measurement and to monitor the velocity of propagation of the shear wave. The velocity of the wave is directly related to tissue stiffness (▶ Fig. 3.1).

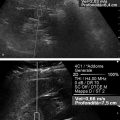
Fig. 3.1 A 71-year-old male with liver cirrhosis. Assessment of liver stiffness with the FibroScan device (Echosens, Paris, France). Time-motion–mode (left), A-mode (middle), and elastogram (right) images. The elastogram is the representation of the shear wave as a function of time. The slope of the white line becomes steeper with the increase of liver stiffness. The controlled attenuation parameter (CAP) is a measure in decibels per meter (dB/m) of the attenuation of the ultrasound waves as they propagate through the liver. The median value of stiffness is 49.6 kPa, consistent with liver cirrhosis. The median value of CAP is 145 dB/m, which is within the normal range.
Unlike FibroScan, ARFI technology is integrated in standard ultrasonographic systems and requires no external vibration to generate the shear wave. Indeed, ARFI is based on the generation of shear waves by the displacement of tissues induced by the force of a focused ultrasound beam deep within tissue. The shear waves propagate perpendicular to the direction of the ultrasound beam and travel at speed between 1 and 10 m/s depending on the tissue stiffness. In stiffer tissues, the shear waves propagate faster.11
The speed of the shear wave can be measured in a small region of interest—the technique is termed point shear wave elastography (p-SWE)—or in several small regions of interest inside a sample box. In this latter case, an image, a color-coded map of the shear waves speeds in the sample box, is built. This technique is called two-dimensional shear wave elastography (2D-SWE).12 ▶ Fig. 3.2 shows the p-SWE and 2D-SWE techniques that have been validated so far. ▶ Fig. 3.3 shows the p-SWE and 2D-SWE techniques that are commercially available today but for which there are no clinical studies on reproducibility or accuracy published yet in the literature.

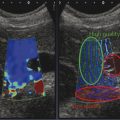
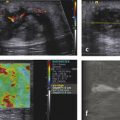
Fig. 3.2 (a) A 65-year-old male with chronic hepatitis C. Assessment of liver stiffness with a p-SWE technique (ElastPQ, Philips Medical Systems, Bothell, WA). The sample box has a fixed size and can be moved by the operator. The values of liver stiffness are expressed either in kilopascals (kPa), as in this image, or in meters per second (m/s). The mean value of the single measurement along with its standard deviation is shown in the image. The liver stiffness is also semiquantitatively displayed using the scale in the bottom left corner of the image. The median stiffness value is 14.44 kPa, which indicates the presence of liver cirrhosis. The diagnosis was confirmed by liver histology. (b) A 75-year-old female with alcoholic liver cirrhosis. Assessment of liver stiffness with a p-SWE technique (VTQ, Siemens Healthcare, Erlangen, Germany). The sample box has a fixed size and can be moved by the operator. Measurement of liver stiffness is given in meters per second (m/s). The mean value and the depth of the sample box are displayed. The mean value is 3.45 m/s, consistent with liver cirrhosis. (c) A 42-year-old male with chronic hepatitis C. Assessment of liver stiffness with a 2D-SWE technique (Aixplorer’s ShearWave, Supersonic Imagine, Aix-en-Provence, France). The size and the location of the quantification box is adjustable by the operator. The shear wave measurements are color-coded and displayed in the quantification box. The measurement is taken in the white circle (ROI) inside the quantification box. Measurement of liver stiffness is given in kilopascals (kPa), as in the image, or in meters per second (m/s). The mean value and the standard deviation, the minimum and maximum values, and the size of the region of interest (ROI) are displayed. Liver stiffness is 7.65 kPa, consistent with significant fibrosis and confirmed by liver histology (METAVIR F2).

Fig. 3.3 (a) Assessment of liver stiffness with a p-SWE technique (QElaXto, Esaote, Genoa, Italy). The sample box has a fixed size and can be moved by the operator. The green solid square indicates the site where the shear wave is generated. Measurement of liver stiffness is given in kilopascals (kPa), as in the image, or in meters per second (m/s). Mean value and standard deviation, median value and interquartile range, and interquartile range/median ratio are shown. (b) Assessment of liver stiffness with a 2D-SWE technique (GE Healthcare, Milwaukee, WI). The size and the location of the sample box is adjustable by the operator. (c) Assessment of liver stiffness with a 2D-SWE technique (Toshiba Medical Systems, Tokyo, Japan). The size and the location of the sample box is adjustable by the operator. The shear wave measurements are color-coded and the stiffness value is taken in the region of interest (ROI) inside the sample box. Measurement of liver stiffness is given in meters per second (m/s), as in the image, or in kilopascals (kPa). The mean stiffness value along with the standard deviation is displayed.
Real-time strain elastography (RTSE) measures the ratio of longitudinal tissue displacement after an applied stress that could be either an active external stress, such as the compression with the ultrasound transducer, or passive internal and physiologically induced stress (▶ Fig. 3.4).12

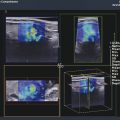
Fig. 3.4 A 64-year-old female with liver cirrhosis due to chronic hepatitis C. Assessment of liver stiffness with a real-time strain elastography technique (Hi-RTE, Hitachi Medical Systems, Tokyo, Japan). The color-coded elastography region of interest (ROI) is overlaid on a conventional B-mode image. The strain histogram, which displays the color dispersion in the ROI, and the liver fibrosis index (LF index) are displayed. The LF index, obtained by using nine image features that are extracted from each image, is 2.69, which is consistent with liver cirrhosis.
3.2.1 Procedure
With all the techniques, measurements are performed by positioning the patient in the dorsal decubitus position, with the right arm elevated above the head for optimal intercostal access. With shear wave elastography, in cases of patients difficult to scan, a slight (30 degree) left lateral decubitus position is helpful.10 Fasting for at least 3 hours is recommended. The operator should search for the best acoustic window while the patient is breathing normally, then measurements should be performed while the patient holds his or her breath in a neutral position.
Shear Wave Elastography
Vibration-Controlled Transient Elastography
The software is set to take measurements at a depth depending on the frequency of the probe: between 25 and 65mm below the skin surface with the 3.5 MHz probe, between 35 and 75mm with the 2.5 MHz probe, and between 15 and 50mm with the 5.0 MHz probe. The operator locates a portion of liver parenchyma at least 6 cm thick and free of large vascular structures using the A-mode ultrasound on the system. The software determines whether each measurement is successful or not. The entire procedure is considered to have failed when no value is obtained after 10 attempts. Recently, new reliability criteria have been proposed: a minimum of 10 valid measurements performed in the same area of the right lobe of the liver, an interquartile range (IQR)/median ≤ 30% only if the stiffness value is > 7.1 kilopascals (kPa). Measurements are defined as very reliable when the ratio IQR/median is less than 0.10; reliable when the ratio IQR/median is between 0.10 and 0.30 or when the ratio IQR/median is greater than 0.30 and the median liver stiffness < 7.1 kPa; and poorly reliable when the ratio IQR/median is greater than 0.30 and the median liver stiffness is greater than 7.1 kPa.13 Actually these are the same criteria recommended by the manufacturer.
Ultrasound Shear Wave Elastography
The probe is placed in the intercostal space perpendicular to the liver surface. ▶ Fig. 3.5 shows how the probe should be positioned to obtain a reliable measurement of liver stiffness; ▶ Fig. 3.6 shows the correct positions of the probe. Measurement is taken in the resting respiratory position (breath-hold without deep inspiration). The sample box is positioned in an area of liver parenchyma free of large vessels and is placed at least 1.5 to 2.0 cm beneath Glisson’s capsule to avoid reverberation artifacts. The B-mode image should be optimized for the “best acoustic window” to provide the best results. The amount of displacement of the liver is optimized when the ARFI pulse is perpendicular to the liver capsule, which limits refraction of the pulse (▶ Fig. 3.7, ▶ Fig. 3.8).10 The median value of multiple measurements is reported. The WFUMB guidelines suggest considering the median value of 10 valid measurements with p-SWE, and the mean value of 4 measurements with 2D-SWE.9 The SRU consensus conference statement on liver elastography suggests that the IQR should be used to assess quality of the data. An IQR/median < 0.30 suggests a data set is good. This can be used to monitor sonographer quality as well as laboratory quality.10

Fig. 3.5 When imaged, the patient is in a supine or slight (30-degree) left lateral decubitus position (as in this case) and the probe is positioned parallel to the rib space, perpendicular to the liver capsule.

Fig. 3.6 Positions of the probe that should be avoided when imaging: (a) placing the probe across ribs; (b) angling of the probe to liver capsule; (c) substernal scanning.

Fig. 3.7 Correct positioning of the sample box for imaging.

Fig. 3.8 Tips for positioning of the sample box for imaging: (a) avoid imaging at depth; (b) avoid imaging at vessels; (c) avoid imaging at angles; (d) avoid imaging < 1.5- cm deep to liver capsule.
Tips and Tricks
The following are tips and tricks for liver stiffness measurements:
Fasting for 4 to 6 hours is recommended.
Scan with patient in decubitus or 30 degree oblique position with right arm above head.
Scan between ribs.
Optimize the B-mode image for the “best acoustic window” to provide the best results.
Take into consideration acoustic window and depth: measurements that are taken at 4 to 5 cm depth usually have less variability.
Ask the patient to breathe normally while looking for the best acoustic window; then perform the measurement while the patient holds his or her breath in a neutral position.
Have the ARFI pulse perpendicular to the liver capsule to limit refraction of the pulse.
Place the region of interest (ROI) 1.5 to 2.0 cm beneath Glisson’s capsule to avoid reverberation artifacts.
Do not include liver vessels in the ROI.
Make multiple measurements in the same location.
Artifacts
With all of the shear wave imaging techniques, a quality assessment is made on the data. If the data is of poor quality and an accurate shear wave speed cannot be calculated, the system does not provide a measurement, listing “0” or “x.xx” as the result, or in 2D-SWE it does not color code that area.
Real-Time Strain Elastography
The B-mode images should be clear and free from artifacts. The transducer is placed on the skin in the right intercostal space without moving it and is pointed toward the heart. The manufacturer recommends that the ROI be placed deep to the liver capsule and to select a homogeneous region. The patient is asked to hold his or her breath while the RTSE images are displayed. To avoid large blood vessels, a 2.5 × 2.5 cm ROI is recommended. For the analysis, frames with strain generated in the depth direction with no artifacts should be selected. Good images may be obtained at the end of diastole with electrocardiographic gating or at the largest downward wave on a strain graph.9 Few methods have been proposed for analyzing the strain information displayed inside the ROI. Basically, they are all strain ratios and give a semiquantitative assessment of liver stiffness. The liver fibrosis index (LF index) is the standard analytic method recommended by the manufacturer and is based on nine features extracted from each image. The results obtained with strain elastography in the assessment of liver fibrosis are reported in a separate section below.
3.3 Liver Stiffness Measurements
3.3.1 Reproducibility
The reproducibility of liver stiffness measurements has been assessed by means of the intraclass correlation coefficient (ICC) or the concordance correlation coefficient (CCC). With both coefficients, the agreement between measurements ranges in value from 0 to 1 and is classified as poor (0.00–0.20), fair (0.21–0.40), moderate (0.41–0.60), good (0.61–0.80), and excellent (0.81–1.00).
Measurements performed with VCTE shows an excellent interobserver agreement with an overall ICC of 0.98 (95% confidence interval [CI], 0.977–0.987). Reproducibility is not influenced by gender, patient age, or the degree of liver fibrosis, but it is negatively affected by a higher body mass index (BMI), by the presence of significant hepatic steatosis, and in cases of mild fibrosis (F0-F1).14
p-SWE methods are highly reproducible, with an agreement ranging from 0.81 to 0.93.15,16 The interobserver reproducibility seems to decrease for BMI > 25 kg/m2 and for low stages of liver fibrosis.16 The interobserver agreement of measurements performed with 2D-SWE is excellent (ICC 0.88). However, the method is subject to the same limitations encountered with conventional ultrasound imaging modes, such as the expertise of the operator and the patient body habitus; thus, it is recommended that at least 50 supervised scans and measurements should be performed by a novice operator in order to obtain consistent measurements.17
For all methods, there is a learning curve that could affect the reproducibility. VCTE is not a difficult procedure to learn; it requires the training of performing about 100 examinations. However, in a study, the failure rate in the measurements decreased from 8.3 to 3.5% when the operator had performed more than 500 VCTE examinations.18 The experience of the operator is an important factor with all the techniques, thus training is required and the recommendations of the manufacturers should be followed.
3.3.2 Limitations and Confounding Factors
Fat attenuates ultrasound and elastic wave propagation; thus the measurement of liver stiffness in obese individuals is more challenging. The FibroScan device is equipped with the XL probe that reduces failure rates in obese patients. Fibrosis thresholds of VCTE are lower with the XL probe than the M probe, which is designed for normal weight patients, but further validation in larger cohorts of chronic liver disease patients is required. Since the shear wave originates at the skin level when using VCTE, VCTE cannot be used in individuals with ascites because the shear wave does not propagate into fluid. With all the techniques, measurements can be difficult in individuals with narrow intercostal spaces.
Liver stiffness is a physical parameter largely related to fibrosis, but it can also be influenced by other factors that modify liver elasticity. An increase in liver stiffness from postprandial blood flow has been reported, thus fasting for 4 to 6 hours before measurement is recommended.10 Deep inspiration may falsely increase the stiffness. Liver stiffness values may be 1.3 to 3 times higher in cases of acute inflammation and/or moderate alanine aminotransferase (ALT) elevation. It has been reported that ALT levels greater than 80 international units per liter (IU/L), which is twofold the upper limit of normal, resulted in false positive results of liver stiffness in patients with chronic hepatitis C.19 A significant and progressive reduction of liver stiffness values was observed in the follow-up of patients with acute hepatitis B in parallel with the reduction of ALT levels.20
It has been reported that liver stiffness values were some 10% higher in men than women and that individuals with a BMI > 30 kg/m2
Related posts:
Stay updated, free articles. Join our Telegram channel

Full access? Get Clinical Tree


