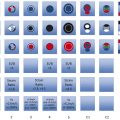
Comparison of different modes of medical ultrasonography
Mode
What is measured:
What is displayed:
B-mode
Acoustic impedance
Anatomy
Doppler
Motion
Vascular flow
Elastography
Mechanical properties
Tissue stiffness
Ultrasound elastography (commonly just called elastography) has been used in research settings for many years. Since the advent of the first clinically approved system in 2003, there has been great interest and much research into the use of this technology in clinical diagnosis for many disease states. Since its initial clinical introduction, there has been the rapid and continual development of several variations of elastography. Initially, strain elastography (SE) was developed and used clinically. This technique assesses tissue changes when an external force is applied (either with a transducer or via patient respiration or heartbeat). Stiff tissues do not deform while softer tissues do when a force is applied. With all the strain-based techniques, the amount of force applied is not known and therefore the exact quantitative stiffness of the tissues cannot be measured. Thus, these techniques are qualitative.5 However, the relative stiffness of tissues in the field of view can be assessed. Semiquantitative approaches have been developed where the stiffness of the tissue of interest is compared to the stiffness of a standard tissue in the field of view. From this, a ratio can be determined, representing the relative stiffness of the tissue of interest.6 For example the stiffness of a thyroid lesion can be compared to that of normal thyroid tissue, which is relatively similar in stiffness across patients. A cutoff value comparing the relative stiffness to the reference standard can be determined, through which one can differentiate a benign lesion from one suspicious for malignancy.
There is a learning curve for obtaining accurate strain elastograms. There is significant variability in the technique for performing SE depending on the system used. To obtain optimal elastograms and accurate results, it is important to find the “sweet spot” for the compression-release and frequency techniques for each vendor’s system.
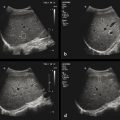
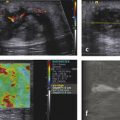
There are several methods to display the results. Various color or grayscale strain maps can be displayed. In addition, these maps can be superimposed over a grayscale B-mode image. Care must be taken when interpreting color elastograms to know which of several available color keys are being used to display the map results. For some, stiff (or hard) tissues are red and for others, stiff tissues are blue. However, if a grayscale strain map is used to display the elastographic data, the background B-mode image should be turned off to prevent confusion that would arise in reading information from the two overlapping grayscale images.▶ Fig. 1.1 shows the various ways in which the results can be displayed.

Fig. 1.1 Examples of strain elastography images from a cystic lesion in a phantom using different display maps. In (a), red represents stiff, blue represents soft, and there is no overlay on the B-mode image; in (b), red represents stiff, blue represents soft, and there is overlay on the grayscale B-mode image ; in (c), in the grayscale map, black represents stiff, white represents soft, and there is no overlay on the B-mode image. It is important to not display the B-mode overlay when using the grayscale strain map, as two grayscale images overlaid on each other are not interpretable.
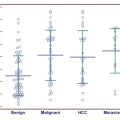
Vendors are developing methods for real-time feedback for the user on the quality of elastograms to help in learning the appropriate technique for obtaining optimal images. One important principal in performing SE is to apply uniform stress throughout the field of view of the image. One vendor provides a real-time “motion map” that uses color to indicate the amount of displacement throughout the image (▶ Fig. 1.2). For accurate SE results, the same displacement should be present throughout the image. This is especially true when you are obtaining a strain ratio.

Fig. 1.2 A real-time “motion map” developed by one vendor displays the displacement resulting from the applied stress when obtaining the elastogram. The amount of tissue displacement in the image is displayed using a color map. For an optimal strain elastogram, the stress should be uniformly applied across the image. In (a), optimal stress is applied. Note that at similar depth, the color in the image is similar. In (b), the transducer was heeled, applying more stress to the left side of the image (red). Therefore, the stiffness calculated for a lesion on the right of the image would appear different than that of a similar lesion on the left side of the image. In (c), the effect of carotid artery pulsation can be identified in this thyroid strain elastogram. The motion maps are displayed on the left with the upper image showing a color map and the lower image showing a grayscale map. The two images on the upper and lower right are the grayscale elastograms corresponding to the motion maps. Note the red ring (upper left image) corresponds to the white area (lower left image) in the motion map; these indicate increased stress (increased pressure [strain] applied) due to the pulsating carotid artery. In (d), the upper images are the motion maps and the lower images are the B-mode images. The motion maps are selected from a cine clip of the same tissue. Significant stress was applied when obtaining this clip (red in motion map). In the two sets of images, the strain ratio was obtained in the same location. The strain ratio obtained from the frame on the left was 7.4, while that on the right was 5.2. The reason for the difference is the ED: disparity? in stress applied from the location of the two ROIs (lesion, dotted circle A, and reference tissue, dotted circle B), which is clearly identified using the motion maps.
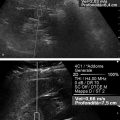
Other vendors provide a real-time display of the amount of stress applied (globally over the whole image). The display depicts the region of optimal compression–release, which aids in performing the examination. Some vendors also provide a bar that allows the user to visualize in real-time when the optimal compression–release and frequency of the push pulses are obtained (▶ Fig. 1.3). Systems are being developed that can automatically detect a lesion’s borders for more consistent region of interest placement as well as identify the “best” area to use as the reference tissue to calculate the strain ratio. The addition of these new capabilities will allow for more accurate and reproducible SE results.

Fig. 1.3 Many vendors have a real-time scale on the image that depicts the stress being applied. In this example of a scale, the optimal displacement is when the stress applied (green line) is between the two dashed lines highlighted with the red arrows. The purple box on the right is used to optimize both the frequency of compression and the optimal displacement. When optimal, the yellow rectangle in the purple box just fills the purple box.
The second major elastographic technique developed was shear wave elastography (SWE). In this technique, either a mechanical force or an acoustic radiation force impulse (ARFI) is used to generate shear waves within the tissues being examined. Shear waves propagate perpendicular to the applied force, similar to the ripples in water when a stone is dropped into a pond. The ripples correspond to the shear waves and the stone to the applied force. Shear wave speed (SWS) can be estimated by observing the tissue motion in response to the shear waves using B-mode ultrasound. SWS is dependent on tissue stiffness: it is slower in softer tissues and faster in stiffer tissues. This technique when performed with mechanical pushes and when no ultrasound image is acquired is called transient elastography (TE). There are several techniques using ARFI pulses to generate shear waves and where a B-mode image is obtained to determine where the SWS measurement is being obtained. In one, a single small region of interest (ROI) can be placed in the tissue of interest and ARFI pulses used to generate shear waves. The resultant SWS is then calculated and displayed; it usually represents the mean value of the shear wave speeds within the ROI. This technique is called point shear wave elastography (p-SWE). In another technique, multiple ARFI pulses can be applied over a larger field of view (FOV) to estimate the SWS over a larger area of tissue. With this technique, color-coding of the pixels in the display map is used to visualize the variation of the SWS in the FOV. This technique is called two-dimensional shear wave elastography (2D-SWE). Some vendors provide 2D-SWE for a single moment in time, while other vendors provide ongoing 2D-SWE in real-time.
With SWE, a convention of color-coding stiff as red and soft as blue has been adopted. However in SE various color and grayscale maps with different color-coding are usually available. For some vendors, their default display color-codes stiff as blue, while for others, their default display color-codes stiff as red. For this reason, it is important to always display the color-coding map used when evaluating SE images. The color map in 2D-SWE can be adjusted to reflect the appropriate SWS from the tissues of interest. Changing the scale can be used to help visualize differences in the stiffness of the tissue being evaluated.
With both SE and SWE, it is important for the transducer to remain in one location during data collection and to limit motion in the field of view. Motion either caused by transducer movement or from patient sources can lead to poor-quality data.
One critical factor in performing elastography is precompression. Precompression is the amount of force applied to the tissues when acquiring images. As tissues are compressed, they become stiffer. In general, softer tissues increase in stiffness faster than stiffer tissues when compression is applied. It is possible to make benign tissues as stiff as malignant tissues by applying compression. Elastography images, both SE and SWE, should be obtained using a “light touch.” This is more critical in superficial organs such as the breasts, where it is easy to increase tissue stiffness by compressing the breast tissue between the transducer and the ribs. In deeper organs, especially those deep to the ribs, this effect is less problematic. A method for consistently applying minimal precompression has been reported.7
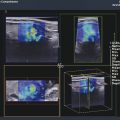
Poor-quality shear waves may be generated during both p-SWE and 2D-SWE imaging. All vendors have rejection algorithms that evaluate the quality of the shear waves generated. These algorithms are continuously being improved to allow the user to better determine if the results obtained are accurate. One vendor displays a pictorial image of the shear wave propagation. When the shear wave propagation lines are moving in parallel, the quality of the shear waves is high; when they are not, the quality of the shear waves is poor (▶ Fig. 1.4).

Fig. 1.4 An example of how vendors provide real-time feedback on the quality of shear wave generation. The 2D-SWE image is on the left and the “quality image” is on the right. With 2D-SWE when the shear wave propagation lines are parallel, the image quality is high, and when the propagation lines are not parallel, the quality is poor. The propagation lines within the green circle are parallel, confirming high-quality shear wave generation. In the two red circles the propagation lines are not parallel, representing poor-quality shear wave propagation, which results in poor accuracy in estimating the shear wave speed.
Related posts:
Stay updated, free articles. Join our Telegram channel

Full access? Get Clinical Tree


