Strain Elastography
Limited evaluation of SE has been performed on the spleen.
Shear Wave Elastography
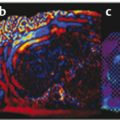
The reported mean elasticity values of normal spleen, calculated by means of SWE, were 2.9 ± 1.8 kPa (range, 1–10 kPa); the mean elasticity values for the spleen did not exhibit a significant difference between the sexes and among ages.6 Similarly, Ferraioli et al showed that in 4,172 measurements of spleen stiffness values obtained, those from men were not significantly different than from women. Both in men and women, the spleen showed higher stiffness (▶ Fig. 9.1) with respect to the liver.7
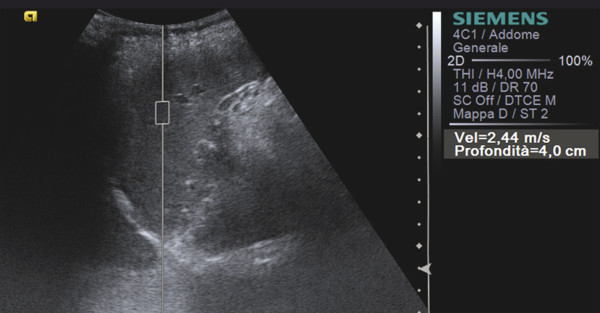
Fig. 9.1 Shear wave speed of the spleen.
Some technical issues to address in an elastographic examination tailored to the spleen have been proposed by Karlas et al. They found that diagnostic accuracy of p-SWE is affected by the ROI angle with respect to the spleen, and the lowest variation of the elastographic value was found when the ROI position was placed perpendicular to the central portion of the transducer surface.8 When obtaining a measurement, the patient should hold his or her breath similar to when performing a liver fibrosis study. It is unknown if the measurements are dependent on the prandial state, as they are with the liver. However, it is expected that splenic stiffness may increase with the increased blood flow after eating.
When using VCTE, an ultrasound system is required to localize the spleen and provide guidance for the VCTE measurement. If ascites is present, VCTE measurements cannot be made since the mechanically induced shear waves do not transmit in ascites.
9.2.2 Clinical Applications
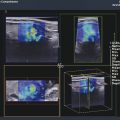
The main application of elastography in the study of the spleen is in the evaluation of cirrhotic patients in order to determine the risk of portal hypertension.9,10,11 Recent studies have shown that spleen stiffness correlates with hepatic fibrosis (HF), portal hypertension (PH), and the risk of esophageal varices (EV) in patients with chronic liver disease. In particular, there are changes in spleen morphology noted among patients with cirrhosis, including hyperplasia of splenic histiocytes, lengthening of arterial terminals, increased splenic white pulp volume, fibrosis between splenic trabecular structures, and increased splenic red pulp blood volume from congestion with blood. The increased spleen stiffness (▶ Fig. 9.2) in portal hypertension is likely due to spleen congestion that, by itself, leads to increased organ stiffness.12,13 Piscaglia et al11 calculated that the median ARFI-VTQ (Virtual Touch Quantification, a p-SWE technique) values in the spleen were 2.33 m/s in normal subjects, 2.62 m/s in patients with chronic hepatitis demonstrated by transient elastography (TE) (namely < 13 kPa), and 3.36 m/s in those with cirrhosis (TE > 13 kPa) (p < 0.005) among groups and for paired comparisons, thus confirming the hypothesis that an increase in splenic stiffness occurs with the development of portal hypertension. The derived splenohepatic index in the various groups (obtained by multiplying the shear wave speed [SWS] value calculated in the liver by the SWS value calculated in the spleen and dividing the result by 100, in order to correlate these two values) were 2.61 m/s, 3.77 m/s, and 8.13 m/s, respectively. The diagnostic accuracy of the ARFI-VTQ splenohepatic index for the diagnosis of cirrhosis produced higher area under the receiver operating characteristic (AUROC) curve values (0.945) than the assessment of liver stiffness in the right or left liver lobe or in the spleen. The best cutoff has been proven to be 4.90 m/s (sensitivity 95.2%, specificity 80.9%, positive predictive value [PPV] 81.6%, negative predictive value [NPV] 95.0%).11
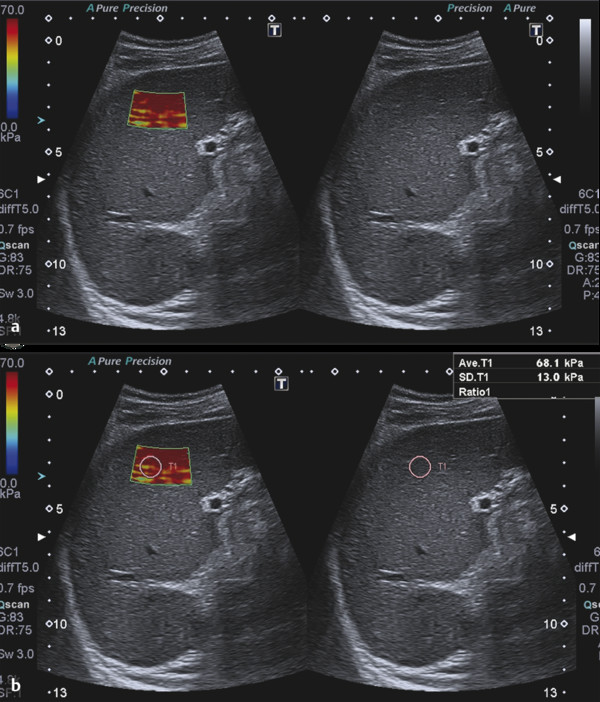
Fig. 9.2 (a, b) Cirrhotic patient with portal hypertension. The spleen is enlarged and stiff.
Moreover, Colecchia et al9 conducted stiffness measurements of the spleen and liver by means of transient elastography (TE, a VCTE technique) in 100 patients with hepatitis C virus [HCV]–related cirrhosis and compared its performance in predicting portal hypertension (PH) and esophageal varices (EV) to other parameters, including the hepatic vein pressure gradient (HVPG) and noninvasive scores of PH and EV, such as the platelet count/spleen diameter ratio and the score of liver stiffness and the platelet count/spleen diameter ratio. They concluded that the spleen and liver stiffness measurements were more accurate than the other parameters and suggested their use as a noninvasive assessment and in monitoring PH and EV.9
A recent systematic review and meta-analysis of 12 studies on the diagnostic performance of elastography techniques in the evaluation of spleen stiffness showed that sensitivity (78%) and specificity (76%) were good, and its likelihood ratio for the presence or absence of EV based on spleen stiffness measurement were modest. Likewise, the diagnostic performance of spleen stiffness measurement for detecting the presence of clinically significant EV also was good, but not at levels that would suggest low false-positive and false-negative diagnostic rates. In this systematic review and meta-analysis published by Singh et al, no differences were found in the diagnostic performance of TE and acoustic radiation force impulse (ARFI) SWE imaging in subgroup analyses.14
The results of these studies show that the reproducibility of spleen stiffness measurements in different populations depends on the expertise of the operator, and, in order to achieve a good agreement between measurements, a training period is required. Another disadvantage includes the relativity of the indirect evaluation. Therefore, although useful, and promising, the current techniques of spleen stiffness measurement are suboptimal at this time to replace esophagogastroduodenoscopy (EGD) as the screening modality of choice for detecting the presence and size of EV.
Further studies with larger series of patients should be performed to compare the elasticity values of normal and pathologic tissues to determine the diagnostic role of those techniques.
There is minimal information available for the use of elastography in focal splenic masses.
9.3 Pancreas
The use of elastosonography for the evaluation of the pancreas is still under validation, with a relatively low number of published studies, and with some equivocal and not always concordant results. Two main techniques can be used for the elastographic evaluation of the pancreas, SE and SWE, which include TE, p-SWE, 2D-SWE, and 3D-SWE. These techniques are explained in detail in Chapters 2 and 3.
Elastosonography of the pancreas can be obtained with either an endoscopic or transabdominal approach; the first is frequently used as a part of a comprehensive endoscopic ultrasound (EUS) evaluation, while the latter is a recent technical improvement of conventional ultrasound (US), which needs further evaluation to be considered in clinical practice. The percutaneous approach, although easier and practicable for most specialists, has the same intrinsic limitations of the conventional ultrasound examination, such as the presence of bowel gas.
9.3.1 Examination Technique
Strain Elastography
SE is a quasi-static strain imaging technique that can be applied in the EUS evaluation of the pancreas. This technique can measure the elastic modulus, a measure of the stress applied to tissue structure relative to the strain, or deformation, produced by passive internal physiologically-induced forces (real-time strain elastography [RTSE]).15
SE provides a qualitative assessment of strain across the field of view via a colorimetric map. Tools to quantitatively analyze image characteristics, such as to calculate strain ratios, are available.
The field of view (FOV) must be large enough to include both the target tissue and the surrounding normal pancreatic tissue for a proper comparison. Both longitudinal and radial echo-endoscopes can be used for RTSE. EUS elastography needs the proper positioning of the endoscopic probe within the gastric and/or duodenal lumen to obtain a reliable evaluation; moreover, adequate pressure must be obtained with the manipulation of the endoscopic probe, but in most cases very little additional compression is required, as the pulsatory impulse of peripancreatic vessels are sufficient to achieve a valid elastographic evaluation.15
Each pixel in the elastographic FOV is displayed with a hue that represents the relative strain value (hardness) of the tissue. In most of the equipment, the strain value is presented through a chromatic map (red–green–blue) in which hard tissues are shown in dark blue/blue, while soft tissues are displayed in red/green; color maps are dynamically displayed as a transparent overlay superimposed on the grayscale EUS image.15 Various color or grayscale maps can be used and the color map should be included with the images for correct stiffness assessment.
In transabdominal strain elastography, it is difficult to apply the correct compression–release to get diagnostic information and achieving this can be heavily limited by bowel gas. This procedure comes with a long learning curve and is highly operator dependent.
Shear Wave Elastography
Acoustic radiation force impulses (ARFIs) are used to induce shear waves in tissues in SWE, and ARFI generation is available as a technical improvement of ultrasound scanners for transabdominal elastography. ARFI generation is independent from external manual compression and therefore suitable for use in the evaluation of deep abdominal organs such as the pancreas. ARFI-based SWE is a new ultrasound tool able to evaluate the stiffness of deep tissues.16 Tissues, responses to these forces are ultrasound-induced focused radiation force impulses or Mach cone–induced localized microscopic displacements in the selected target FOV (longitudinal waves and shear waves). Both the displacement and the shear waves speed (SWS) depend on the viscoelastic properties of the tissue, which are directly correlated to the resistance to wave propagation.
SWE can provide both a qualitative assessment of displacements through a visual assessment of grayscale or color maps (ARFI Virtual Touch Tissue Imaging, ARFI-VTI) and a quantitative evaluation of SWS through a numerical representation expressed in meters per second (ARFI Virtual Touch Quantification, ARFI-VTQ). The stiffer a tissue is, the faster will be the SWS.
Transabdominal US elastographic examination technique has no particular technical differences with conventional transabdominal US examination.
9.3.2 Clinical Applications
Healthy Pancreas
The pancreas is histologically composed of a variable admixture of soft components, including pancreatic acini and fatty tissue. As a consequence, healthy pancreas is characterized by a homogeneously green pattern, represented by a predominance of green areas at qualitative visual analysis of EUS and elastographic examination.17,18,19,20,21,22 In older people, fat and connective tissue progressively deposit within the pancreas, increasing its echogenicity, so that at elastographic study the pancreas itself becomes heterogeneous.16
Furthermore the elastographic study can help in the differentiation between the ventral primordium of the pancreas (developed from a dorsal and a ventral primordium) and a neoplastic or inflammatory pathology. The ventral primordium of pancreas can be visible above pancreatic surrounding tissue as a hypoechoic structure with a band-shape. This hypoechoic structure can be confused with other diseases such as inflammation or tumors; elastography can demonstrate the same tissue properties between these two parts of the healthy pancreas.16
The semiquantitative evaluation of EUS elastography–derived histograms have reported high strain values, with a mean value of about 110 (based on a range from 0 [hardest] to 255 [softest]) in the pancreas of healthy subjects below 60 years of age; pancreatic stiffness can increase with age, with a mean value of about 80 over 60 years of age.23,24
The mean SWS of the healthy pancreas at ARFI-VTQ (▶ Fig. 9.3) is around 1.20 and 1.40 m/s.25,26,27
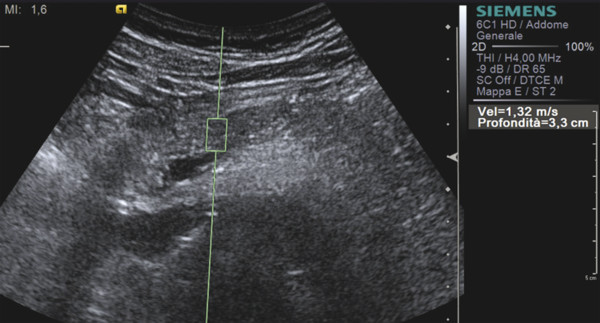
Fig. 9.3 Shear wave speed of the pancreas.
Inflammatory Diseases
Acute pancreatitis can be histopathologically divided into edematous and necrohemorragic variants. While the first is characterized by the presence of interstitial edema, congestion, and leucocytic infiltration, the second one presents with tissue destruction, fat necrosis, and hemorrhage. In both cases, the consistency of the pancreatic parenchyma during acute inflammation becomes softer than that of the healthy pancreas as a consequence of edema or necrosis, and this feature could theoretically be identified with elastosonography.
Necrosis can be identified at EUS elastography as blue (soft) areas.28 Unfortunately, literature data regarding ARFI-VTQ are controversial. Some authors have reported that the sensitivity and specificity of ARFI-VTQ can reach 100% and 98%, respectively, for this diagnosis of acute pancreatitis, using a cutoff value of 1.63 m/s (being the mean SWS value for the patients with acute pancreatitis and significantly higher than the value for the control group [p < 0.001]);29 others have reported that SWS values tend to be higher in acute pancreatitis (3.28 m/s) than in chronic pancreatitis (1.25 m/s),26 a finding that is fairly unusual if correlated to the typical histopathologic findings of these entities (i.e., presence of edema and/or necrosis versus fibrosis).
Chronic pancreatitis is characterized by atrophic changes, fibrosis, and frequently by the presence of parenchymal calcifications and intraductal calculi, which harden the consistency of the pancreas.
In patients with suspected chronic pancreatitis a direct linear correlation with a high area under the curve (AUC) and accuracy value has been reported between the number of EUS criteria for the diagnosis of chronic pancreatitis according to the Rosemont classification30 and the EUS strain ratio.32 At visual qualitative EUS elastography chronic pancreatitis usually presents a predominant hard (blue) pattern,17,19,20 despite a heterogeneous mixed-color pattern or even a homogeneously soft (green) pattern having been reported.17,19,20
Semiquantitative analysis of pancreatic stiffness through a histogram-derived analysis in patients with chronic pancreatitis provides values around 30 (based on a range from 0 [hardest] to 255[softest]), which are significantly lower than that of healthy patients, even of elderly age.23 A linear correspondence between quantitative EUS elastography results and the grade of pancreatic fibrosis assessed at histopathologic analysis has been reported.32
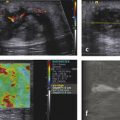
At quantitative transabdominal elastography, patients with chronic pancreatitis generally present high SWS values (▶ Fig. 9.4), despite differences in the precise cutoff value that have been reported.26,33
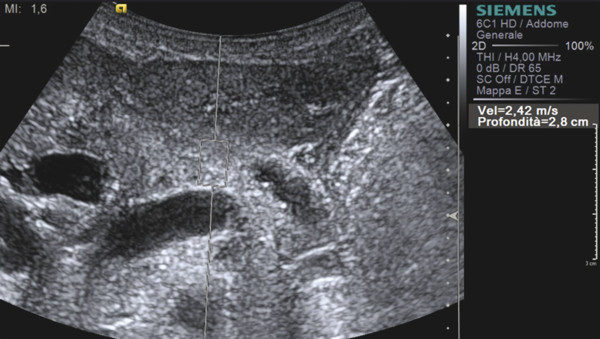
Fig. 9.4 Shear wave speed in obstructive chronic pancreatitis.
One major issue in patients with focal chronic pancreatitis is the differentiation from pancreatic ductal adenocarcinoma (PDAC), given that parenchymal fibrosis, calcifications, and intraductal calculi, which are frequently present in patients with chronic pancreatitis, produce a hard (blue) elastographic pattern, comparable with that of highly fibrotic malignant lesions, such as PDAC. Moreover, at present no universally accepted numerical cutoff values for both quantitative EUS elastography and ARFI-VTQ exist for the differentiation between chronic pancreatitis and PDAC.
As a consequence, despite some authors having reported enthusiastic results,20 further studies have proven that EUS elastography has low specificity and sensitivity (< 70%) in the differential diagnosis17,19 between chronic pancreatitis and PDAC.
Nevertheless, some authors have proposed the use of semiquantitative evaluation methods to improve this distinction by means of EUS elastography: for example, the strain ratio of PDAC seems to be higher than that of mass-forming pancreatitis (45.23 versus 5.78).19 The histogram analysis of SWS values have also reported good results for this distinction: chronic pancreatitis presents higher strain for the average hue histograms as compared to PDAC.34,35
Pancreatic involvement in cystic fibrosis leads to acinar cell destruction, fibrosis, and exocrine insufficiency. Patients with pancreatic insufficiency related to cystic fibrosis have significantly lower SWS values assessed with ARFI-VTQ as compared to patients with preserved pancreatic function.36
Autoimmune pancreatitis (AIP) is an autoimmune form of chronic and/or relapsing pancreatitis characterized by dense lymphoplasmacytic periductal infiltration. Its qualitative elastographic findings are indistinguishable from those of chronic pancreatitis, presenting a hard (blue) pattern at RTSE; nevertheless, AIP can be distinguished from PDAC based on the presence of a diffuse hard pattern, while on the contrary, PDAC usually presents as a focal blue area.37
Solid Neoplasms
EUS elastography is a good method for the detection of solid pancreatic lesions, with sensitivity, specificity, positive predictive value, negative predictive value, and accuracy of 100%, 85.5%, 90.7%, 100% and 94%, respectively.21
At visual analysis, EUS elastography seems to be able to adequately distinguish between normal pancreas and pancreatic neoplasms, given that these latter generally present as hard (blue) areas as compared to the soft (green) healthy parenchyma. As a consequence, a green-predominant pattern has been reported to be able to exclude the presence of a pancreatic solid lesion with a high accuracy.17,21,38 Moreover, the mean elasticity value of the healthy pancreas seems to be significantly higher than that of PDAC (0.53% versus 0.02%, respectively; p < 0.0001).39
Nevertheless, the clinical usefulness of visual assessment seems to be limited, since most pancreatic lesions are harder than the surrounding parenchyma, independent of their histopathologic nature.18
SWS quantification using p-SWE has been proven to be able to distinguish between the pancreas harboring pancreatic cancer, which presents high SWS values (1.51 ± 0.45 m/s) and the pancreas without cancer (1.43 ± 0.28 m/s), thus improving the detection of PDAC.40
Some authors have tried to discriminate between different solid pancreatic lesions using elastosonography, but the results are poor and controversial. While some authors reported good results, with high sensitivity and specificity values (reaching 100% and almost 70%) for the differential diagnosis of malignant pancreatic masses using EUS elastography,41,42 other studies19,20,34 have proven that EUS elastography has a limited value.
Malignant lesions seem to be characterized by higher mean echogenicity at ARFI-VTI when compared to benign lesions:43 in fact it has been demonstrated that the mean echogenicity score of the malignant lesions (3.7 ± 1.0) was higher than that of the benign lesions (3.1 ± 0.4; p = 0.023). On the contrary, although a no statistical difference has been reported on ARFI-VTQ images between benign and malignant lesions (2.4 ± 1.1 m/s versus 3.3 ± 1.0 m/s; p = 0.101), the mean SWS difference between the lesions and the adjacent parenchyma was higher for malignant lesions (1.5 ± 0.8 m/s) as compared to benign lesions (0.4 ± 0.3 m/s).
Pancreatic ductal adenocarcinoma (PDAC) is a solid firm mass, stiffer than the adjacent parenchyma and characterized by intense desmoplasia with a highly fibrotic aspect at histopathologic evaluation. As a consequence, at EUS elastosonography, PDAC usually presents a hard pattern.17,18,19,20,21 At SWS quantification (▶ Fig. 9.5), PDAC is generally characterized by high values.44 The use of elastography with SWS quantification in the study of a pancreatic mass can lead to suspicion of a ductal adenocarcinoma based on the lesion stiffness (▶ Fig. 9.6).
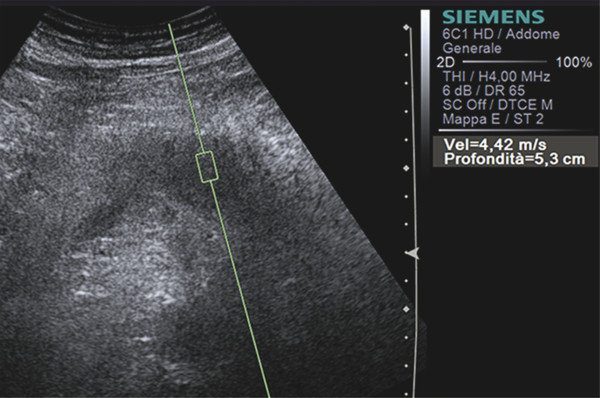
Fig. 9.5 Shear wave speed of a ductal adenocarcinoma of the pancreatic body.
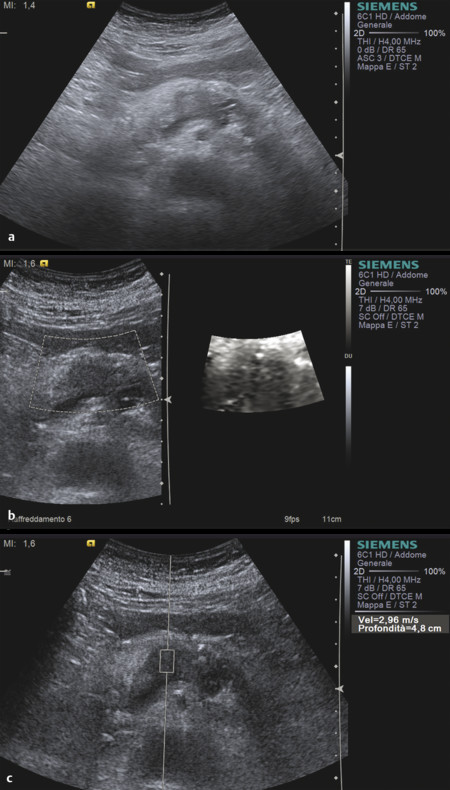
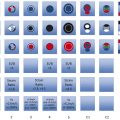
Fig. 9.6 Ductal adenocarcinoma. (a) At B-mode imaging, it appears as an ill-defined hypoechoic area in the pancreatic body . (b) At SWE imaging, the lesion is black due to relative stiffness (c) with high shear wave speeds at quantification.
Related posts:
Stay updated, free articles. Join our Telegram channel

Full access? Get Clinical Tree


