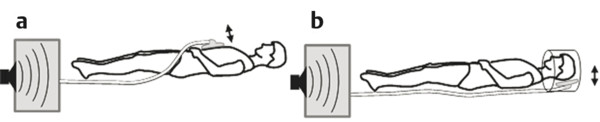
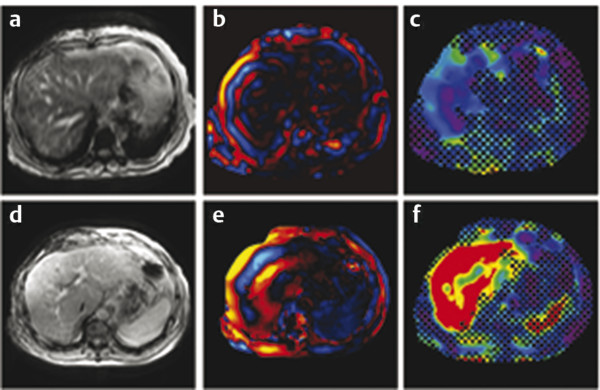
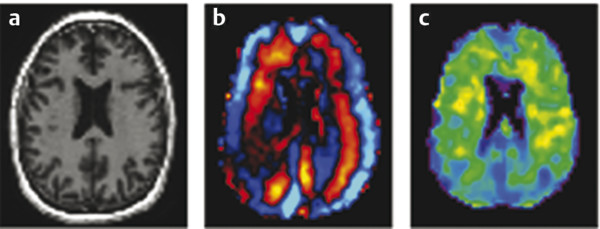
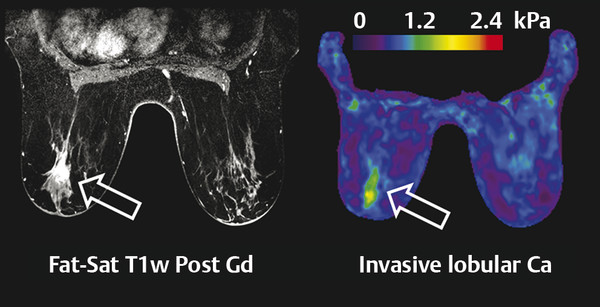
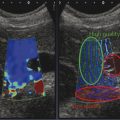
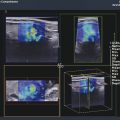
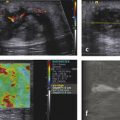
The acoustic waves used in MRE are generated by a dedicated active driver system. Due to the limitation on the use of magnetic components within a strong magnetic field, the active driver is typically located away from the MRI scanner or outside of the scan room, with energy delivered to the patient via a series of tubes or other connectors, and a passive driver coupled to the body. ▶ Fig. 12.1 illustrates the standard driver setups used for abdominal and brain MRE. This setup can deliver compressional sound waves to the body which are mode-converted to shear waves at interfaces between tissues with different acoustic impedances.10 Because the majority of shear waves are generated in tissues, rather than at the driver surface, they have a shorter effective travel distance and experience less attenuation. Additionally, organs behind structures that attenuate shear waves, such as the skull, the rib cage, and fluid,11 can be imaged with this approach. The passive driver can come in the form of a plastic “drum” or a soft “pillow.” The pillow driver, while generating waves with slightly lower efficiency, tends to have a better connection with the body resulting in better energy transfer. As a result, the waves delivered to the liver still have sufficient amplitude and are more parallel, which leads to lower interference and more accurate stiffness images (elastograms). The pillow driver is also more comfortable for the patient. For custom applications higher shear wave frequencies (> 60 Hz) may be useful. These can be generated more efficiently by custom drivers which will be discussed in Section 12.3 Emerging Applications. Fig. 12.1 Common setups for commercial acoustic drivers for liver (a) and brain (b) magnetic resonance elastography. Either two-dimensional (2D) slices or three-dimensional (3D) volumes can be acquired in MRE, thus allowing whole organs to be characterized. Shear wave propagation information is encoded into the MRI phase images while anatomical information is contained in the magnitude image (▶ Fig. 12.2). The encoded phase is directly proportional to the displacement of tissue at every pixel along the direction of motion encoding (typically done in the through-plane direction for clinical MRE). Multiple phase images, with different offsets between the applied motion and encoding (called phase-offsets), are typically acquired to image the wave propagation over time. High-amplitude motion may lead to a phase-wrapping artifact. Phase images are typically preprocessed using phase unwrapping, directional filtering, frequency filtering or curl processing12 (to remove longitudinal waves), polynomial fitting, or another method of smoothing.13 The processed phase images are commonly referred to as wave images. From these, the quantitative elastogram which contains stiffness values at every pixel in units of kilopascals (kPa) is calculated. The wave images and elastograms, or stiffness maps, are often displayed in color but may also be in grayscale. Fig. 12.2 Hepatic magnetic resonance elastography (MRE) of a normal (a, b, c) and a fibrotic (d, e, f) patient. Pathology cannot be identified on the magnitude image (a, d) but is clear on the elastograms (c, f). The checkerboard pattern represents a mask based on the standard confidence threshold of 95%. Note that wave attenuation is higher in soft livers, resulting in (e) having higher wave amplitude than (b). The clinical version of MRE uses a standard inversion, with fixed parameters, to calculate the elastograms. A number of inversions have been developed for the preclinical applications in other organs. Different elasticity parameters may be calculated by the inversions all of which may be loosely referred to as “stiffness” in the literature. Shear modulus, G, is a complex-valued parameter which consists of the storage, G‘, and loss, G”, moduli, G = G‘ + i*G” (sometimes denoted μ = μr + i*μi). G‘ describes how energy is stored and released by tissue. It is sometimes reported as “stiffness” in publications. G” is associated with energy loss in tissue and a delay in stimulus response. A purely elastic material would have G” = 0, no attenuation, and exhibit no delay between applied stress and the response of the tissue. Inversions using shear wave speed (cs) or wavelength (λ) to calculate stiffness cannot calculate G‘ and G”, instead calculating an effective shear modulus equal to ρ*cs2 or ρ*(λ*f),2 where ρ is the tissue density and f is the vibration frequency. Inversions calculating the complex shear modulus may report either its individual parts or its absolute value: Note that all MRE stiffness values in this chapter are given as the shear modulus, G, expressed in kilopascals (kPa), which is approximately one-third of Young’s modulus, which is reported with the ultrasound techniques and also expressed in kilopascals. The value of MRE has been investigated for a number of applications other than hepatic fibrosis staging. Feasibility has been demonstrated in organs such as the brain, kidneys, muscle, and lungs, as well as for tumors in the breast, brain, and liver. A number of applications have demonstrated tentative diagnostic value and are areas of active research and may be available for clinical purposes in the future. The FDA-approved hepatic application with well-established parameters and setup will be covered first, followed by the preclinical applications, which may use either the clinical version of MRE or custom drivers and inversions. The most clinically important and widespread application of MRE is for the detection and staging of hepatic fibrosis. Cirrhosis, with complications in the form of hepatocellular carcinoma and portal hypertension, is among the leading causes of death in many developed countries. Conditions such as hepatitis B and C, nonalcoholic fatty liver disease (NASH), pharmacological toxicity, and biliary obstruction can all lead to inflammation and necrosis of liver parenchyma followed by deposition of a significant amount of extracellular connective tissue resulting in liver fibrosis and, if this process continues, cirrhosis. MRE is able to detect the increase in hepatic stiffness resulting from fibrosis with a remarkable sensitivity of 98% and specificity of 99%.2 Recent evidence shows that fibrosis can be reversed effectively by removal of etiology of chronic liver disease, especially in the case of chronic viral hepatitis with the use of new antiviral treatment.18,19 With the emergence of new therapies and the promise for reversibility of liver fibrosis, a noninvasive and reliable method for fibrosis staging is important for both drug trials and individual patient follow-up and dose optimization. The current gold standard, liver biopsy, carries a risk of complications and is prone to error due to its small sample size and poor interobserver agreement.20,21,22 MRE is able to stage fibrosis noninvasively with high accuracy,8 which is significantly better than a serum liver function test3,23 or any other non-elastography method.6 Ultrasound transient elastography (FibroScan, Echosens, Paris, France) is another method which is able to diagnose fibrosis based on the change in stiffness. It obtains a quantitative stiffness measurement along a one-dimensional (1D) line using an ultrasound transducer to both excite and sample the shear waves. ARFI-based ultrasound elastography techniques can measure liver stiffness in a small (5mm x 5mm) region of interest (point shear wave elastography, [pSWE]) or in a larger field of view of about 20 cm3 (two-dimensional shear wave elastography [2D-SWE]). Some vendors provide real-time 2D-SWE assessment of liver stiffness. MRE has the advantage of being able to sample the entire organ, reducing sampling error, and has little operator dependence. Its accuracy is better than or equal to that of transient elastography,23,24,25,26 while the cost of MRE, when done as part of a limited MR exam, is approximately twice as high as that of FibroScan.26 Contraindications for MRE include those for any MRI study such as patient claustrophobia or metallic implants, though many recent implants, even pacemakers, are made to be MR-safe with limits to the acquisition sequence.27 Two hepatic MRE exams of a nonfibrotic and a cirrhotic patient are shown in ▶ Fig. 12.2. The MRI magnitude images, (a) and (d), show anatomical images. In (b) and (e), single-phase images are shown, containing a snapshot of wave-propagation information. The wavelengths in the cirrhotic patient, in (e), are longer than those in the normal patient. This difference is reflected in the elastograms, (c) and (f). The average hepatic stiffness of healthy subjects at 60 Hz is about 2.1 to 2.3 kPa in the Western population7,28,29 and 2.1 kPa in the Asian population.30 Sex, age, and body mass index do not appear to affect liver stiffness. The diagnostic threshold for separating healthy liver from stage 1 fibrosis is widely accepted as 2.93 kPa.2 The diagnostic gray zone around this threshold in which patient history should be considered with most care is approximately ±0.5 kPa and is roughly based on the standard deviation of stiffnesses in normal subjects, which is 0.3 to 0.6 kPa.2,7 Longitudinal differences in liver stiffness of approximately 20 to 30% (0.6–0.9 kPa for patients with suspected fibrosis) usually represent meaningful changes. Suggested cutoff stiffnesses for higher fibrosis stages can be found in the literature.2,23,24 A number of recent studies using data from large populations retrospectively have confirmed the high accuracy of MRE in fibrosis staging. These studies may lead to a refinement of initial staging thresholds, possibly providing separate cutoff values for different etiologies.3,8,9 The liver is one of the easiest organs for performing elastography as the inversion assumptions are well satisfied due to its size and relative homogeneity and isotropy. Many approaches to acquisition and inversion can yield good results in hepatic tissue. Furthermore, new MRE methods, such as multifrequency MRE31 or faster acquisitions approaches,32 are often tested in the liver. While research papers have significant variation in methodology and parameter settings, the technique used in the FDA-approved clinical MRE is highly standardized. The repeatability of MRE using this methodology is very high, with intraclass correlation coefficients being well above 0.9 for the stiffnesses obtained for repeat acquisitions on the same scanner,33 cross-vendor comparisons,34 and the stiffness calculation from the acquired images.33 The failure rate is also fairly low (about 5.6%) and occurs mainly due to iron overload in the liver or operator error during the MRE driver setup.35 Iron overload causes a decrease in signal intensity due to its T2* effect limiting the ability to monitor the shear waves. Due to the high accuracy, noninvasiveness, and high reproducibility of MRE, a number of clinics are using it in place of biopsy as the primary method of fibrosis detection. The most common indication for an hepatic MRE exam is the presence of known risk factors for fibrosis, such as fatty liver disease, viral hepatitis, or another chronic liver disease. Follow-up of patients with known fibrosis is another common indication. MRE acquisition takes less than a minute, with the elastograms subsequently calculated on the scanner automatically in less than 3 minutes. The data is then transferred to a workstation for region of interest (ROI) drawing performed by technicians or radiologists with special training. MRE can be performed anytime during a liver MRI study or as a single acquisition for the purpose of evaluation of hepatic fibrosis. The liver stiffness is not affected by the presence of gadolinium contrast agents and therefore can be performed before or after a contrast injection.36 Typically, MRE is performed as part of a full or limited abdominal MRI protocol. The combination of MRE and Dixon sequence, enabling fat and iron quantification, is diagnostically beneficial and can be performed in less than 10 minutes. The standard clinical application uses an acoustic active driver (▶ Fig. 12.1a) to deliver 60 Hz waves to a passive driver placed on the abdominal wall of the patient, typically under a receive-only torso coil array used to boost the signal-to-noise ratio (SNR), and secured with an additional strap. A soft passive driver may also be used. Vibration amplitude is typically set at 50% or less of the active driver’s maximum setting37 to achieve sufficient wave penetration across the liver. The images are typically acquired on a 1.5T or a 3T scanner, with sequences available from all major manufacturers. Imaging at 3T generally provides a better SNR; however, it can lead to a higher failure rate in the liver as iron-related signal loss is more significant at 3T and increased iron in the liver co-occurs with fibrosis.38,39 Typical imaging parameters include: 4 slices, each with 4 phase offsets and a resolution of 1.7 × 3.4 × 10mm. Signal saturation below and above the slice of interest and first gradient moment nulling are used to remove blood-flow artifacts. Each slice (all phase offsets) is acquired during a 14 second breath-hold performed at end expiration for reproducibility and tolerability. The superior and inferior slices should be at least 1 cm into the liver to avoid through-plane wave propagation artifacts. The full image acquisition is performed in less than 1 minute and has no operator dependence. A 3D-MRE acquisition, with motion encoding in all three directions, and corresponding inversions have been developed for the liver.31,40 However, the acquisition typically requires multiple breath-holds, which can create inconsistencies between slices and time offsets, and the time requirements are approximately 10 to 15 times greater than for the 2D sequence. For this reason, 2D hepatic MRE, which is effective as long as elastograms are screened for artifacts,41 remains the standard. The processing of clinical liver MRE images is referred to as the multimodel direct inversion (MMDI) algorithm. In a preprocessing step, phase unwrapping and directional filtering are performed and waves with spatial frequencies below 2 cycles per field of view (FOV) and above 128 cycles per FOV are filtered from the image. A processing window of 11 × 11 pixels is used to calculate the elastogram as well as the confidence map for masking out regions with low wave quality. All clinical MRE, as well as research MRE using this implementation, are reported from elastograms masked at 95% confidence to remove regions with low wave quality. To exclude areas with partial-volume or wave-propagation artifacts, magnitude, phase, and elasticity images are reviewed manually to select a ROI for the stiffness measurement which includes all parenchyma while avoiding: Nonhepatic tissue such as blood vessels, hepatic fissures, kidneys, gallbladder, intestines, tumors, etc. Voxels within 5 pixels of the liver boundaries (half the size of the processing kernel) and their partial-volume. Areas where waves are not planar or concentric. While directional filtering is able to handle some wave interference, prominent “swirling” or standing-wave patterns can cause a biased stiffness estimate. An ideal exam should have more than 50 cm3 of artifact-free hepatic tissue available (2000 pixels using the standard resolution) to avoid sampling error and concerns about latent artifacts. The wave-analysis step in the ROI selection process is especially subjective and so the ROI selection should be performed only by trained readers. While the reproducibility of the stiffness measurement from elastograms is good, with intraclass correlations above 0.9 measured in multiple studies,30,42,43 the inter reader variability is the largest limitation to MRE reproducibility.33 An automated method for selecting ROIs has also been developed and validated,42 although it is mainly used in research settings at this time. Patient-specific parameters should always be considered, as in some cases they can affect stiffness and, potentially, confound the diagnosis or staging of disease. Hepatic MRE should be performed on patients in a fasting state, as food intake has been observed to increase liver stiffness by 5 to 48%, particularly in fibrotic patients. The cause of this is likely increased mesenteric flow and portal pressure in the liver, which is not compensated for as effectively in fibrotic patients due to disrupted homeostatic mechanics.44 Other acute or chronic obstructions to the flow of bile or blood may also lead to increased hepatic stiffness. Both hepatic and splenic stiffnesses were found to increase with portal hypertension, which can develop in advanced fibrosis.45 The measurement of the spleen stiffness has been suggested as a way to account for portal hypertension as a confounding variable.40 It may be possible to calculate tissue pressure directly during an MRE exam by using a multifrequency acquisition and a poroelastic inversion,46 although this method is not at a stage for routine clinical use at this time. Inflammation of the liver parenchyma, which may occur in patients with active hepatitis C, for example, can also lead to increased hepatic stiffness.47,48 Hepatic steatosis (deposition of fat in the liver) does not appear to affect stiffness.2 On the other hand, nonalcoholic steatohepatitis (NASH), which is characterized by inflammation and fibrosis, does affect stiffness and can be distinguished from steatosis alone with high accuracy.49 The ability to measure tissue elasticity information is relatively new and its value in various organs and diseases is under active investigation. MRE offers unique advantages in the characterization of several organs. Brain elastography, for example, is currently only feasible with MRE due to strong attenuation of ultrasound signals by the skull. In addition, 3D imaging and motion encoding made possible by MRE allows the complicated wave propagation in heterogeneous organs, like the kidney, or hollow organs, like the heart, to be captured, possibly enabling more accurate stiffness reconstructions. More sophisticated inversions calculating additional elasticity parameters, such as porosity or dispersion information, from multidirectional or multifrequency wave information have also been developed and their clinical value for different applications is being investigated. The following sections will summarize the preferred setups and inversions for use in several organs and the current physiological and pathological findings of those applications. MRE of the brain is an area of active research and significant clinical interest. Changes in the mechanical properties of brain tissue may be a way to detect disease at early stages before anatomical changes take place, or to better characterize distributed damage such as that due to traumatic brain injury. While studies of brain deformation involving tissue stress–strain measurements have been previously performed, the results are highly variable due to the difference in approaches and the fact that the applied stresses may not be well known, and that the measured strain is a relative quantity. A large number of ex vivo mechanical studies of the brain have been performed, but the differences in preparation methods, the type of tissue studied, and animal species studied make results significantly variable.50,51,52 Due to attenuation within the skull, the only ultrasound elastography application in the brain has been in intraoperative procedures.53 MRE is thus the only technique at the moment capable of providing absolute quantitative insight into the viscoelastic properties of in vivo normal brain physiology and disease processes noninvasively. A set of MRE images from a brain exam are shown in ▶ Fig. 12.3. The normal brain stiffness has been calculated by several studies and is shown in ▶ Table 12.1. Fig. 12.3 Example of brain magnetic resonance elastography (MRE). (a) Anatomical magnitude image; (b) shear waves are generated by the skull and propagate inward from all directions (sagittal and coronal motion images not shown); (c) elastogram is eroded from cerebral spinal fluid (CSF) by the size of the processing kernel. (Courtesy of Dr. John Houston and Dr. Arvin Arani.) Subjects Frequency (Hz) Stiffness (kPa) Quantity calculated Study 45 60 2.6–3.0, depending on region G’ Arani et al 201554 38 25–62.5 WB: 3.3 |G| Streitberger et al 201255 10 60 WB: 2.99, CB: 2.38 |G| Murphy et al 201356 8 80 WM: 2.41 + i1.21 G’ + iG’’ Zhang et al 201157 5 90 GM: 3.1 + i2.5, WM: 2.7 + i2.5 G’ + iG’’ Gree et al 200858 Abbreviations: WB, whole brain; WM, white matter; GM, gray matter; CB, cerebellum. As can be seen in ▶ Table 12.1, the mean stiffness of the normal brain has been measured in numerous studies and has resulted in fairly similar values. However, due to the studies having used different frequencies and inversions and some studies having limited patient populations, more investigation is needed to understand the range of normal variations and to determine the threshold stiffness for different diseases. The normal brain stiffness has been observed to change based on age and sex, so patient matching should be done when drawing comparisons. Significant differences in regional brain stiffness based on age and sex have been reported in an older adult population.54 The cerebrum, as well as the frontal, temporal, occipital, and parietal lobes, were reported to become approximately 10 to 15% softer between the ages of 60 and 90 years. Female occipital and temporal lobes were 10% and 5% stiffer than their male counterparts. Another study,59 using a greater age range of 20- to 80-years-old, found a linear decrease in the shear modulus of 150 Pa (or 8% stiffness) per decade, with the ratio of storage modulus to loss modulus remaining the same with age and with women having stiffer brains than men. Diseases such as multiple sclerosis (MS) and Alzheimer’s disease (AD) cause axonal degradation secondary to demyelination and plaque buildup, respectively. Investigations were done into whether or not these processes lead to mechanical changes detectable by MRE and have yielded tentatively promising results. One study of AD60 found a significant difference between the median whole-brain stiffnesses of AD patients (2.2 kPa, range 1.96–2.29; n = 7) and gender- and/or age-matched Pittsburgh compound B [PIB]-negative controls (2.37 kPa, range 2.17–2.62; n = 7) and PIB-positive cognitively normal controls (2.32 kPa, range 2.18–2.67; n = 7), with the two control groups not being significantly different. Similarly, an animal study using an AD mouse model found a 22.5% lower stiffness in diseased mice than the control mice.61 Patients with MS were also found to have a reduced brain stiffness (-20%) in a study of 23 patients and 38 controls.55 The value of alpha, the power law exponent determining the frequency dependence of stiffness, also decreased by 6.1%. The patients were at a moderate-advanced disease stage, however, with brain volume loss in the range of 1.7 to 7.5%. In a mouse model, it was found that demyelination caused a significant reduction in viscoelasticity parameters, with the loss modulus decreasing faster than the storage modulus. The stiffness change was found to be reversible if remyelination occurred.62 Normal pressure hydrocephalus (NPH), a condition characterized by dementia and a progressive gait disorder, is another condition where shear and loss moduli of patients have been found to be significantly lower, by about 20%, than those of the normal volunteers.63 The exponent of the power law material model used in this multifrequency study was also decreased in patients by 9%, causing the stiffness to increase less with vibrational frequency. This parameter was described as a measurement of tissue structure by the authors. Three months following shunt treatment to drain cerebrospinal fluid (CSF), the patient shear moduli and the structure parameter increased and ceased to be significantly different from those of the normal volunteers. Finally, a study of autoimmune encephalomyelitis (AE) in rats also found that acute necroinflammation (14 days after immunization) leads to a decrease in both storage and loss moduli.64 The moduli normalized at day 28, corresponding to the clinical recovery stage. Interestingly, this finding is the opposite of the necroinflammation studies in the human liver which found that stiffness increases with inflammation.65,66Further studies into the effects of these physiological changes are warranted. In most diseases (except brain tumors, covered in Section 12.3.2, Tumor Characterization and Treatment Response), the stiffness (including the storage and loss moduli) and sometimes the exponential frequency scaling coefficient have been observed to decrease with respect to the normal value. The results in AD, MS, NPH, and AE are intriguing, though further studies evaluating the diagnostic performance of MRE with respect to existing methods and in the context of different disease stages are needed. The new information provided by elastography may be of value either as a standalone or as an additional biomarker for these diseases. To deliver waves into the brain past the mechanical shielding of the skull, instead of applying shear waves directly to the skull, brain MRE shakes the skull (▶ Fig. 12.1b) to generate shear waves at internal interfaces through inertial effects. In all brain MRE techniques used in clinical studies, the head itself is rocked either via an acoustic pillow driver54 or by an electromechanically driven head cradle.67 In mice studies, an electromechanically driven bite-bar driver has also been used.64 As the direction of motion in the brain cannot be guaranteed to be planar, full 3D-MRE acquisitions and inversions are used in the brain. Either single-frequency excitations (in the 60–100 Hz range)54,68 or multifrequency excitations (with 4 frequencies in the 25 to 62.5 Hz range) have been used.59,63,67,69 The choice of excitation frequency is a balance between the resolution of the elastogram and wave attenuation. At 100 Hz, approximately 50% of the brain (deep tissue) has been masked out due to having an insufficient SNR in some studies.52 The use of higher frequencies allows different structures, such as white and gray matter, to be separated without significant partial-volume effects. Thus, lower frequency approaches typically report larger regional or whole-brain stiffnesses. Multifrequency MRE allows additional parameters, such as the power law coefficient for stiffness change with frequency or poroelasticity coefficients, to be calculated. At this time, these additional parameters have not been demonstrated to give a better separation between normal and abnormal tissues than stiffness alone. Other sources of vibration, including physiological cardiac pulsation,70 motion of the patient table,71 and patient humming69 (with frequency recorded by a microphone being used to adjust gradient encoding frequency) have been explored. While the motion amplitude of these approaches is generally sufficient, their reproducibility is not as high as that for a more typical driver system. The images are typically acquired using 3T scanners, and sometimes higher field strengths. Susceptibility-related signal fall-off, such as that seen in the liver and lung, is not as big a concern in the brain, except in the vicinity of sinuses which contain air. The higher field strength is preferred for better SNR. A direct inversion (DI) of the Helmholtz equation is typically used to calculate the stiffness in brain MRE. Additional parameters may be calculated if multiple frequencies are acquired, and curl filtering, enabled by the full 3D vector MRE acquisition, is almost always used as a preprocessing step to remove longitudinal waves. Due to the irregular shape of tissue boundaries both within and at the surface of the brain, a small-sized processing kernel is typically used in the brain (3 × 3 × 3 voxels, vs 11×11 for liver) to improve the resolution of the elastogram. This leads to increased variability in the reconstructed stiffness, manifesting as “spike” noise. A median filter can be used to reduce the elastogram noise and has been used to smooth data for display purposes. Reporting median stiffnesses, rather than mean stiffnessses, is another way to reduce the noise.54 A more traditional smoothing filter (moving average or gaussian smoothing), is not effective at removing the spike noise, however. There are several approaches to prevent partial-volume effects from different tissues (especially CSF), which are blurred together due to the effective inversion kernel size, from biasing the stiffness of a region. One suggested solution to the trade-off between excluding regions affected by partial-volume effects and keeping as much of the brain tissue as possible was to design all filtering and processing kernels in the spatial, rather than the spatial-frequency, domain, so that the extent of the bias from partial-volume effects is known exactly.56 The resulting kernels required 3 pixels to be eroded from the masks to avoid partial-volume effects. Additionally, an image classification technique based on a separately acquired and registered registered 3D Inversion Recovery-Spoiled Gradient echo (IR-SPGR) T1 volume56 with high anatomical quality has been used to calculate fractions of white matter, gray matter, and CSF in each voxel and to remove voxels with > 30% CSF.72 Another approach, which has been applied to finite-element inversions, but need not be limited to them, was to regularize the stiffness inversion itself based on tissue segmentations.73 This approach makes it more likely for voxels that were segmented as the same tissue type to have similar stiffnesses in the elastogram. As long as the segmentation, done on a separate high-quality T1-weighted anatomical magnetized-prepared rapid acquisition gradient echo magnetic resonance imaging (MPRAGE MRI) is reliable and the registration of the images is good, this approach has the advantage of being able to handle complex tissue boundaries. Automated segmentation of anatomical images is used actively to determine whole-brain ROIs or measure regional stiffnesses using a registration-based atlas segmentation.54 The success of the segmentations is enabled by minimal patient motion of the head during brain MRE scans and fairly consistent relative tissue intensities. Wave attenuation is high in the brain, as reflected by the loss modulus being an order of magnitude higher than that in the liver, and a metric for excluding low SNR regions is useful. Motion SNR, measured directly from phase images, has been used to mask the brain with a threshold of 5.56 The shear-strain SNR has been suggested as a more direct way of predicting the bias of noise on the stiffness reconstruction.74 Its calculation requires motion encoding in all three directions, which is available in brain MRE. A threshold of 4 has been suggested for brain tissue. However, the value of shear-strain SNR changes with wavelength and the value of the threshold may need to be redefined depending on the frequencies used. Nearly all SNR or quality-of-fit measurements change with frequency filtering (smoothing), acquisition resolution, and the size of the processing kernel, so these should be kept constant whenever possible. No manual ROI selection is done in brain MRE to exclude areas with wave interference, though manual segmentation of brain tissue types based on the anatomical images is sometimes done. As discussed previously, age, sex,54 and inflammation,64 are known to affect brain stiffness. Intracranial pressure is also likely to be a factor based in the observed changes in stiffness seen in the liver due to portal hypertension.44 The microenvironment of tumors often contains a significant amount of connective tissue, which is organized differently from normal parenchyma. Tumors in superficial organs, such as the breast and lymph nodes, are commonly screened using palpation as their elastic properties are known to contrast with regular tissues. Increased stiffness of the tumor microenvironment has additionally been observed to contribute to tumor progression and metastasis.75,76,77 The ability to quantitatively study the elastic properties of tumors noninvasively in vivo is new. This section demonstrates the feasibility of using MRE to measure tumor stiffness in a multitude of organs and examines the known clinical applications and preferred imaging methods for tumor MRE. The stiffness of a tumor may be of direct clinical interest in some cases. During the resection of meningiomas in the brain, softer tumors can be removed with suctioning, while stiffer tumors require tedious dissections resulting in longer procedures. The stiffnesses of meningiomas in 12 patients were assessed using a standard brain MRE technique.78 The stiffness measured with MRE was found to correlate significantly with the qualitative rating given by the surgeon at the time of operation and be a better treatment planning predictor than the T1- and T2-weighted anatomical MRI used currently. The ability to distinguish benign tumors from malignant ones is of paramount importance. In the breast, contrast-enhanced MRI (CE-MRI) has the ability to detect tumors with a 98% sensitivity.79 However, the technique lacks specificity, leading to many unnecessary biopsies. 3D-MRE performed at 65 Hz found that the shear moduli of cancerous tumors were higher than those of benign tumors (1.3 kPa for fibroadenomas and 1.2 kPa for mastopathy), which were stiffer than normal parenchyma (0.87 kPa).12 A later study with 39 patients having malignant tumors and 29 having benign tumors found a similar, statistically significant, order of stiffnesses:malignant > benign > normal tissue.80 Furthermore, using multifrequency data, the study determined that malignant lesions had a high power law coefficient (stiffness increased faster with frequency) and low attenuation, while benign tumors had the opposite relationship. The MRE-derived loss modulus was capable of separating the two groups with high accuracy (area under the receiver operating characteristic curve [AUROC] = 0.91) and when combined with CE-MRE led to a specificity increase from 40% (for CE-MRE alone) to 60%, with the AUROC increasing to 0.96. Similar results were observed in a later study of 57 patients where the accuracy of MRE alone rivaled that of CE-MRI (AUROC of 0.91 versus 0.93), and their combination resulted in an improvement of the AUROC to 0.96, mainly due to increased specificity.81 An example of a breast tumor MRE is shown in ▶ Fig. 12.4. Fig. 12.4 Magnetic resonance elastography (MRE) of ductal carcinoma. (a) Contrast-enhanced magnetic resonance imaging (MRI) shows enhancing lesion; (b) MRE detects lesion with high contrast from parenchyma. (Courtesy of Dr. Jun Chen.)
 . This quantity is also called “stiffness” or “shear stiffness” in many publications and is the quantity calculated by the FDA-approved clinical version on MRE. The magnitude of the shear modulus, |G|, will always be greater than the storage modulus, with the difference ranging between 10% and 50% for most tissues, depending on the value of G”. Young’s modulus, reported in ultrasound, is very nearly equal to 3
 . Note that all shear moduli have units of kilopascals (kPa). Clinical hepatic MRE reports the shear modulus, which is directly related to Young’s modulus used in ultrasound. The moduli used in other applications are noted in the corresponding sections. Custom inversions may be able to calculate other parameters, usually requiring multifrequency acquisitions,14,15,16,17 which may have a higher predictive value than stiffness in a particular application. The shear and loss moduli, as well as the shear wave attenuation, tend to increase with frequency, and their values should only be compared at the same, or similar, frequencies.
12.2 Magnetic Resonance Elastography of Hepatic Fibrosis
12.2.1 Acquisition
12.2.2 Processing and Quality Control
12.2.3 Physiological Confounders
12.3 Emerging Applications
12.3.1 Brain Magnetic Resonance Elastography
Acquisition
Processing and Quality Control
Physiological Confounders
12.3.2 Tumor Characterization and Treatment Response
Related posts:
Stay updated, free articles. Join our Telegram channel

Full access? Get Clinical Tree


